
盛天Tradingviewst
1.1k Posts

盛天Tradingviewst
Report
Block User
师承MarkMinervini 盛天资本/让交易变简单Tg频道Aitecoin 推特X👉Aitcoinst專為短線設計/結合量價分析/告別盲目操作/只用數據說話👉盛天®社區专用指标👉盛天聰明錢系统/可以解决交易员的持仓焦虑病症!
Open Trade

BTC Holder
Frequent Trader
1.1 Years
1.2K+ Following
22.4K+ Followers
3.3K+ Liked
Posts
Portfolio
All
Quotes
Videos
Live
PINNED
·
--
Bearish
Verified
Getting beaten from both sides, waiting for the Fed to save me
The worst trading plot of the year—today it fully played out on me😭
I stared at the latest CPI data, analyzed it carefully, confidently decided to short, and then got instantly and deeply trapped. My paper losses are glued there tight—I can’t move at all.
I thought dodging one data trap was already bad enough, but I never expected another blow midway!
Out of nowhere I ran into #拜登儿子发币 $ETH liquidation, with #币圈 tactics maxed out. Retail investors have zero chance to fight back. Bidirectional burying—my HP bar is cleared instantly.
Now I’m completely lying flat. Positions locked, mindset shattered—watching the Fed’s rate-meeting expectations as my self-rescue the whole time.
Right now, the market’s rate-hike expectations are directly spiking: the probability of a hike in September has surged to nearly 90%, and multiple institutions have already pre-judged the rate-hike move will be delivered.
Honestly, it’s humiliating to the extreme. I’m not hoping for price action, and not hoping for a rebound—
I’m just kneeling and begging the Fed to raise rates to rescue the market!!
Can this end my chain of losses? Help me force an exit from being deeply trapped—it all depends on this rate-meeting decision🙏
The trading market has never been about reason. Even a painstaking review can’t beat a sudden tactics drop. Careful analysis can’t outdo message-driven liquidation. I really got taught a lesson by the market.
Is there anyone else with the same twin-sided beatdown, lying-flat waiting-for-Fed-rescue situation? Let’s huddle together and take care of each other!
#CPI data #Fed rate hike #trading trapped #crypto liquidation #retail investor daily life #investment heartache#CPI数据来袭能否触发9月加息
{future}(ETHUSDT)
Getting beaten from both sides, waiting for the Fed to save me
The worst trading plot of the year—today it fully played out on me😭
I stared at the latest CPI data, analyzed it carefully, confidently decided to short, and then got instantly and deeply trapped. My paper losses are glued there tight—I can’t move at all.
I thought dodging one data trap was already bad enough, but I never expected another blow midway!
Out of nowhere I ran into #拜登儿子发币 $ETH liquidation, with #币圈 tactics maxed out. Retail investors have zero chance to fight back. Bidirectional burying—my HP bar is cleared instantly.
Now I’m completely lying flat. Positions locked, mindset shattered—watching the Fed’s rate-meeting expectations as my self-rescue the whole time.
Right now, the market’s rate-hike expectations are directly spiking: the probability of a hike in September has surged to nearly 90%, and multiple institutions have already pre-judged the rate-hike move will be delivered.
Honestly, it’s humiliating to the extreme. I’m not hoping for price action, and not hoping for a rebound—
I’m just kneeling and begging the Fed to raise rates to rescue the market!!
Can this end my chain of losses? Help me force an exit from being deeply trapped—it all depends on this rate-meeting decision🙏
The trading market has never been about reason. Even a painstaking review can’t beat a sudden tactics drop. Careful analysis can’t outdo message-driven liquidation. I really got taught a lesson by the market.
Is there anyone else with the same twin-sided beatdown, lying-flat waiting-for-Fed-rescue situation? Let’s huddle together and take care of each other!
#CPI data #Fed rate hike #trading trapped #crypto liquidation #retail investor daily life #investment heartache#CPI数据来袭能否触发9月加息
The worst trading plot of the year—today it fully played out on me😭
I stared at the latest CPI data, analyzed it carefully, confidently decided to short, and then got instantly and deeply trapped. My paper losses are glued there tight—I can’t move at all.
I thought dodging one data trap was already bad enough, but I never expected another blow midway!
Out of nowhere I ran into #拜登儿子发币 $ETH liquidation, with #币圈 tactics maxed out. Retail investors have zero chance to fight back. Bidirectional burying—my HP bar is cleared instantly.
Now I’m completely lying flat. Positions locked, mindset shattered—watching the Fed’s rate-meeting expectations as my self-rescue the whole time.
Right now, the market’s rate-hike expectations are directly spiking: the probability of a hike in September has surged to nearly 90%, and multiple institutions have already pre-judged the rate-hike move will be delivered.
Honestly, it’s humiliating to the extreme. I’m not hoping for price action, and not hoping for a rebound—
I’m just kneeling and begging the Fed to raise rates to rescue the market!!
Can this end my chain of losses? Help me force an exit from being deeply trapped—it all depends on this rate-meeting decision🙏
The trading market has never been about reason. Even a painstaking review can’t beat a sudden tactics drop. Careful analysis can’t outdo message-driven liquidation. I really got taught a lesson by the market.
Is there anyone else with the same twin-sided beatdown, lying-flat waiting-for-Fed-rescue situation? Let’s huddle together and take care of each other!
#CPI data #Fed rate hike #trading trapped #crypto liquidation #retail investor daily life #investment heartache#CPI数据来袭能否触发9月加息


2.8k
8
176
2.8k

Listening to the Wind at a Small Pavilion, the Coin Circle's Billows
Listening to the Wind at a Small Pavilion, the Coin Circle's Billows


听澜321
·
--
[Replay] 🎙️ Build Binance Square, hold BNB|Saturday: Non-Farm beat expectations, CPI data is out—do you think the Fed will raise rates or keep them unchanged? Let’s chat~
05 h 18 m 34 s · 10.8k listens
81
🎙️ Build the Binance Square, hold BNB|Saturday, Non-Farm Payrolls beat expectations, CPI data is out—do you think the Fed will raise rates or stay on hold? Let’s discuss~

End
05 h 18 m 34 s
10.6k
49
46
Consists of two K-lines, appearing at the low point of a downtrend.
The first one is a bearish candle (red): the real body is relatively small, indicating that the selling pressure (downward momentum) is weakening.
The second one is a long bullish candle (green): its real body completely engulfs the entire real body of the preceding bearish candle (and even includes the upper and lower shadows).
The pattern looks like “a big fish swallowing a small fish,” so it is metaphorically called “engulfing.”
✅ Market meaning
During a decline, you first see a bearish candle → then bulls launch a strong counterattack and buying demand suddenly surges, causing the price to rebound sharply and “swallow up” all of the previous day’s losses.
This is a strong bullish reversal signal: it suggests the bears are no longer able to keep pushing down, and the bulls have taken control. The market is highly likely to shift from falling to rising.
Chart movement: a wave of decline → bullish engulfing appears → the price keeps rising → perfectly confirms the reversal signal’s effectiveness#BTC触及80000美元 $BTC
{future}(BTCUSDT)
Consists of two K-lines, appearing at the low point of a downtrend.
The first one is a bearish candle (red): the real body is relatively small, indicating that the selling pressure (downward momentum) is weakening.
The second one is a long bullish candle (green): its real body completely engulfs the entire real body of the preceding bearish candle (and even includes the upper and lower shadows).
The pattern looks like “a big fish swallowing a small fish,” so it is metaphorically called “engulfing.”
✅ Market meaning
During a decline, you first see a bearish candle → then bulls launch a strong counterattack and buying demand suddenly surges, causing the price to rebound sharply and “swallow up” all of the previous day’s losses.
This is a strong bullish reversal signal: it suggests the bears are no longer able to keep pushing down, and the bulls have taken control. The market is highly likely to shift from falling to rising.
Chart movement: a wave of decline → bullish engulfing appears → the price keeps rising → perfectly confirms the reversal signal’s effectiveness#BTC触及80000美元 $BTC
The first one is a bearish candle (red): the real body is relatively small, indicating that the selling pressure (downward momentum) is weakening.
The second one is a long bullish candle (green): its real body completely engulfs the entire real body of the preceding bearish candle (and even includes the upper and lower shadows).
The pattern looks like “a big fish swallowing a small fish,” so it is metaphorically called “engulfing.”
✅ Market meaning
During a decline, you first see a bearish candle → then bulls launch a strong counterattack and buying demand suddenly surges, causing the price to rebound sharply and “swallow up” all of the previous day’s losses.
This is a strong bullish reversal signal: it suggests the bears are no longer able to keep pushing down, and the bulls have taken control. The market is highly likely to shift from falling to rising.
Chart movement: a wave of decline → bullish engulfing appears → the price keeps rising → perfectly confirms the reversal signal’s effectiveness#BTC触及80000美元 $BTC

2
621
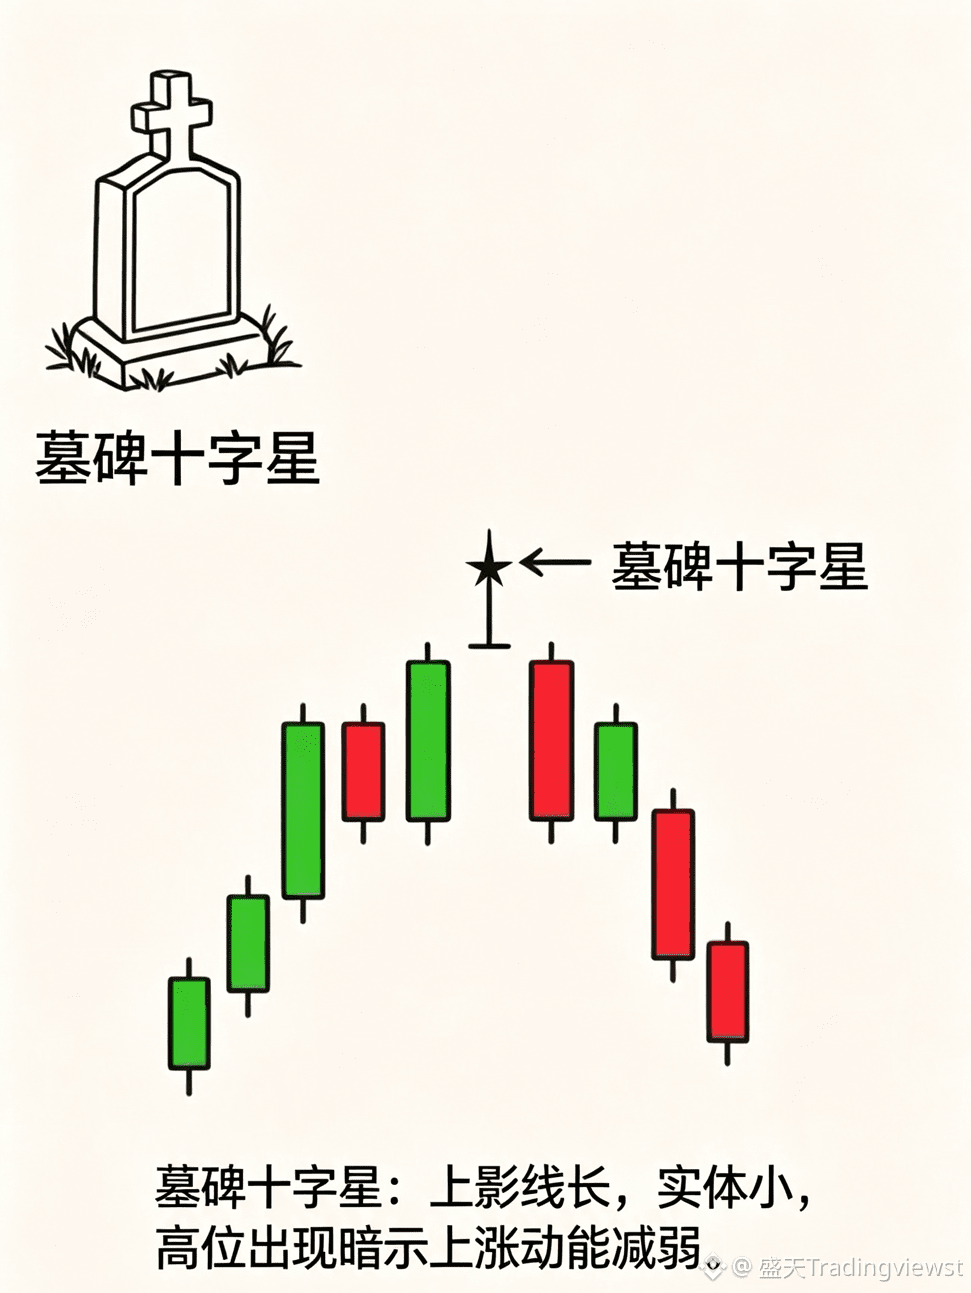
Tombstone Doji
✅ Morphological Features
Very short body (opening price ≈ closing price), located at the very bottom of the candlestick
Long upper shadow (about 2–3 times the length of the body, or even longer)
Almost no lower shadow
Overall looks like a “tombstone,” hence the name
✅ Market Meaning
Appearing at the high end of an uptrend = a strong bearish reversal signal ⛔
The long upper shadow indicates: the price first spikes sharply upward, then gets pushed back toward the opening price by a large volume of sell orders → heavy selling pressure overhead, bulls lack the strength to hold, and the upward momentum is exhausted
The longer the “tombstone” and the longer it appears at a high level, the stronger the reliability of the top-and-reversal signal
Chart shown: a wave of上涨 → forms a tombstone doji → price turns and falls → perfectly validates its role as a “top signal” #俄乌同时宣布停火3天 $ZEC
{future}(ZECUSDT)
Tombstone Doji
✅ Morphological Features
Very short body (opening price ≈ closing price), located at the very bottom of the candlestick
Long upper shadow (about 2–3 times the length of the body, or even longer)
Almost no lower shadow
Overall looks like a “tombstone,” hence the name
✅ Market Meaning
Appearing at the high end of an uptrend = a strong bearish reversal signal ⛔
The long upper shadow indicates: the price first spikes sharply upward, then gets pushed back toward the opening price by a large volume of sell orders → heavy selling pressure overhead, bulls lack the strength to hold, and the upward momentum is exhausted
The longer the “tombstone” and the longer it appears at a high level, the stronger the reliability of the top-and-reversal signal
Chart shown: a wave of上涨 → forms a tombstone doji → price turns and falls → perfectly validates its role as a “top signal” #俄乌同时宣布停火3天 $ZEC
✅ Morphological Features
Very short body (opening price ≈ closing price), located at the very bottom of the candlestick
Long upper shadow (about 2–3 times the length of the body, or even longer)
Almost no lower shadow
Overall looks like a “tombstone,” hence the name
✅ Market Meaning
Appearing at the high end of an uptrend = a strong bearish reversal signal ⛔
The long upper shadow indicates: the price first spikes sharply upward, then gets pushed back toward the opening price by a large volume of sell orders → heavy selling pressure overhead, bulls lack the strength to hold, and the upward momentum is exhausted
The longer the “tombstone” and the longer it appears at a high level, the stronger the reliability of the top-and-reversal signal
Chart shown: a wave of上涨 → forms a tombstone doji → price turns and falls → perfectly validates its role as a “top signal” #俄乌同时宣布停火3天 $ZEC
1
483
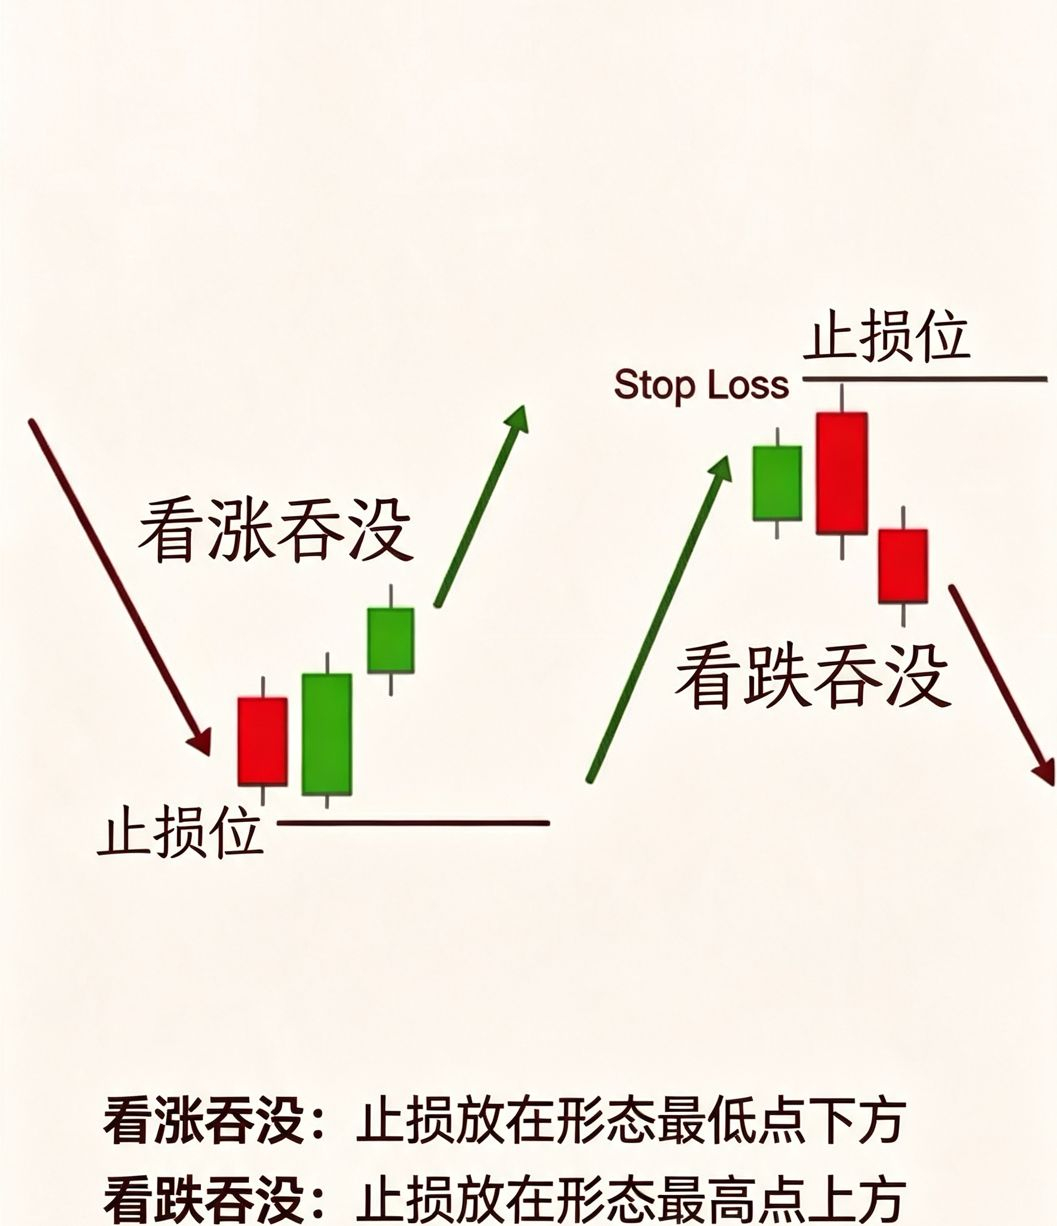
🟢 Left side: #看涨 engulfing pattern・stop loss settings
Pattern name: Bullish engulfing (white engulfing black)
Occurrence location: Lower end of a downtrend
Stop loss location: Place it below the lowest point of the entire candlestick (the engulfing pattern) (marked by the red line in the figure)
Principle: If the price breaks below the pattern’s lowest point, it means the bullish outlook is invalid—exit promptly to control losses
🔴 Right side: #看跌 engulfing pattern・stop loss settings
Pattern name: Bearish engulfing (black engulfing white)
Occurrence location: Upper end of an uptrend
Stop loss location: Place it above the highest point of the entire candlestick (the engulfing pattern) (marked by the red line in the figure)
Principle: If the price breaks above the pattern’s highest point, it means the bearish outlook is invalid—exit promptly to control losses$BTC
{future}(BTCUSDT)
🟢 Left side: #看涨 engulfing pattern・stop loss settings
Pattern name: Bullish engulfing (white engulfing black)
Occurrence location: Lower end of a downtrend
Stop loss location: Place it below the lowest point of the entire candlestick (the engulfing pattern) (marked by the red line in the figure)
Principle: If the price breaks below the pattern’s lowest point, it means the bullish outlook is invalid—exit promptly to control losses
🔴 Right side: #看跌 engulfing pattern・stop loss settings
Pattern name: Bearish engulfing (black engulfing white)
Occurrence location: Upper end of an uptrend
Stop loss location: Place it above the highest point of the entire candlestick (the engulfing pattern) (marked by the red line in the figure)
Principle: If the price breaks above the pattern’s highest point, it means the bearish outlook is invalid—exit promptly to control losses$BTC
Pattern name: Bullish engulfing (white engulfing black)
Occurrence location: Lower end of a downtrend
Stop loss location: Place it below the lowest point of the entire candlestick (the engulfing pattern) (marked by the red line in the figure)
Principle: If the price breaks below the pattern’s lowest point, it means the bullish outlook is invalid—exit promptly to control losses
🔴 Right side: #看跌 engulfing pattern・stop loss settings
Pattern name: Bearish engulfing (black engulfing white)
Occurrence location: Upper end of an uptrend
Stop loss location: Place it above the highest point of the entire candlestick (the engulfing pattern) (marked by the red line in the figure)
Principle: If the price breaks above the pattern’s highest point, it means the bearish outlook is invalid—exit promptly to control losses$BTC
246
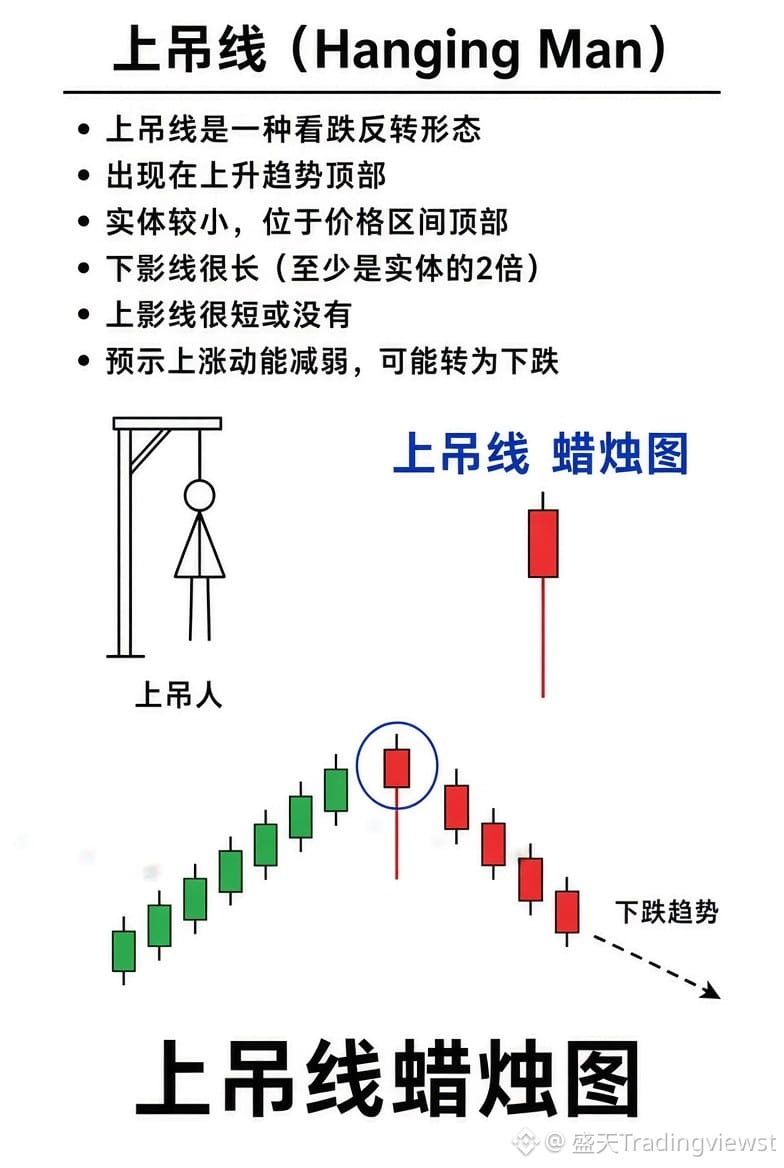
Hanging Man Line
The real body is very small (located at the very top of the candlestick)
The lower shadow is very long (about 2–3 times the length of the real body, or even longer)
There is almost no upper shadow
Overall it looks like a “person being hoisted,” hence the name
⚠️ The pattern is exactly the same as the Hammer line—the only difference is the location where it appears!
Appears at the high end of an uptrend = a strong bearish reversal signal ⛔
A long lower shadow indicates: the price first dips slightly, then bounces back toward the opening price—however, when this forms at a high level, it suggests that support below has weakened, buyers lack the strength to push prices higher again, and the upward momentum has exhausted. It serves as a warning that the uptrend is nearing its end and a fall is likely.
Chart move: an upswing → the highest point forms a Hanging Man line → the price turns and starts to decline → perfect confirmation of the bearish reversal effect$HYPE
{future}(HYPEUSDT)
Hanging Man Line
The real body is very small (located at the very top of the candlestick)
The lower shadow is very long (about 2–3 times the length of the real body, or even longer)
There is almost no upper shadow
Overall it looks like a “person being hoisted,” hence the name
⚠️ The pattern is exactly the same as the Hammer line—the only difference is the location where it appears!
Appears at the high end of an uptrend = a strong bearish reversal signal ⛔
A long lower shadow indicates: the price first dips slightly, then bounces back toward the opening price—however, when this forms at a high level, it suggests that support below has weakened, buyers lack the strength to push prices higher again, and the upward momentum has exhausted. It serves as a warning that the uptrend is nearing its end and a fall is likely.
Chart move: an upswing → the highest point forms a Hanging Man line → the price turns and starts to decline → perfect confirmation of the bearish reversal effect$HYPE
The real body is very small (located at the very top of the candlestick)
The lower shadow is very long (about 2–3 times the length of the real body, or even longer)
There is almost no upper shadow
Overall it looks like a “person being hoisted,” hence the name
⚠️ The pattern is exactly the same as the Hammer line—the only difference is the location where it appears!
Appears at the high end of an uptrend = a strong bearish reversal signal ⛔
A long lower shadow indicates: the price first dips slightly, then bounces back toward the opening price—however, when this forms at a high level, it suggests that support below has weakened, buyers lack the strength to push prices higher again, and the upward momentum has exhausted. It serves as a warning that the uptrend is nearing its end and a fall is likely.
Chart move: an upswing → the highest point forms a Hanging Man line → the price turns and starts to decline → perfect confirmation of the bearish reversal effect$HYPE
2
413
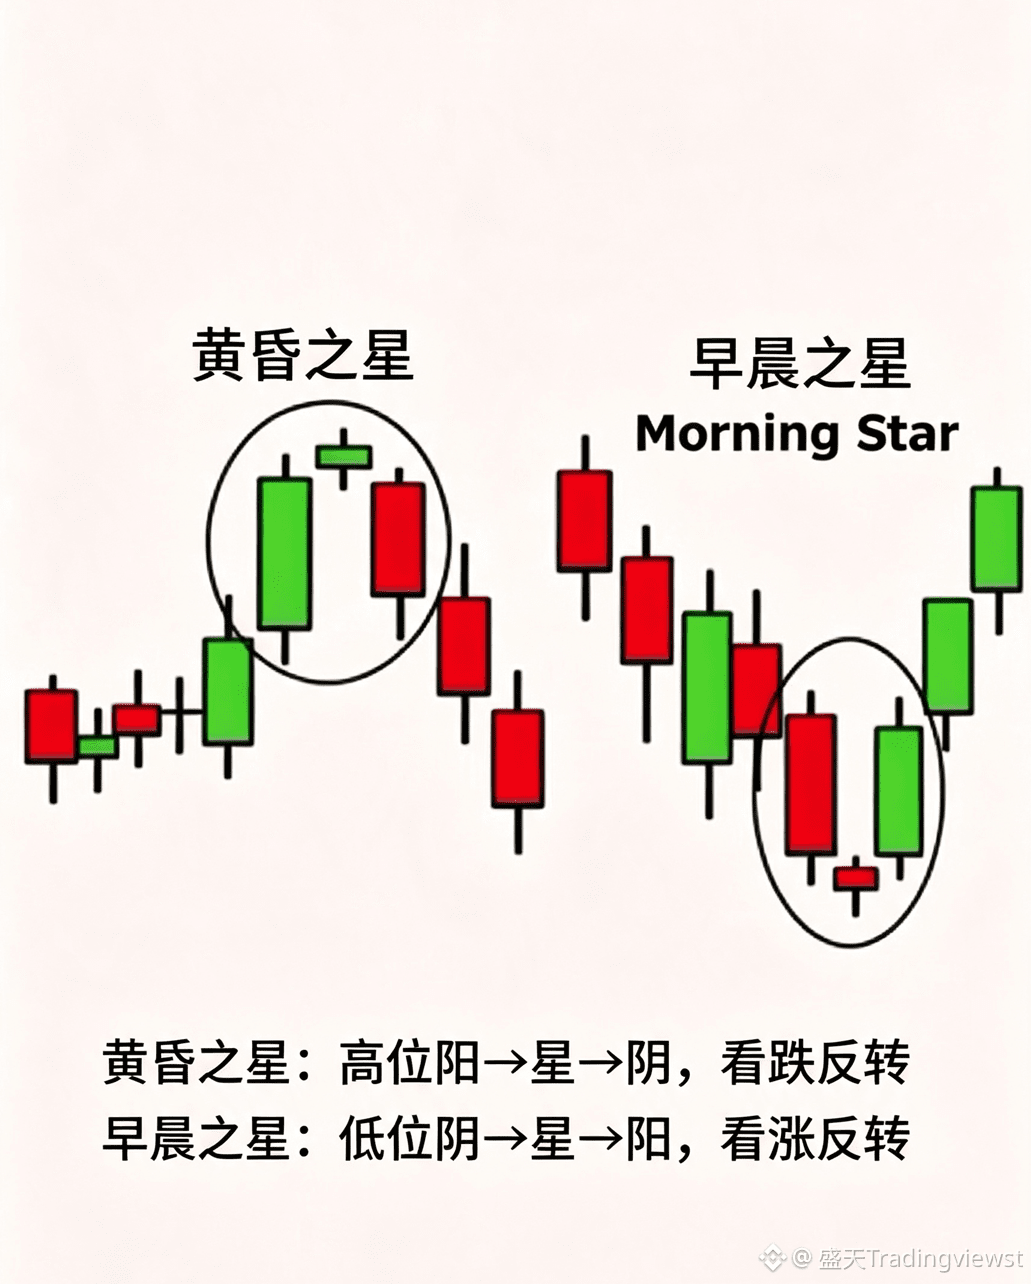
Evening Star → Evening Star / Dusk Star
Morning Star → Morning Star / Morning Star
✅ Structural pattern (all consist of 3 candlesticks)
🌅 Morning Star (Morning Star) — bullish reversal at a low level
First candlestick: long bearish candlestick (red), in a downtrend
Second candlestick: small-bodied candlestick (doji / small bearish / small bullish), body gaps downward, like a star
Third candlestick: long bullish candlestick (green), with the body penetrating into the body of the first bearish candlestick
Meaning: downward momentum exhausts → bulls and bears reach balance → bulls counterattack strongly → stop falling and rebound
🌆 Evening Star — bearish reversal at a high level
First candlestick: long bullish candlestick (green), in an uptrend
Second candlestick: small-bodied candlestick (doji / small bearish / small bullish), body gaps upward, like a star
Third candlestick: long bearish candlestick (red), with the body penetrating into the body of the first bullish candlestick
Meaning: upward momentum exhausts → bulls and bears reach balance → bears counterattack strongly → top out and pull back#BTC触及80000美元 $H
{alpha}(10xe76c5b78f93909d34404e9eb4c1f19e7582a5de1)
Evening Star → Evening Star / Dusk Star
Morning Star → Morning Star / Morning Star
✅ Structural pattern (all consist of 3 candlesticks)
🌅 Morning Star (Morning Star) — bullish reversal at a low level
First candlestick: long bearish candlestick (red), in a downtrend
Second candlestick: small-bodied candlestick (doji / small bearish / small bullish), body gaps downward, like a star
Third candlestick: long bullish candlestick (green), with the body penetrating into the body of the first bearish candlestick
Meaning: downward momentum exhausts → bulls and bears reach balance → bulls counterattack strongly → stop falling and rebound
🌆 Evening Star — bearish reversal at a high level
First candlestick: long bullish candlestick (green), in an uptrend
Second candlestick: small-bodied candlestick (doji / small bearish / small bullish), body gaps upward, like a star
Third candlestick: long bearish candlestick (red), with the body penetrating into the body of the first bullish candlestick
Meaning: upward momentum exhausts → bulls and bears reach balance → bears counterattack strongly → top out and pull back#BTC触及80000美元 $H
Morning Star → Morning Star / Morning Star
✅ Structural pattern (all consist of 3 candlesticks)
🌅 Morning Star (Morning Star) — bullish reversal at a low level
First candlestick: long bearish candlestick (red), in a downtrend
Second candlestick: small-bodied candlestick (doji / small bearish / small bullish), body gaps downward, like a star
Third candlestick: long bullish candlestick (green), with the body penetrating into the body of the first bearish candlestick
Meaning: downward momentum exhausts → bulls and bears reach balance → bulls counterattack strongly → stop falling and rebound
🌆 Evening Star — bearish reversal at a high level
First candlestick: long bullish candlestick (green), in an uptrend
Second candlestick: small-bodied candlestick (doji / small bearish / small bullish), body gaps upward, like a star
Third candlestick: long bearish candlestick (red), with the body penetrating into the body of the first bullish candlestick
Meaning: upward momentum exhausts → bulls and bears reach balance → bears counterattack strongly → top out and pull back#BTC触及80000美元 $H
322
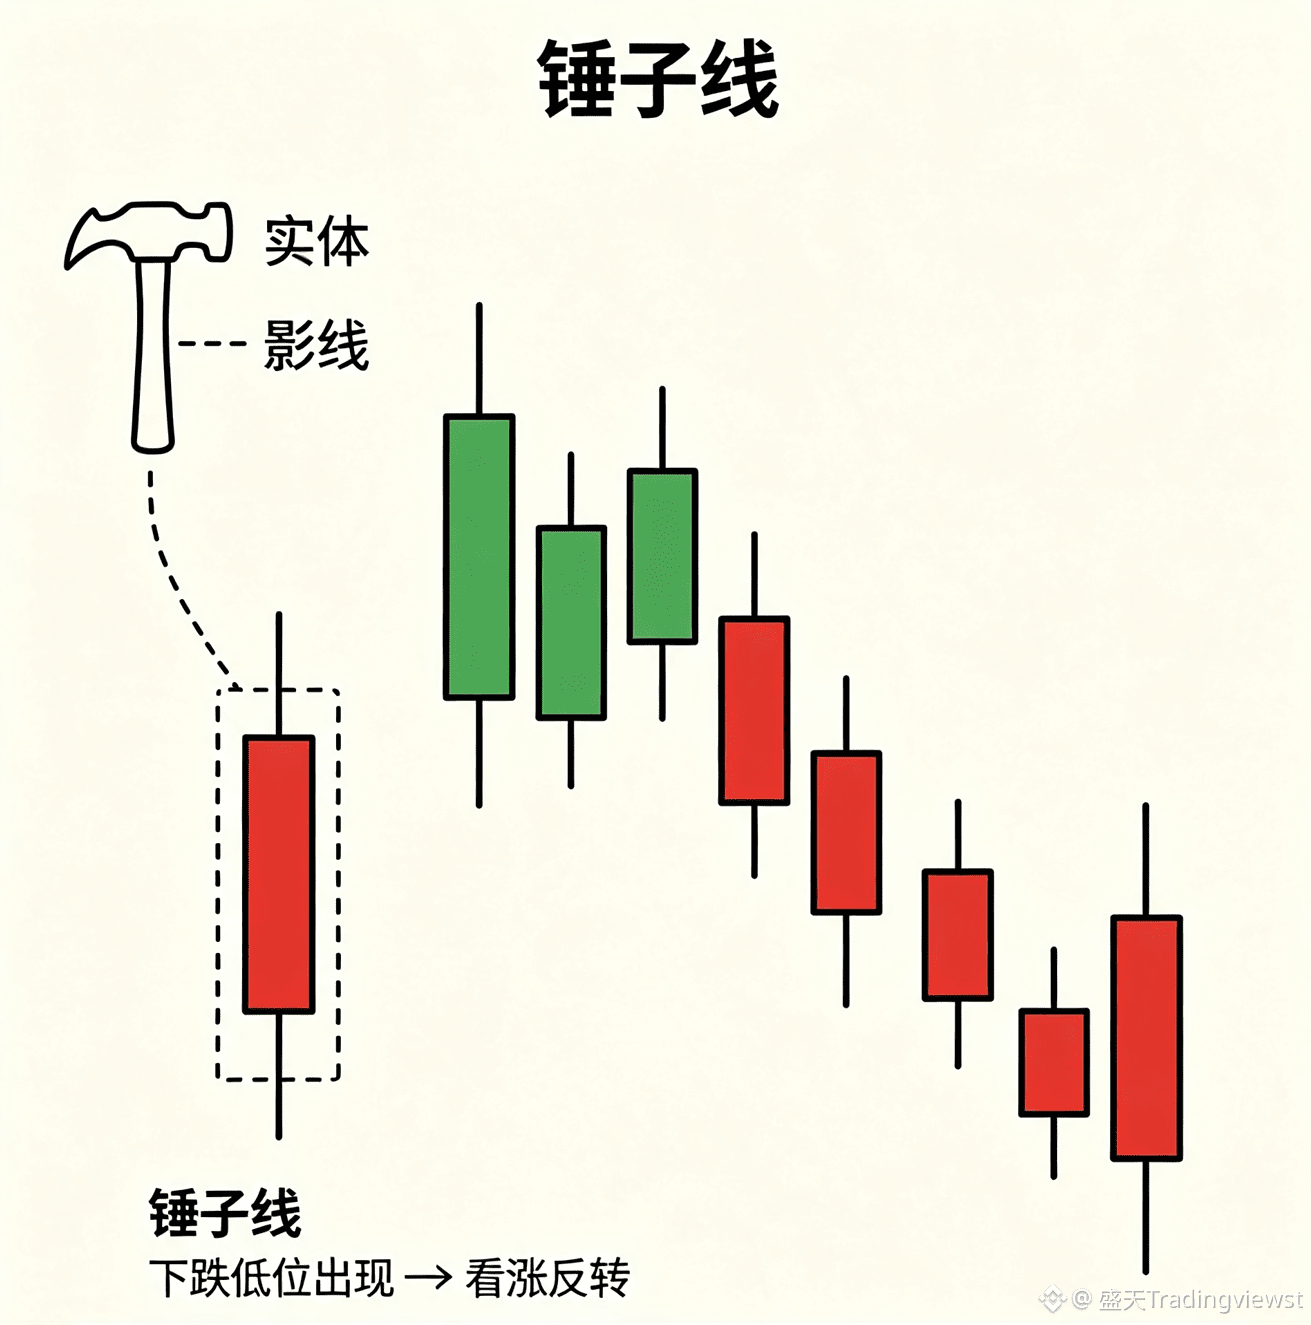
🔨 Hammer line(#HammerCandle )
Shape structure:
The body is very small (the rectangular part above the K line)
The lower shadow is very long (the vertical line below the body, about 2–3 times the length of the body)
There is almost no upper shadow (almost no vertical line above the body)
Overall it looks like a “hammer,” hence the name
Market meaning:
Appears at a low level in a downtrend and is a #看涨 reversal signal
The long lower shadow means: the price first fell sharply, then was pulled back by strong buying pressure → strong support below and weakening downward momentum
A bullish hammer (green) is more bullish than a bearish hammer (red) $ETH
{future}(ETHUSDT)
🔨 Hammer line(#HammerCandle )
Shape structure:
The body is very small (the rectangular part above the K line)
The lower shadow is very long (the vertical line below the body, about 2–3 times the length of the body)
There is almost no upper shadow (almost no vertical line above the body)
Overall it looks like a “hammer,” hence the name
Market meaning:
Appears at a low level in a downtrend and is a #看涨 reversal signal
The long lower shadow means: the price first fell sharply, then was pulled back by strong buying pressure → strong support below and weakening downward momentum
A bullish hammer (green) is more bullish than a bearish hammer (red) $ETH
Shape structure:
The body is very small (the rectangular part above the K line)
The lower shadow is very long (the vertical line below the body, about 2–3 times the length of the body)
There is almost no upper shadow (almost no vertical line above the body)
Overall it looks like a “hammer,” hence the name
Market meaning:
Appears at a low level in a downtrend and is a #看涨 reversal signal
The long lower shadow means: the price first fell sharply, then was pulled back by strong buying pressure → strong support below and weakening downward momentum
A bullish hammer (green) is more bullish than a bearish hammer (red) $ETH
1
345
Verified
🔥Breaking news: #华尔街 institutions have quietly accumulated nearly $75 million in Hyperliquid ETF investments.
#Bloomberg analyst James Seyffart found that as of June 30, 30 institutional investors held shares equivalent to about 1.158 million $HYPE
{future}(HYPEUSDT)
.
Top 5 institutions holding the most HYPE ETF shares:
Wealth High Governance: $23,948,236
OLP Capital: $10,495,651
UBS: $7,525,757
#Bank of Montreal: $6,693,261
Jane Street: $4,381,110
🔥Breaking news: #华尔街 institutions have quietly accumulated nearly $75 million in Hyperliquid ETF investments.
#Bloomberg analyst James Seyffart found that as of June 30, 30 institutional investors held shares equivalent to about 1.158 million $HYPE
.
Top 5 institutions holding the most HYPE ETF shares:
Wealth High Governance: $23,948,236
OLP Capital: $10,495,651
UBS: $7,525,757
#Bank of Montreal: $6,693,261
Jane Street: $4,381,110
#Bloomberg analyst James Seyffart found that as of June 30, 30 institutional investors held shares equivalent to about 1.158 million $HYPE
.
Top 5 institutions holding the most HYPE ETF shares:
Wealth High Governance: $23,948,236
OLP Capital: $10,495,651
UBS: $7,525,757
#Bank of Montreal: $6,693,261
Jane Street: $4,381,110

339
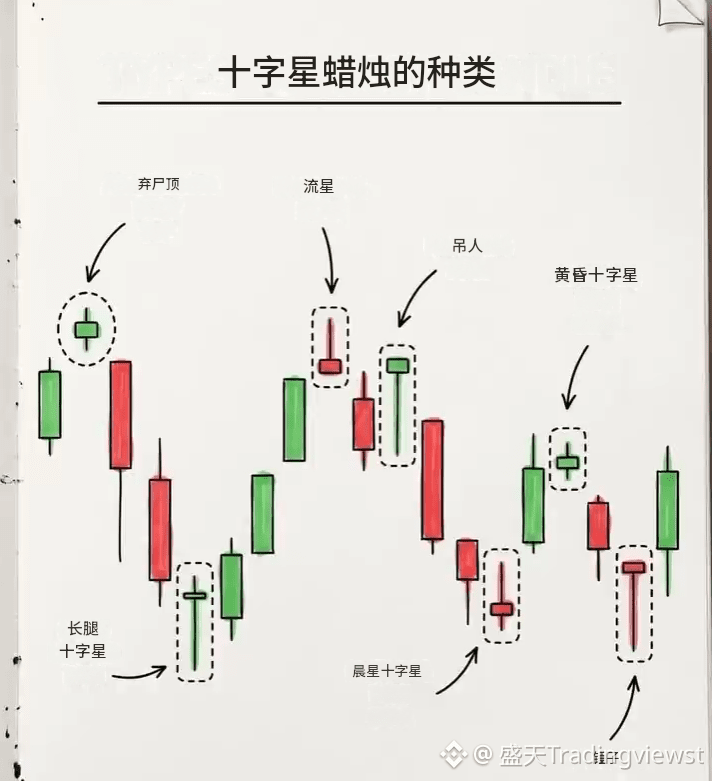
Have you distinguished all the types of doji stars? #交易员观察 $HYPE
{future}(HYPEUSDT)
Have you distinguished all the types of doji stars? #交易员观察 $HYPE
403
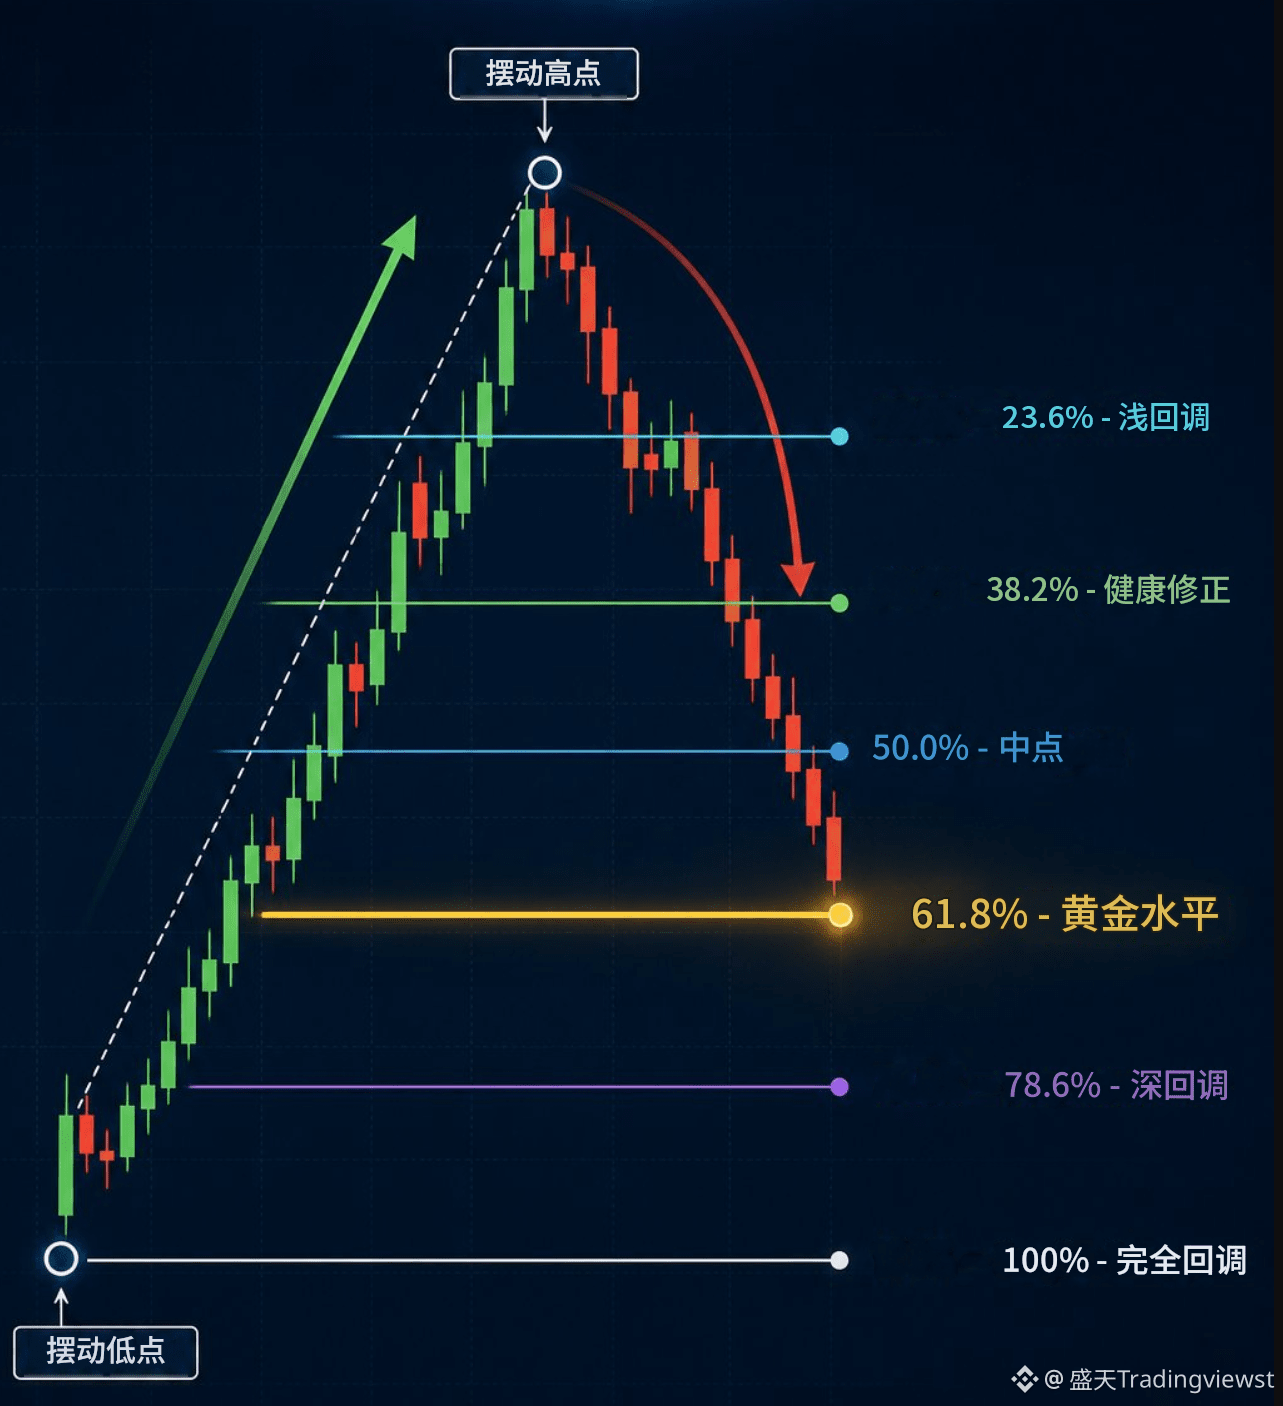
#斐波那契
In an uptrend, draw the Fibonacci lines from the swing low to the swing high.
In a downtrend, draw the Fibonacci lines from the swing high to the swing low.
Use #成交量 , #k线形态 , #趋势线 or support and resistance levels to confirm these levels.
Fibonacci retracement levels can help traders identify potential support, resistance, and reversal zones during a pullback.
23.6%: Shallow retracement; indicates strong trend momentum.
38.2%: Healthy retracement; the trend may continue quickly.
50%: Psychological midpoint and a common reaction area.
61.8%: Golden level; an important reversal zone.
78.6%: Deep retracement; the original trend is weakening.
100%: Price returns to the starting swing point, indicating a complete retracement.$SUI
{future}(SUIUSDT)
#斐波那契
In an uptrend, draw the Fibonacci lines from the swing low to the swing high.
In a downtrend, draw the Fibonacci lines from the swing high to the swing low.
Use #成交量 , #k线形态 , #趋势线 or support and resistance levels to confirm these levels.
Fibonacci retracement levels can help traders identify potential support, resistance, and reversal zones during a pullback.
23.6%: Shallow retracement; indicates strong trend momentum.
38.2%: Healthy retracement; the trend may continue quickly.
50%: Psychological midpoint and a common reaction area.
61.8%: Golden level; an important reversal zone.
78.6%: Deep retracement; the original trend is weakening.
100%: Price returns to the starting swing point, indicating a complete retracement.$SUI
In an uptrend, draw the Fibonacci lines from the swing low to the swing high.
In a downtrend, draw the Fibonacci lines from the swing high to the swing low.
Use #成交量 , #k线形态 , #趋势线 or support and resistance levels to confirm these levels.
Fibonacci retracement levels can help traders identify potential support, resistance, and reversal zones during a pullback.
23.6%: Shallow retracement; indicates strong trend momentum.
38.2%: Healthy retracement; the trend may continue quickly.
50%: Psychological midpoint and a common reaction area.
61.8%: Golden level; an important reversal zone.
78.6%: Deep retracement; the original trend is weakening.
100%: Price returns to the starting swing point, indicating a complete retracement.$SUI


477
3
38
902
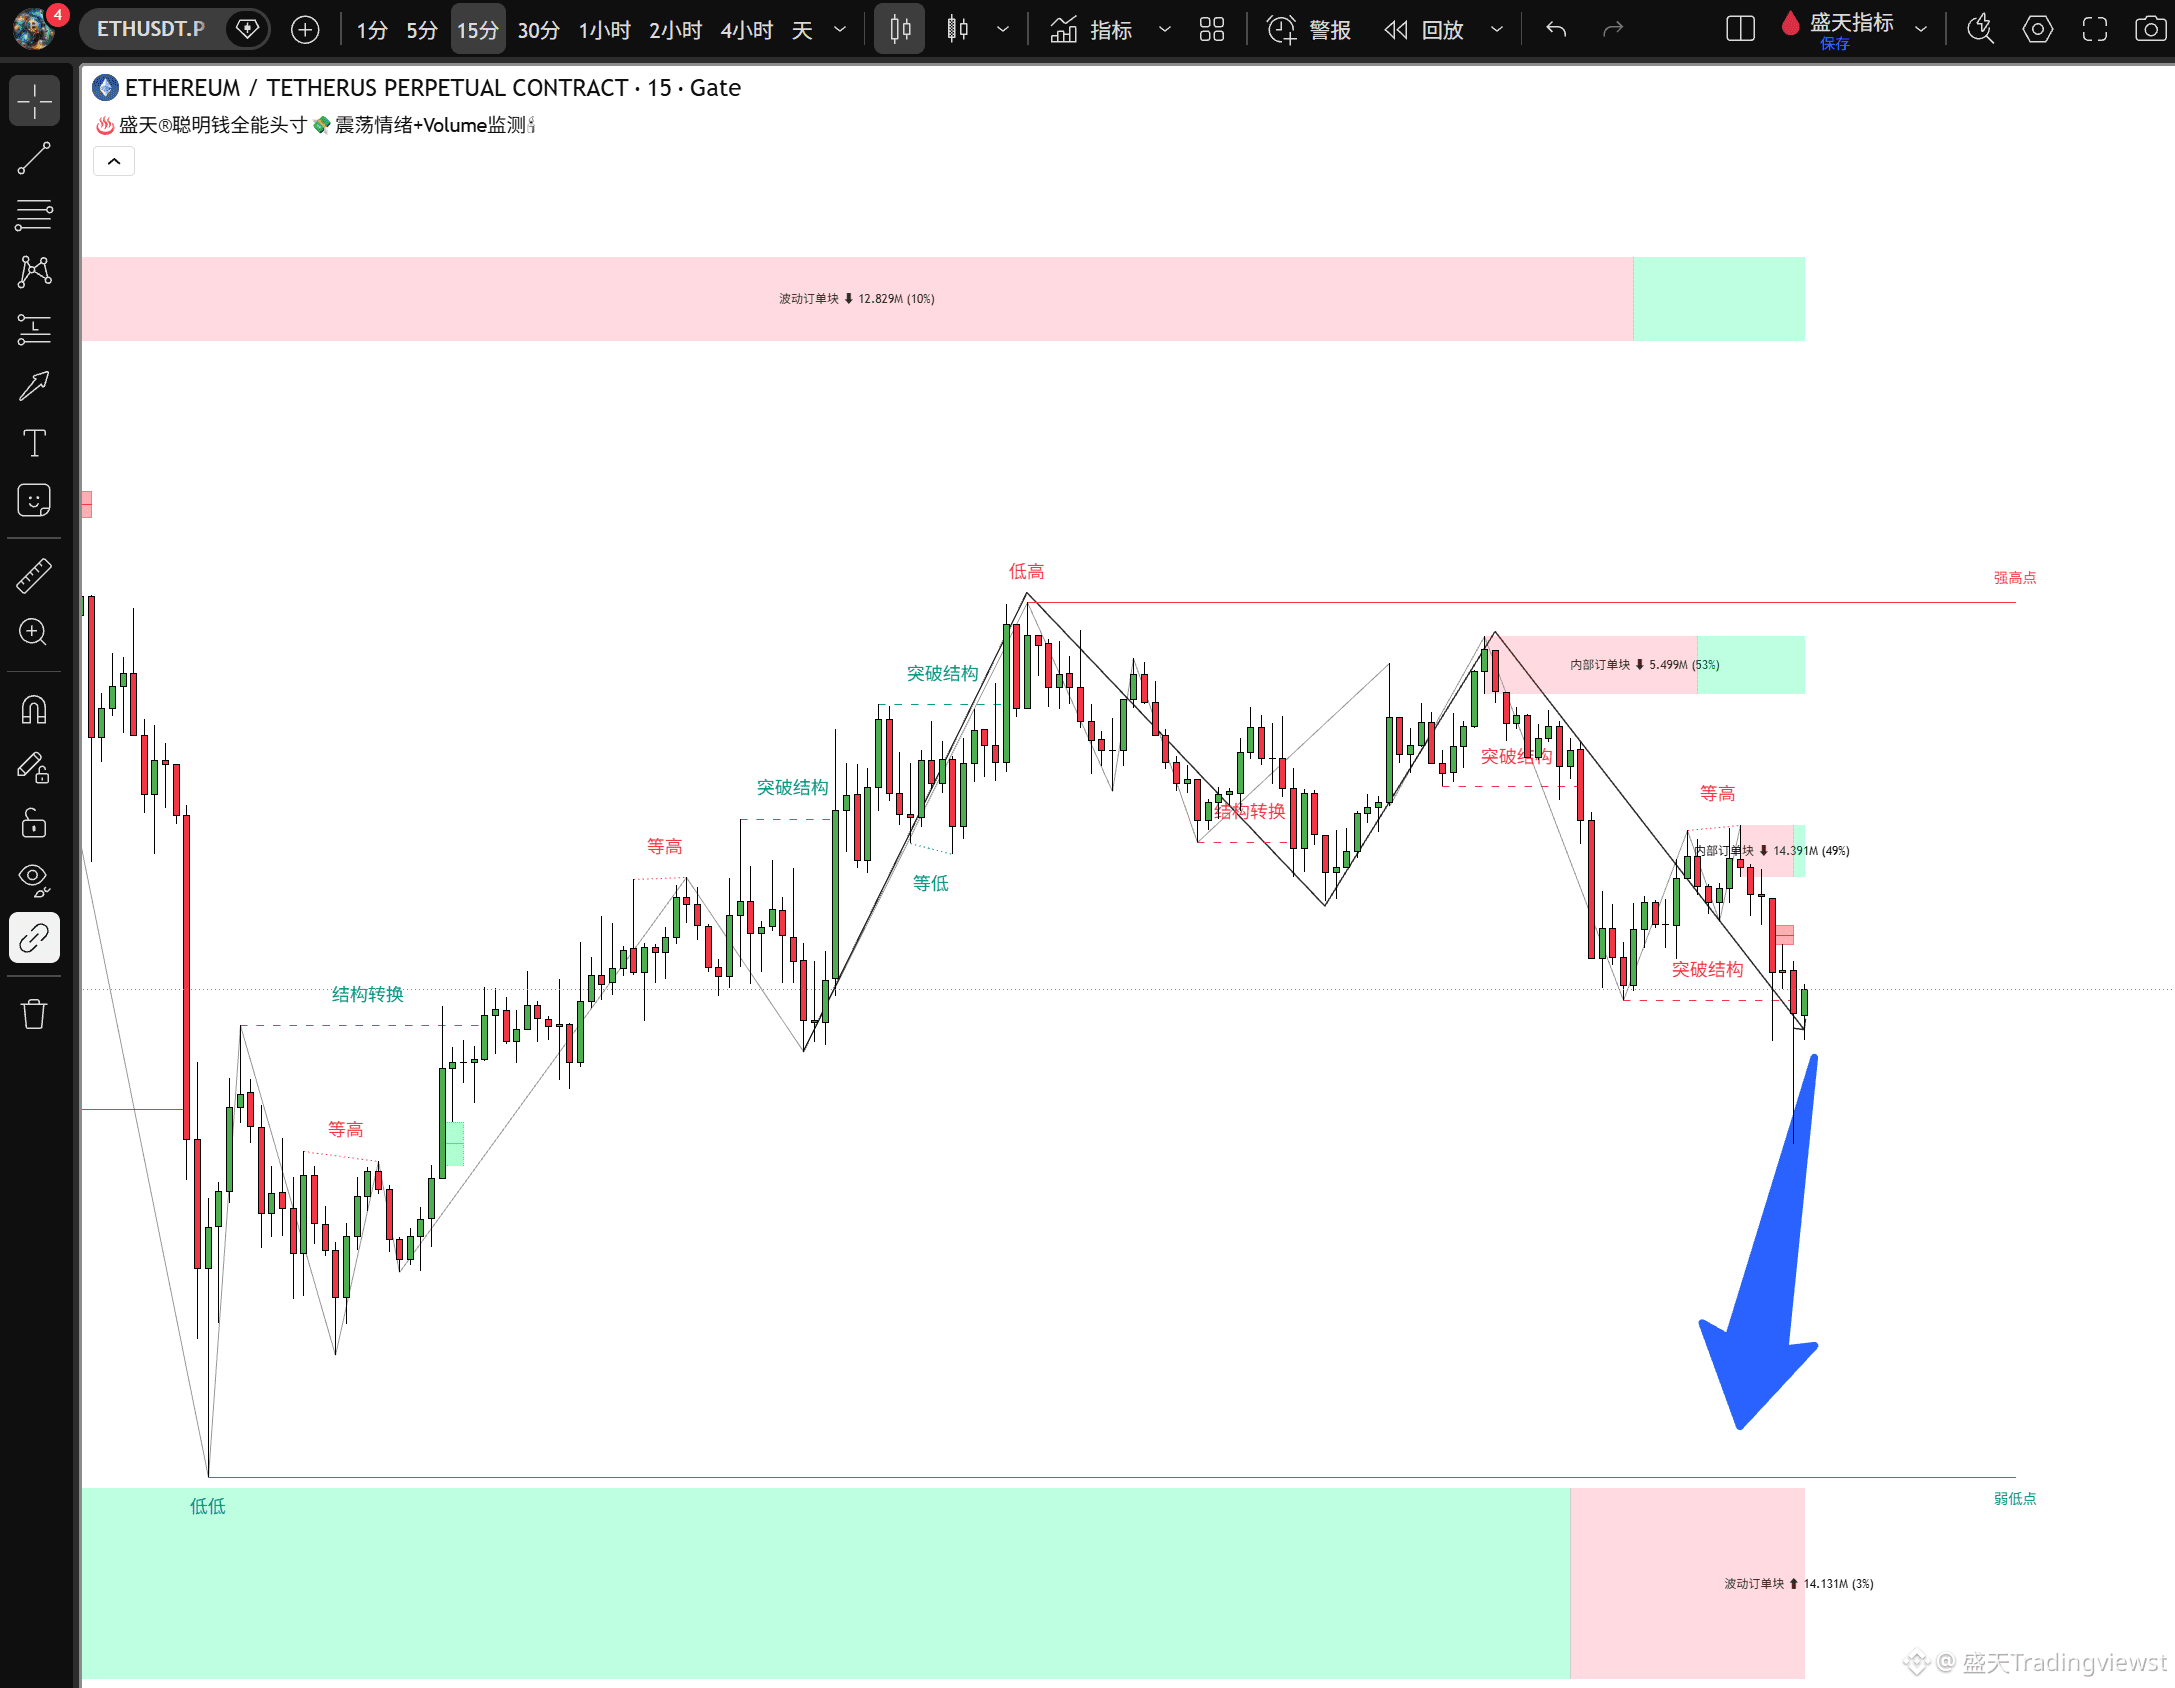
‼️ According to data from #arkham , wallets associated with the “Lazarus” organization related to North Korea transferred $30 million worth of cryptocurrency via the Hyperliquid platform.
These funds were converted from Bitcoin to Ether ($ETH
{future}(ETHUSDT)
) or to Ethereum ($SOL
{future}(SOLUSDT)
), then moved through multiple networks using cross-chain transfers, and ultimately deposited into KuCoin, Kraken, LBank, and some unknown platforms based on Tron.
The “Lazarus” organization is suspected of carrying out a record-breaking $1.4 billion exchange-hacking incident in 2025.
‼️ According to data from #arkham , wallets associated with the “Lazarus” organization related to North Korea transferred $30 million worth of cryptocurrency via the Hyperliquid platform.
These funds were converted from Bitcoin to Ether ($ETH
) or to Ethereum ($SOL
), then moved through multiple networks using cross-chain transfers, and ultimately deposited into KuCoin, Kraken, LBank, and some unknown platforms based on Tron.
The “Lazarus” organization is suspected of carrying out a record-breaking $1.4 billion exchange-hacking incident in 2025.
These funds were converted from Bitcoin to Ether ($ETH
) or to Ethereum ($SOL
), then moved through multiple networks using cross-chain transfers, and ultimately deposited into KuCoin, Kraken, LBank, and some unknown platforms based on Tron.
The “Lazarus” organization is suspected of carrying out a record-breaking $1.4 billion exchange-hacking incident in 2025.

560
·
--
Bullish
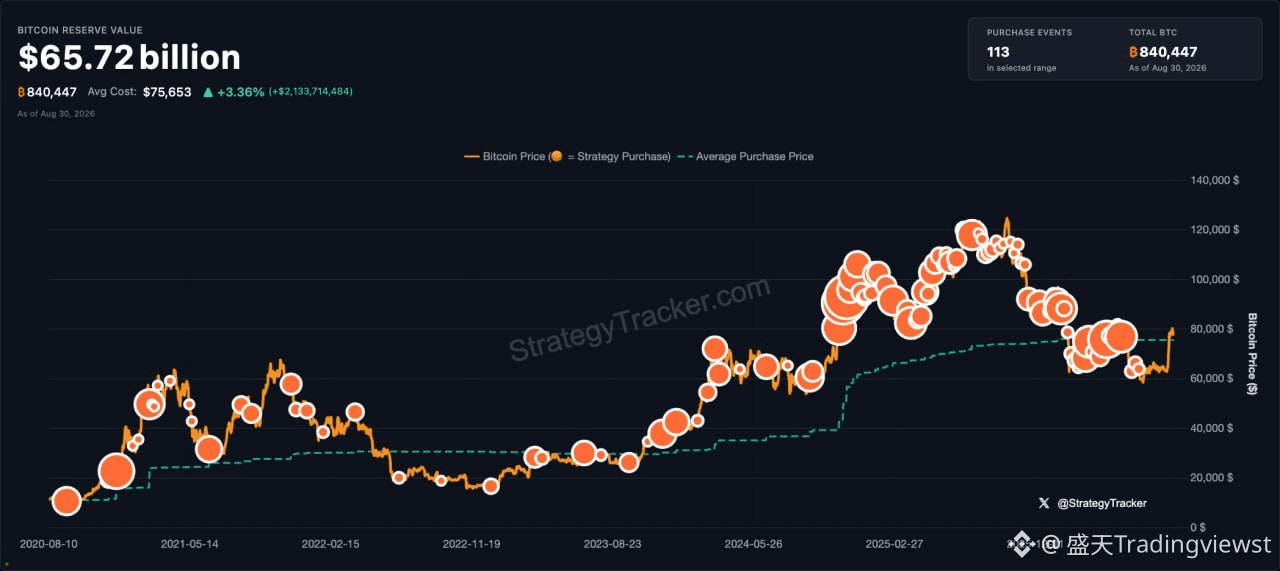
Michael Saylor hints that the #strategy company may buy Bitcoin again. “We’re back.”$BTC
{future}(BTCUSDT)
Michael Saylor hints that the #strategy company may buy Bitcoin again. “We’re back.”$BTC
1
2
482
What Is Survivor Bias?
There’s a miracle doctor in the neighboring village with a family-secret recipe that can guarantee the birth of a baby boy—his treatment works every time, and he charges 3000.
If the baby is a boy, then you pay him again; if it’s a girl, you don’t have to pay.
So people give birth to girls—since no one collects money or comes looking for him,
those who have baby boys are all happy and happily send him the money,
and they even end up earning a whole room full of banners and awards.
Now he even has a Lamborghini..#黄金本周下跌3.24% $XAU
{future}(XAUUSDT)
What Is Survivor Bias?
There’s a miracle doctor in the neighboring village with a family-secret recipe that can guarantee the birth of a baby boy—his treatment works every time, and he charges 3000.
If the baby is a boy, then you pay him again; if it’s a girl, you don’t have to pay.
So people give birth to girls—since no one collects money or comes looking for him,
those who have baby boys are all happy and happily send him the money,
and they even end up earning a whole room full of banners and awards.
Now he even has a Lamborghini..#黄金本周下跌3.24% $XAU
There’s a miracle doctor in the neighboring village with a family-secret recipe that can guarantee the birth of a baby boy—his treatment works every time, and he charges 3000.
If the baby is a boy, then you pay him again; if it’s a girl, you don’t have to pay.
So people give birth to girls—since no one collects money or comes looking for him,
those who have baby boys are all happy and happily send him the money,
and they even end up earning a whole room full of banners and awards.
Now he even has a Lamborghini..#黄金本周下跌3.24% $XAU

282
Verified
🚨#重大事件 message: Russia’s largest bank will officially accept Bitcoin, Ethereum, and USDT as loan collateral.
Russia’s new digital asset regulations will take effect on September 1, and #SberbankBTC will begin accepting Bitcoin as loan collateral, providing opportunities for the bank’s more than 100 million customers.
Once approved by the central bank, Ethereum and USDT will also be added to the accepted range.$BTC
{future}(BTCUSDT)
🚨#重大事件 message: Russia’s largest bank will officially accept Bitcoin, Ethereum, and USDT as loan collateral.
Russia’s new digital asset regulations will take effect on September 1, and #SberbankBTC will begin accepting Bitcoin as loan collateral, providing opportunities for the bank’s more than 100 million customers.
Once approved by the central bank, Ethereum and USDT will also be added to the accepted range.$BTC
Russia’s new digital asset regulations will take effect on September 1, and #SberbankBTC will begin accepting Bitcoin as loan collateral, providing opportunities for the bank’s more than 100 million customers.
Once approved by the central bank, Ethereum and USDT will also be added to the accepted range.$BTC


221
The United States is using emergency financial tools, large-scale bond purchases, nearly $1 trillion in cash reserves, and rare currency intervention measures to keep the economy running. But according to official data, there is no crisis—so why are there so many panic-driven actions? We explain the problems the Treasury is trying to address, why global buyers are walking away from purchasing U.S. Treasury bonds, and what this means for everyone’s savings and investment risk.
Artificial intelligence has found a loophole, and four years of cryptographic audits have not detected it. The market panicked as a result, but ZEC still hit new all-time highs. DC’s perspective upends the common narrative: if all payment rails are being used for machine-speed surveillance, then cryptographic privacy is the only privacy that truly exists.
The United States is using emergency financial tools, large-scale bond purchases, nearly $1 trillion in cash reserves, and rare currency intervention measures to keep the economy running. But according to official data, there is no crisis—so why are there so many panic-driven actions? We explain the problems the Treasury is trying to address, why global buyers are walking away from purchasing U.S. Treasury bonds, and what this means for everyone’s savings and investment risk.
Artificial intelligence has found a loophole, and four years of cryptographic audits have not detected it. The market panicked as a result, but ZEC still hit new all-time highs. DC’s perspective upends the common narrative: if all payment rails are being used for machine-speed surveillance, then cryptographic privacy is the only privacy that truly exists.
Artificial intelligence has found a loophole, and four years of cryptographic audits have not detected it. The market panicked as a result, but ZEC still hit new all-time highs. DC’s perspective upends the common narrative: if all payment rails are being used for machine-speed surveillance, then cryptographic privacy is the only privacy that truly exists.
340
Log in to explore more content
Join global crypto users on Binance Square
⚡️ Get latest and useful information about crypto.
💬 Trusted by the world’s largest crypto exchange.
👍 Discover real insights from verified creators.
Email / Phone number