

刘小伍
130 Posts

刘小伍
Report
Block User
十块钱就想开一万倍把地球翘碎 交易所/钱包邀请码:LIUXIAOWU
Open Trade
Frequent Trader
3.8 Years
15 Following
94 Followers
38 Liked
Posts
Portfolio
All
Quotes
·
--
Bullish
Partly True
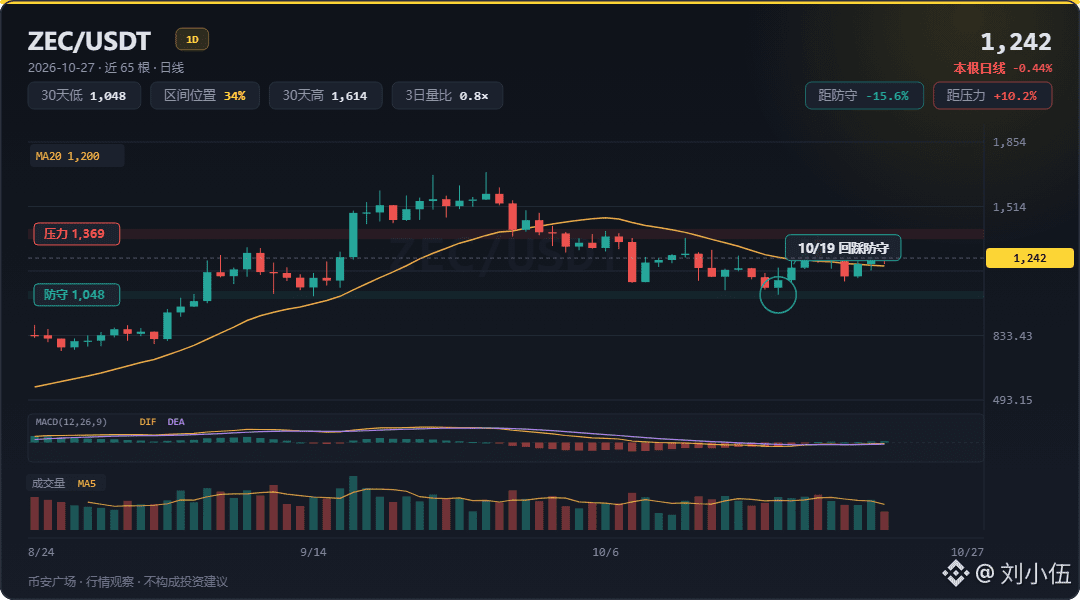
$ZEC Grayscale ZEC ETF drew $41.1 million last week; things pick up speed in ten days
Price at $1,242 (24h +1.94%)
Today, ZEC is hugging the 60-day moving average at 1,240, with the current price just above it.
I’m inclined to see this as a recovery, not the start of a new rally.
It began on October 22, when the price surged to 1,369 on 1.4 times the usual volume, then closed at 1,234.
A high-volume surge that then fell back to the day’s low made that peak a ceiling the price has repeatedly had to test since.
After climbing back from last Friday’s bearish candle, the daily RSI has only returned to the midpoint, and buyers chasing the price haven’t followed through.
The MACD histogram has stayed above the zero line for three straight days, but DIF and DEA are still below zero. The rebound hasn’t yet turned into a trend.
Grayscale’s ZEC ETF saw net inflows of $41.1 million last week.
That’s not much relative to a $210.7 billion market cap. It can provide some support, but it won’t drive a major rally.
In ten days, the block time is also set to shrink to 25 seconds.
The funding rate is 0.0010%, a very low level. Open interest is $145 million, which is not particularly large.
If the price does fall, 1,048—the low tested on October 19—is the only bottom tested so far in this cycle. The price dipped there that day, then buyers stepped in.
I think it will first try to test 1,369, provided the daily close holds above 1,240.
#zec
{future}(ZECUSDT)
$ZEC Grayscale ZEC ETF drew $41.1 million last week; things pick up speed in ten days
Price at $1,242 (24h +1.94%)
Today, ZEC is hugging the 60-day moving average at 1,240, with the current price just above it.
I’m inclined to see this as a recovery, not the start of a new rally.
It began on October 22, when the price surged to 1,369 on 1.4 times the usual volume, then closed at 1,234.
A high-volume surge that then fell back to the day’s low made that peak a ceiling the price has repeatedly had to test since.
After climbing back from last Friday’s bearish candle, the daily RSI has only returned to the midpoint, and buyers chasing the price haven’t followed through.
The MACD histogram has stayed above the zero line for three straight days, but DIF and DEA are still below zero. The rebound hasn’t yet turned into a trend.
Grayscale’s ZEC ETF saw net inflows of $41.1 million last week.
That’s not much relative to a $210.7 billion market cap. It can provide some support, but it won’t drive a major rally.
In ten days, the block time is also set to shrink to 25 seconds.
The funding rate is 0.0010%, a very low level. Open interest is $145 million, which is not particularly large.
If the price does fall, 1,048—the low tested on October 19—is the only bottom tested so far in this cycle. The price dipped there that day, then buyers stepped in.
I think it will first try to test 1,369, provided the daily close holds above 1,240.
#zec
160
·
--
Bearish
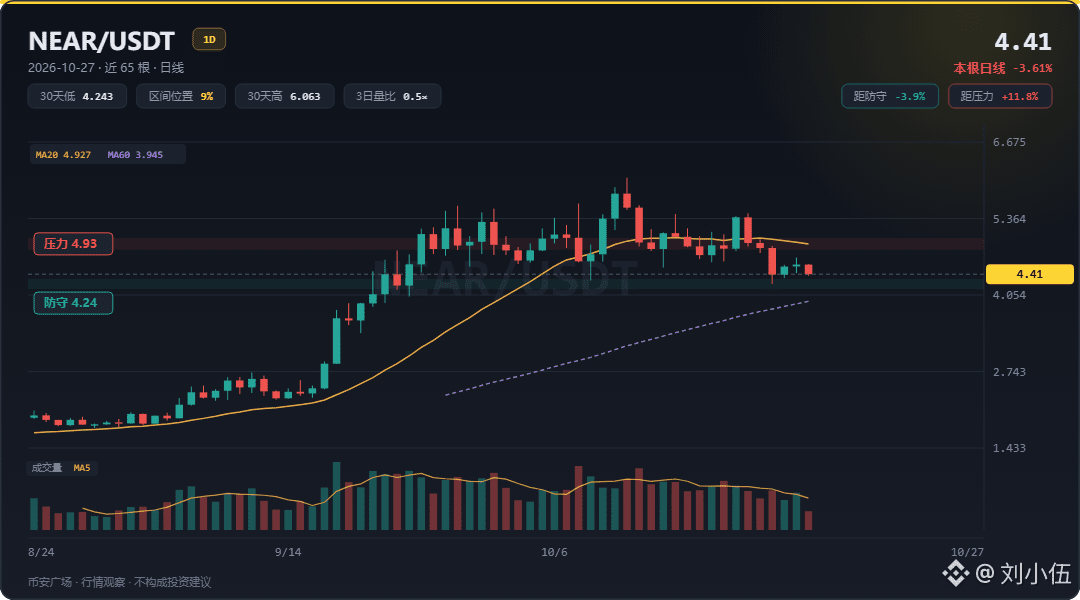
$NEAR Down 8.95% in seven days, with trading volume falling to 0.7x its usual level
Currently $4.41, 24h: -2.41%
The funding rate is now at -0.004%. I’m inclined to read this as spot buyers pulling back.
Funding rates only show which side is more eager; they don’t determine the direction.
This slide began on October 25. The price fell nearly 8% that day, while open interest dropped 9.5%.
The perpetuals pool now has just $54 million left. With the pool this small, a skewed funding rate doesn’t mean much.
The low was $4.24 on October 24, but the price recovered that day. The next day, trading volume was only 0.5x its usual level.
The negative funding rate hasn’t propped up the price. The problem is a lack of buying support.
Buyers stepped in when the price tested its one-month low, but volume didn’t follow over the next two days. The price slid back and is now hovering around that level.
The decline isn’t fast, but every rally is met with low volume.
The 20-day moving average is still overhead on the daily chart. The trend is down, and it won’t turn around in a day or two.
The most likely path is continued consolidation above $4.24.
If volume doesn’t pick up, any bounce will quickly run out of steam.
A decisive break below that level would negate the short-term buying support. We’ll need to wait for fresh volume before discussing direction.
#Near
{future}(NEARUSDT)
$NEAR Down 8.95% in seven days, with trading volume falling to 0.7x its usual level
Currently $4.41, 24h: -2.41%
The funding rate is now at -0.004%. I’m inclined to read this as spot buyers pulling back.
Funding rates only show which side is more eager; they don’t determine the direction.
This slide began on October 25. The price fell nearly 8% that day, while open interest dropped 9.5%.
The perpetuals pool now has just $54 million left. With the pool this small, a skewed funding rate doesn’t mean much.
The low was $4.24 on October 24, but the price recovered that day. The next day, trading volume was only 0.5x its usual level.
The negative funding rate hasn’t propped up the price. The problem is a lack of buying support.
Buyers stepped in when the price tested its one-month low, but volume didn’t follow over the next two days. The price slid back and is now hovering around that level.
The decline isn’t fast, but every rally is met with low volume.
The 20-day moving average is still overhead on the daily chart. The trend is down, and it won’t turn around in a day or two.
The most likely path is continued consolidation above $4.24.
If volume doesn’t pick up, any bounce will quickly run out of steam.
A decisive break below that level would negate the short-term buying support. We’ll need to wait for fresh volume before discussing direction.
#Near
592
·
--
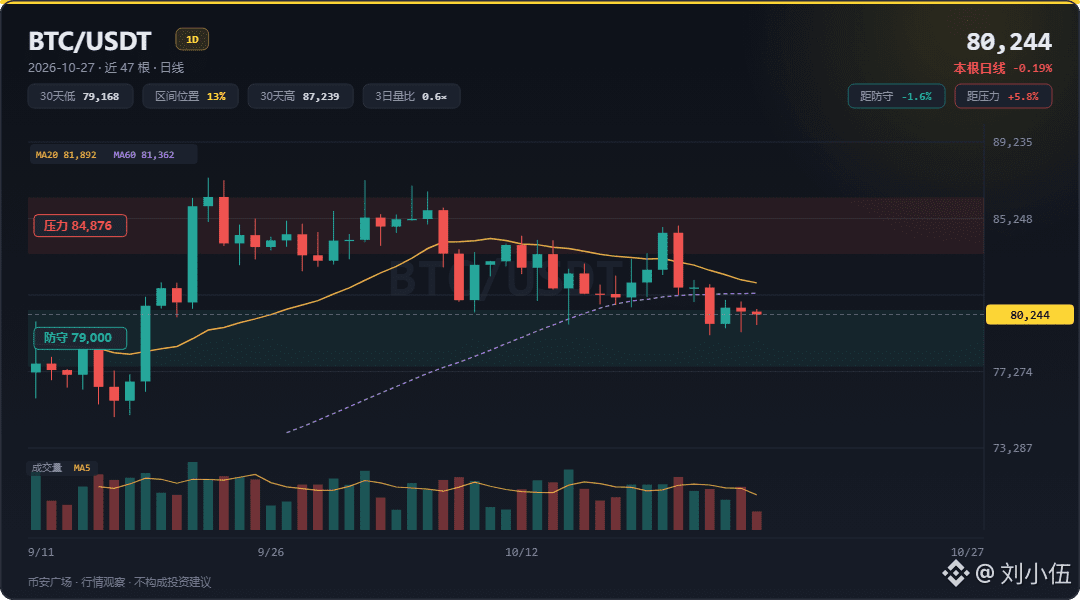
$BTC is holding above 79,000, but volume is only 0.6x
Trading at $80,244, up 0.45% in 24 hours
I still think the trend is down this week. Today’s small gain has only slowed the decline.
Bitcoin is down 2.83% over seven days and has recovered just 0.45% in the past 24 hours. It’s still 18% below its high for the year.
It’s still down year to date; the only thing up is today’s brief bounce.
More importantly, look at volume. The average volume over the past three days is only 0.6 times that of the previous 20 days. Today’s gain came because selling pressure eased, not because buyers stepped in. In a down week, a low-volume rebound usually just means the bears have paused for a breather.
There’s nearly 6% upside to 84,876, but no sign of buyers rushing in. That takes aggressive bidding, and with volume at just 60% of normal, those bidders aren’t showing up.
The funding rate is still positive at 0.01%, and open interest is $2.554 billion. The side paying funding hasn’t backed off. When the price approaches 81,892, sellers step in, and the moving averages are overhead too.
A move down to 79,000 looks more likely than a break back above the moving averages. A rally built on thin volume can fall back just by failing to attract buyers.
Price is already near the lower end of this month’s range, so there isn’t much room below.
#BTC
{future}(BTCUSDT)
$BTC is holding above 79,000, but volume is only 0.6x
Trading at $80,244, up 0.45% in 24 hours
I still think the trend is down this week. Today’s small gain has only slowed the decline.
Bitcoin is down 2.83% over seven days and has recovered just 0.45% in the past 24 hours. It’s still 18% below its high for the year.
It’s still down year to date; the only thing up is today’s brief bounce.
More importantly, look at volume. The average volume over the past three days is only 0.6 times that of the previous 20 days. Today’s gain came because selling pressure eased, not because buyers stepped in. In a down week, a low-volume rebound usually just means the bears have paused for a breather.
There’s nearly 6% upside to 84,876, but no sign of buyers rushing in. That takes aggressive bidding, and with volume at just 60% of normal, those bidders aren’t showing up.
The funding rate is still positive at 0.01%, and open interest is $2.554 billion. The side paying funding hasn’t backed off. When the price approaches 81,892, sellers step in, and the moving averages are overhead too.
A move down to 79,000 looks more likely than a break back above the moving averages. A rally built on thin volume can fall back just by failing to attract buyers.
Price is already near the lower end of this month’s range, so there isn’t much room below.
#BTC
316
·
--
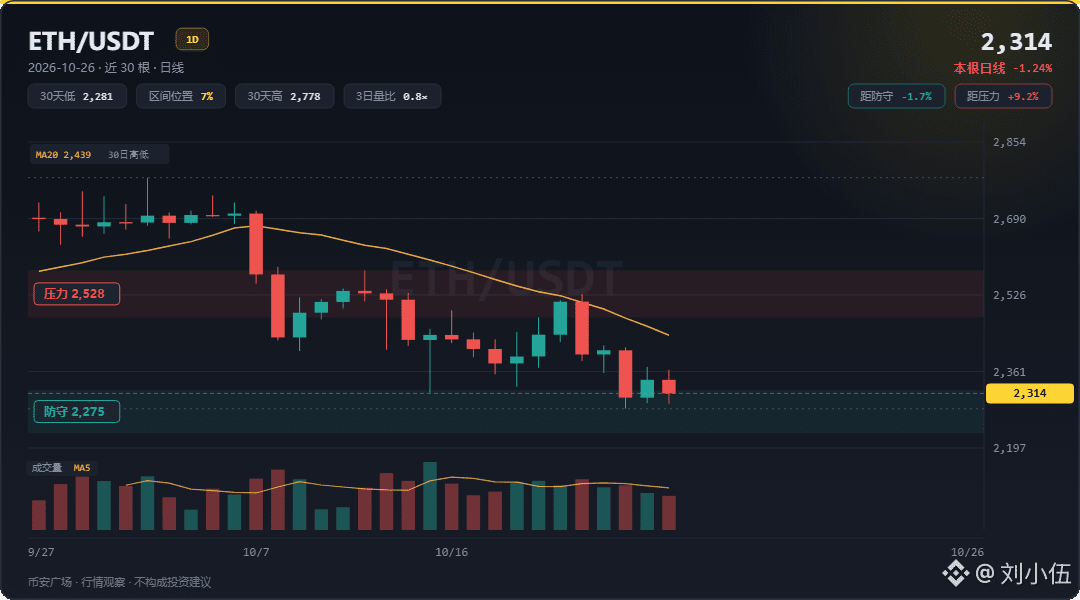
Down 13% in $ETH 30 days; ETF outflows hit $110 million in a single day
Current price: $2,314 (24h: -1.14%)
The price is hovering just 1.4% above the 30-day low of 2,281, and it’s been grinding around there for the past two days. The funding rate is positive at 0.0021%: the price is falling, but it’s the longs who are paying.
A positive funding rate means longs are still willing to pay to hold on to their positions.
The longer they hold out, the more costs pile up as they’re charged every eight hours. Time is on the shorts’ side.
Spot markets are a different story. On October 22, U.S. spot ETH ETFs saw $110 million in outflows. They bought actual ETH, and when they leave, they’re selling actual ETH too.
The people holding on in ETFs and futures aren’t the same crowd.
ETH is down 13% over 30 days, while BTC is down less than 5% over the same period. The difference is ETH’s own leverage getting unwound.
The current price is still about 8% below the 30-day average trading price, so people who entered over the past month haven’t broken even yet.
I think there’s still more downside ahead. First, let’s see if 2,275 holds.
#ETH
{future}(ETHUSDT)
Down 13% in $ETH 30 days; ETF outflows hit $110 million in a single day
Current price: $2,314 (24h: -1.14%)
The price is hovering just 1.4% above the 30-day low of 2,281, and it’s been grinding around there for the past two days. The funding rate is positive at 0.0021%: the price is falling, but it’s the longs who are paying.
A positive funding rate means longs are still willing to pay to hold on to their positions.
The longer they hold out, the more costs pile up as they’re charged every eight hours. Time is on the shorts’ side.
Spot markets are a different story. On October 22, U.S. spot ETH ETFs saw $110 million in outflows. They bought actual ETH, and when they leave, they’re selling actual ETH too.
The people holding on in ETFs and futures aren’t the same crowd.
ETH is down 13% over 30 days, while BTC is down less than 5% over the same period. The difference is ETH’s own leverage getting unwound.
The current price is still about 8% below the 30-day average trading price, so people who entered over the past month haven’t broken even yet.
I think there’s still more downside ahead. First, let’s see if 2,275 holds.
#ETH
35
·
--
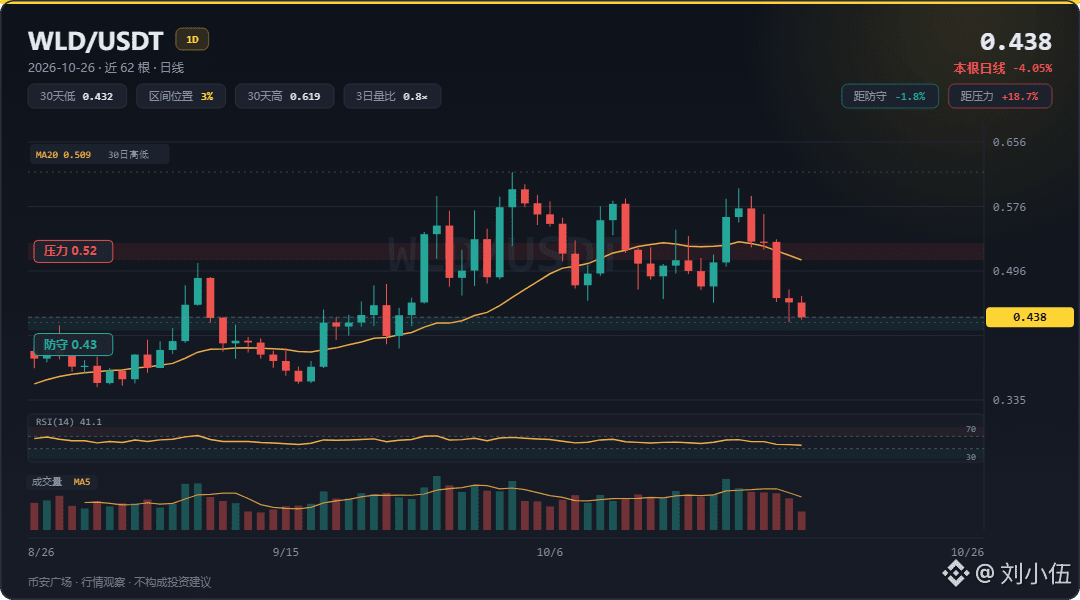
$45.38 million moved into exchanges in two days; $WLD volume at 0.8x
Current price: $0.438 (24h: -5.52%)
The price fell to $0.4381 today, just 1.5% above the 30-day low of $0.432. I think the $0.43 level will be the first to break.
The bearish case comes down to cost basis.
The current price is 16.6% below the average trading cost over the past 30 days. Nearly everyone who bought in over the past month is underwater, so selling pressure from people looking to break even will emerge whenever the price reaches the cost-basis zone.
The three-day average volume is 0.8x the previous 20-day average, about normal, with no sign of anyone stepping in with higher-volume buying.
An institution that invests in both Aave and WLD transferred about $45.38 million worth of tokens to multiple CEXs over two days, including 35.1 million WLD;
The Worldcoin team wallet also deposited 10 million tokens into OKX.
These tokens have reached exchanges and could turn into sell orders at any time in the short term.
#WLD
{future}(WLDUSDT)
$45.38 million moved into exchanges in two days; $WLD volume at 0.8x
Current price: $0.438 (24h: -5.52%)
The price fell to $0.4381 today, just 1.5% above the 30-day low of $0.432. I think the $0.43 level will be the first to break.
The bearish case comes down to cost basis.
The current price is 16.6% below the average trading cost over the past 30 days. Nearly everyone who bought in over the past month is underwater, so selling pressure from people looking to break even will emerge whenever the price reaches the cost-basis zone.
The three-day average volume is 0.8x the previous 20-day average, about normal, with no sign of anyone stepping in with higher-volume buying.
An institution that invests in both Aave and WLD transferred about $45.38 million worth of tokens to multiple CEXs over two days, including 35.1 million WLD;
The Worldcoin team wallet also deposited 10 million tokens into OKX.
These tokens have reached exchanges and could turn into sell orders at any time in the short term.
#WLD
499
·
--
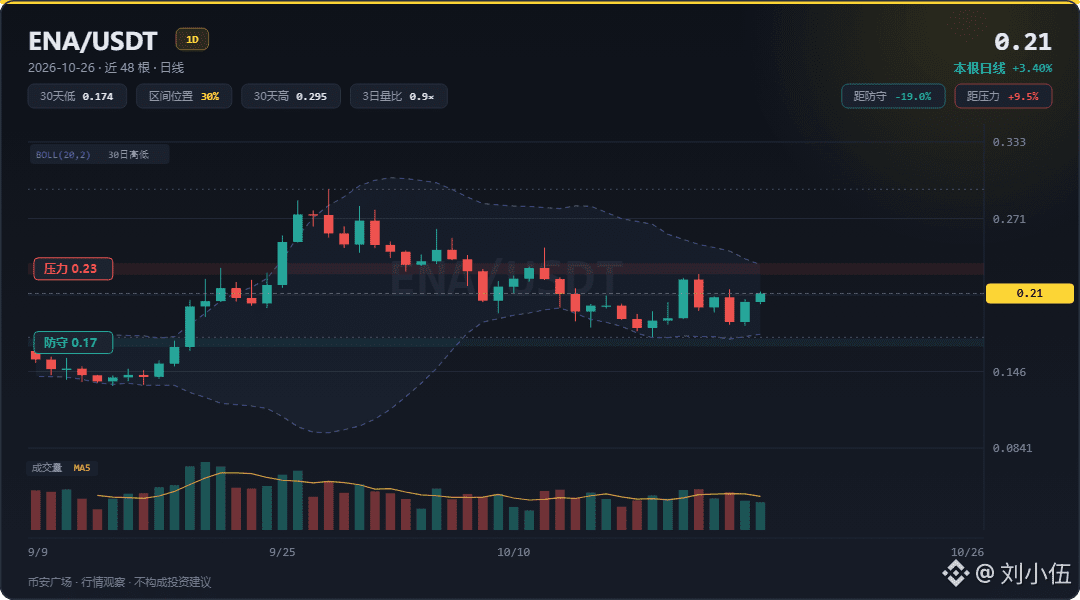
$ENA up 8.97%, with leverage barely moving
Trading at $0.21, up 8.97% in 24 hours
The average volume over the past three days was only 0.9 times the usual level, yet the price held just above $0.21.
With no volume coming in, leverage isn’t what’s driving the price up.
The Bollinger Bands have narrowed to the lower end of their recent range. Volatility is contracting, but direction has yet to emerge.
Liquidations totaled $18 million, against a market cap of $2.8 billion—there’s virtually no leverage.
There’s no sign of leveraged funds in this rally.
It closed at $0.221 on October 21, with volume reaching 1.4 times the usual level—the only genuine volume spike in these eight days.
The next day, it surged to $0.226 before being knocked back down.
A volume-backed rally followed by a pullback the next day: the move hasn’t played out, and the price has now retreated to near its starting point.
$0.23 is the high of this rebound. Within the $0.174–$0.295 range of the past 30 days, it’s roughly in the middle—not near the upper end.
Daily price swings are still close to 10%. With moves of this magnitude, breaking through a level and then falling back is common; confirmation requires looking at the close and volume.
First, watch $0.17 to the downside.
The intraday low of $0.174 on October 19 was the only time this cycle that the price tested that area. In the six days since, it hasn’t fallen below $0.184. On the day Hayes sold off 14 million ENA, buyers absorbed that supply too.
My inclination is that the price will first test $0.21, then fall to $0.17 to find support.
#ENA
{spot}(ENAUSDT)
$ENA up 8.97%, with leverage barely moving
Trading at $0.21, up 8.97% in 24 hours
The average volume over the past three days was only 0.9 times the usual level, yet the price held just above $0.21.
With no volume coming in, leverage isn’t what’s driving the price up.
The Bollinger Bands have narrowed to the lower end of their recent range. Volatility is contracting, but direction has yet to emerge.
Liquidations totaled $18 million, against a market cap of $2.8 billion—there’s virtually no leverage.
There’s no sign of leveraged funds in this rally.
It closed at $0.221 on October 21, with volume reaching 1.4 times the usual level—the only genuine volume spike in these eight days.
The next day, it surged to $0.226 before being knocked back down.
A volume-backed rally followed by a pullback the next day: the move hasn’t played out, and the price has now retreated to near its starting point.
$0.23 is the high of this rebound. Within the $0.174–$0.295 range of the past 30 days, it’s roughly in the middle—not near the upper end.
Daily price swings are still close to 10%. With moves of this magnitude, breaking through a level and then falling back is common; confirmation requires looking at the close and volume.
First, watch $0.17 to the downside.
The intraday low of $0.174 on October 19 was the only time this cycle that the price tested that area. In the six days since, it hasn’t fallen below $0.184. On the day Hayes sold off 14 million ENA, buyers absorbed that supply too.
My inclination is that the price will first test $0.21, then fall to $0.17 to find support.
#ENA
1
862
·
--
Partly True
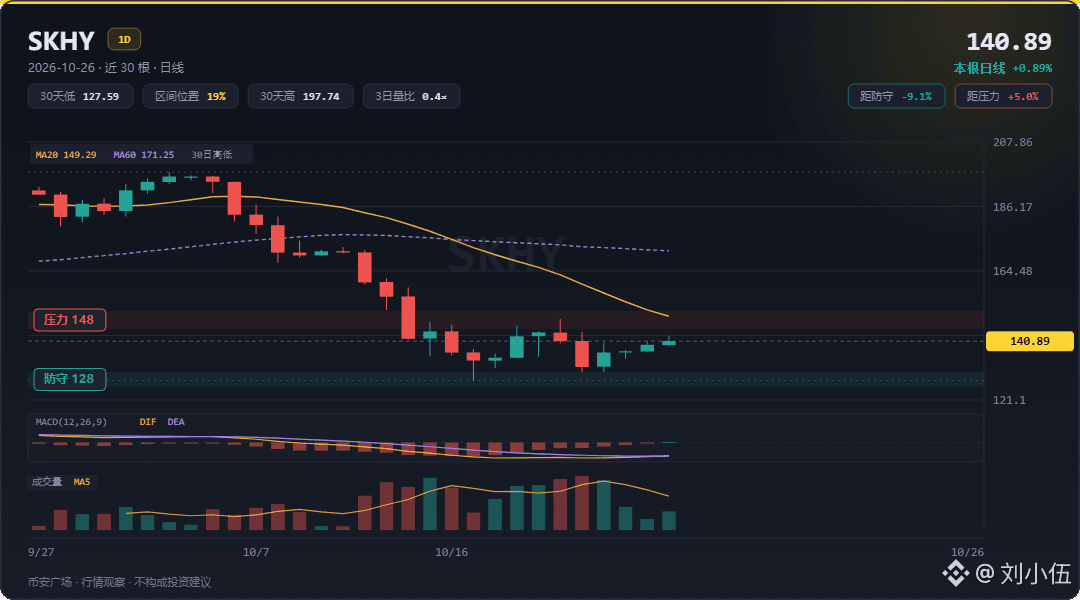
$SKHY Goldman says chip valuations imply a 65% drop in earnings
$141, 24h rolling +2.36%
The daily MACD has formed a golden cross below the zero line, with the red bars expanding for nine straight days. The RSI is only 38, still in the weak range.
But trading volume behind this move is shrinking, not growing. On October 22 it was still 2.5 times the average; over the past two days, it has fallen to just 0.6 and 0.2 times.
Institutions are moving in the opposite direction.
Goldman cut its KOSPI target to 9,000, citing, among other things, that current chip stock valuations imply a 65% decline in earnings. The report came just days before Samsung and SK hynix were due to report results.
I don't think this is a trend reversal.
Volume at 40% isn't enough to support a change in direction. This looks more like a rebound after selling pressure had already run its course.
SK hynix makes DRAM and HBM, and its revenue tracks AI server procurement. These are exactly the areas the report is targeting.
Whether 65% is accurate will have to be tested against the actual figures in the earnings reports. For now, the market action only shows that no one is willing to bid prices up before results are announced.
The level to watch next is 127.59.
This is the lowest point of October's pullback and also near the bottom of the 30-day range. If it breaks, this consolidation will turn into a bearish continuation pattern.
On the upside, the falling medium-term moving average is pressing down near 149. If prices can't reclaim it, a rebound is just a rebound.
$SKHY
{spot}(SKHYBUSDT)
$SKHY Goldman says chip valuations imply a 65% drop in earnings
$141, 24h rolling +2.36%
The daily MACD has formed a golden cross below the zero line, with the red bars expanding for nine straight days. The RSI is only 38, still in the weak range.
But trading volume behind this move is shrinking, not growing. On October 22 it was still 2.5 times the average; over the past two days, it has fallen to just 0.6 and 0.2 times.
Institutions are moving in the opposite direction.
Goldman cut its KOSPI target to 9,000, citing, among other things, that current chip stock valuations imply a 65% decline in earnings. The report came just days before Samsung and SK hynix were due to report results.
I don't think this is a trend reversal.
Volume at 40% isn't enough to support a change in direction. This looks more like a rebound after selling pressure had already run its course.
SK hynix makes DRAM and HBM, and its revenue tracks AI server procurement. These are exactly the areas the report is targeting.
Whether 65% is accurate will have to be tested against the actual figures in the earnings reports. For now, the market action only shows that no one is willing to bid prices up before results are announced.
The level to watch next is 127.59.
This is the lowest point of October's pullback and also near the bottom of the 30-day range. If it breaks, this consolidation will turn into a bearish continuation pattern.
On the upside, the falling medium-term moving average is pressing down near 149. If prices can't reclaim it, a rebound is just a rebound.
$SKHY
273
·
--
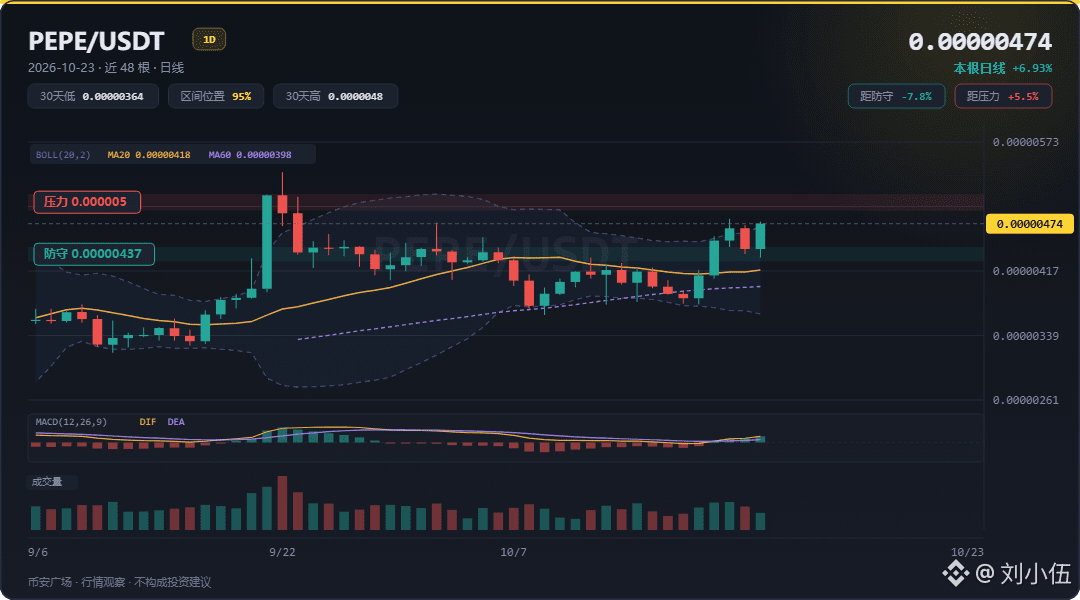
$PEPE Up 19% in seven days, but the funding rate is still stuck at 0.01%
Current price: $0.00000474, 24h +5.36%
PEPE pushed above the upper Bollinger Band today, with the daily chart showing a clean upward move.
The money behind this rally looks more like spot buying—there’s no sign of leveraged chasing, and the derivatives market is far too quiet.
The funding rate and open interest tell the story when viewed together: open interest isn’t small, and both sides are actively competing, yet the funding rate is just 0.01%. Neither side is adding to its position.
So this rally hasn’t built up a crowded, fee-paying long position. If the price turns down, there’ll be less fuel for a cascade of liquidations, so any pullback is more likely to be a slow grind.
The whale angle fits: a transfer of 72 trillion PEPE has drawn attention back to large holders, with speculation about whether Justin Sun is positioning himself. There are also reports of whales scooping up small-cap coins.
The daily MACD crossed bullish three days ago, with DIF above DEA. The histogram has printed higher for five consecutive days and is above the zero line—this points to strengthening, not exhaustion;
the 20-day moving average’s five-day slope has just turned upward. The trend is holding, but there isn’t much of a cushion.
The resistance level being watched above is 0.0000050, another 5.6% higher. First, it needs to clear 0.0000048, where the rally stalled on October 21.
I’m betting it will first test 0.0000050. If it holds above 0.0000048, I’ll keep holding;
#pepe
{spot}(PEPEUSDT)
$PEPE Up 19% in seven days, but the funding rate is still stuck at 0.01%
Current price: $0.00000474, 24h +5.36%
PEPE pushed above the upper Bollinger Band today, with the daily chart showing a clean upward move.
The money behind this rally looks more like spot buying—there’s no sign of leveraged chasing, and the derivatives market is far too quiet.
The funding rate and open interest tell the story when viewed together: open interest isn’t small, and both sides are actively competing, yet the funding rate is just 0.01%. Neither side is adding to its position.
So this rally hasn’t built up a crowded, fee-paying long position. If the price turns down, there’ll be less fuel for a cascade of liquidations, so any pullback is more likely to be a slow grind.
The whale angle fits: a transfer of 72 trillion PEPE has drawn attention back to large holders, with speculation about whether Justin Sun is positioning himself. There are also reports of whales scooping up small-cap coins.
The daily MACD crossed bullish three days ago, with DIF above DEA. The histogram has printed higher for five consecutive days and is above the zero line—this points to strengthening, not exhaustion;
the 20-day moving average’s five-day slope has just turned upward. The trend is holding, but there isn’t much of a cushion.
The resistance level being watched above is 0.0000050, another 5.6% higher. First, it needs to clear 0.0000048, where the rally stalled on October 21.
I’m betting it will first test 0.0000050. If it holds above 0.0000048, I’ll keep holding;
#pepe
437
·
--
Partly True
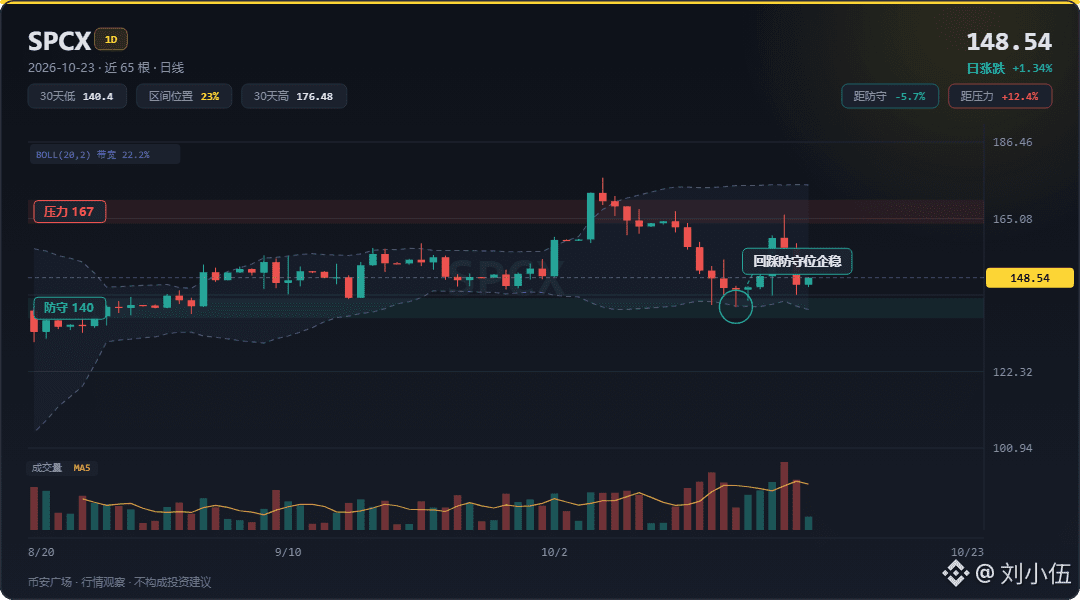
$SPCX A $3.5 trillion merger review is under discussion, and the stock is down 5.26%
Currently $148, 24h -5.26%
Most people see this bearish candle and immediately blame the market action. But the thing to watch today is something else: the board is moving forward with a merger review involving $3.5 trillion worth of assets, including electric vehicles and orbital launch operations.
After the news broke, the stock didn’t rally. Instead, it surged in premarket trading on the most recent trading day, then gave back those gains during the session, forming a solid red candle.
This is a textbook case of good news being sold first. Who’s selling doesn’t matter; what matters is that the news failed to support the price.
Looking back from the perspective of the earnings report, at the October 20 earnings call, Musk himself described a merger as “a good idea,” saying it could bring together software development, chip design, robotics, and connectivity. He also mentioned that the Terafab factory would begin mass production in 2028, but would only say that he “can’t reveal all the details.”
Those comments are a plus on an earnings call, but the market wants current-quarter cash flow, not a story about production capacity in 2028. The stock’s response is clear.
Another thread is the military launches mentioned in the news that same day: SpaceX reportedly walked away from three military satellite launches, with no competing bids. This highlights how few launch providers the Pentagon can choose from.
That’s an endorsement of SpaceX’s bargaining power.
Volatility indicators back up the nature of today’s bearish candle.
Bollinger Band width is 22.2%, near a recent high, and the bands are widening rather than narrowing.
When the bands widen as the price moves down, it usually isn’t the night before a breakout; it means the direction has already been chosen and the move is playing out. So I don’t think this is a false dip.
The current price is 24% of the way up within the Bollinger Bands, still some distance from the lower band around $140. It hasn’t reached an extreme level.
Looking at the structure, the current price is 21% of the way up the range of $140 to $176 over the past 30 days, near the low end.
The 30-day VWAP is $155, and the current price is 4.2% below this trading-cost benchmark. That means the average buyer over the past month is now underwater, making this cost level the first hurdle on the way up.
My view is clear: this decline isn’t over yet. The next stop is the recent 12-day low of $140.40, about 5% below the current price. The 7-day return is still up 1.68%, and volume has risen to 1.6 times its usual level. A high-volume decline is likely to have further room to squeeze lower.
$SPCX
{stock_us}(SPCX.US)
$SPCX A $3.5 trillion merger review is under discussion, and the stock is down 5.26%
Currently $148, 24h -5.26%
Most people see this bearish candle and immediately blame the market action. But the thing to watch today is something else: the board is moving forward with a merger review involving $3.5 trillion worth of assets, including electric vehicles and orbital launch operations.
After the news broke, the stock didn’t rally. Instead, it surged in premarket trading on the most recent trading day, then gave back those gains during the session, forming a solid red candle.
This is a textbook case of good news being sold first. Who’s selling doesn’t matter; what matters is that the news failed to support the price.
Looking back from the perspective of the earnings report, at the October 20 earnings call, Musk himself described a merger as “a good idea,” saying it could bring together software development, chip design, robotics, and connectivity. He also mentioned that the Terafab factory would begin mass production in 2028, but would only say that he “can’t reveal all the details.”
Those comments are a plus on an earnings call, but the market wants current-quarter cash flow, not a story about production capacity in 2028. The stock’s response is clear.
Another thread is the military launches mentioned in the news that same day: SpaceX reportedly walked away from three military satellite launches, with no competing bids. This highlights how few launch providers the Pentagon can choose from.
That’s an endorsement of SpaceX’s bargaining power.
Volatility indicators back up the nature of today’s bearish candle.
Bollinger Band width is 22.2%, near a recent high, and the bands are widening rather than narrowing.
When the bands widen as the price moves down, it usually isn’t the night before a breakout; it means the direction has already been chosen and the move is playing out. So I don’t think this is a false dip.
The current price is 24% of the way up within the Bollinger Bands, still some distance from the lower band around $140. It hasn’t reached an extreme level.
Looking at the structure, the current price is 21% of the way up the range of $140 to $176 over the past 30 days, near the low end.
The 30-day VWAP is $155, and the current price is 4.2% below this trading-cost benchmark. That means the average buyer over the past month is now underwater, making this cost level the first hurdle on the way up.
My view is clear: this decline isn’t over yet. The next stop is the recent 12-day low of $140.40, about 5% below the current price. The 7-day return is still up 1.68%, and volume has risen to 1.6 times its usual level. A high-volume decline is likely to have further room to squeeze lower.
$SPCX
SPCX+0.44%
SPCXUS+1.20%
1
1.9k
·
--
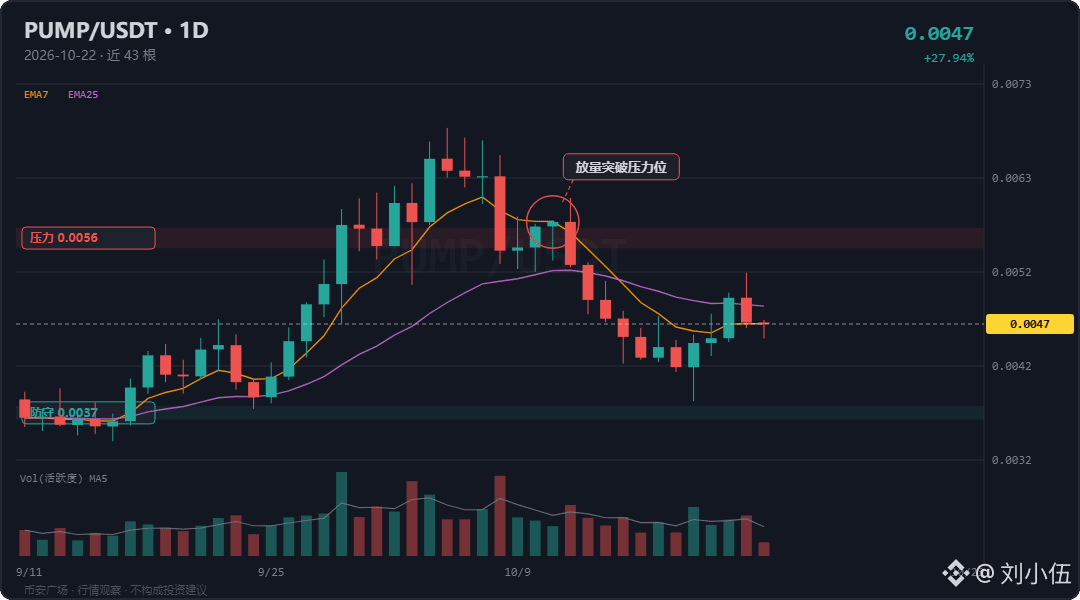
$PUMP Price range 10.8%, volume only 0.8x the usual level
24h -6.60%, current price $0.00467
When prices fall without a corresponding rise in volume, it’s usually not money pulling out—it’s that there are fewer buyers stepping in.
Today’s bearish candle fits that pattern.
It started on October 20, when Pump.fun brought Pre-IPO tokens onto the platform. The next day, it filled in the details: there are eight companies in total, including OpenAI and Anthropic.
Those tokens aren’t equity; they only offer economic exposure, and their value depends on valuation expectations.
For the platform, this creates another potential source of fees, but it’s still unclear whether that will translate into actual fee revenue.
Today’s pullback came on average volume, suggesting sellers aren’t in a hurry. What’s really missing is buying demand.
In a thinly traded market, prices are less sensitive to capital flows. One candle can do the work of several days elsewhere, making false breaks of key levels more likely.
The midpoint between this month’s high and low is around 0.005. The current price is still below it. If a rebound reaches that level without volume backing it, it likely won’t hold above it.
The most likely path from here is a bounce toward 0.005 that gets rejected, followed by a continued drift toward this month’s low.
#pump
{spot}(PUMPUSDT)
$PUMP Price range 10.8%, volume only 0.8x the usual level
24h -6.60%, current price $0.00467
When prices fall without a corresponding rise in volume, it’s usually not money pulling out—it’s that there are fewer buyers stepping in.
Today’s bearish candle fits that pattern.
It started on October 20, when Pump.fun brought Pre-IPO tokens onto the platform. The next day, it filled in the details: there are eight companies in total, including OpenAI and Anthropic.
Those tokens aren’t equity; they only offer economic exposure, and their value depends on valuation expectations.
For the platform, this creates another potential source of fees, but it’s still unclear whether that will translate into actual fee revenue.
Today’s pullback came on average volume, suggesting sellers aren’t in a hurry. What’s really missing is buying demand.
In a thinly traded market, prices are less sensitive to capital flows. One candle can do the work of several days elsewhere, making false breaks of key levels more likely.
The midpoint between this month’s high and low is around 0.005. The current price is still below it. If a rebound reaches that level without volume backing it, it likely won’t hold above it.
The most likely path from here is a bounce toward 0.005 that gets rejected, followed by a continued drift toward this month’s low.
#pump
287
·
--
Verified
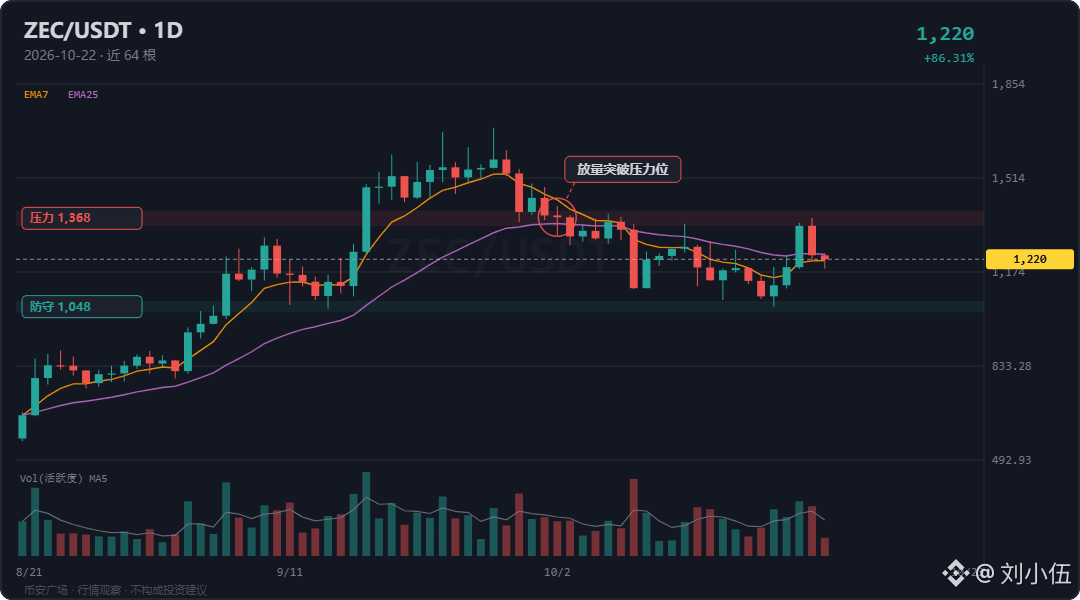
$ZEC Block time cut from 75 seconds to 25 seconds, but the price hasn’t budged
Price at $1,216 (24h: -6.48%)
Taking 60% of fees out of circulation is a much bigger deal than speeding up block production.
The proposal itself says the final activation parameters still need to be implemented. November 5 is currently just a target, not a date set in stone.
With the date still uncertain, not much money will be willing to get in early.
Today, the price has basically given back the gains from that 8.5% green candle three days ago.
Despite such a major change, trading volume hasn’t shown much enthusiasm: the average volume over the past three days is on par with the previous 20 days. There was no volume spike on the way down or up—it’s just existing holders trading back and forth.
The funding rate is hovering around zero, and open interest is nothing special. Today’s drop looks more like early winners taking profits; there’s little sign of leveraged liquidations.
The two daily moving averages were almost touching. Now that the price has slipped below them, that bit of short-term support has turned into a ceiling.
For the price to move higher, it first needs to reclaim both moving averages before 1368 comes into play. That’s the high from the past 12 days, and there are still trapped positions up there.
A move above 1368 would invalidate the bearish scenario outlined below.
On the node side, the issue causing Zebra to stop syncing was fixed over the past couple of days. The team says the fix landed ahead of the NU7 stable release.
It’s good work, but its impact on price will be gradual.
My view is that the price will keep grinding below these two moving averages. If it can’t break through, it’ll retreat toward the monthly low, with little meaningful support along the way.
#zec
{spot}(ZECUSDT)
$ZEC Block time cut from 75 seconds to 25 seconds, but the price hasn’t budged
Price at $1,216 (24h: -6.48%)
Taking 60% of fees out of circulation is a much bigger deal than speeding up block production.
The proposal itself says the final activation parameters still need to be implemented. November 5 is currently just a target, not a date set in stone.
With the date still uncertain, not much money will be willing to get in early.
Today, the price has basically given back the gains from that 8.5% green candle three days ago.
Despite such a major change, trading volume hasn’t shown much enthusiasm: the average volume over the past three days is on par with the previous 20 days. There was no volume spike on the way down or up—it’s just existing holders trading back and forth.
The funding rate is hovering around zero, and open interest is nothing special. Today’s drop looks more like early winners taking profits; there’s little sign of leveraged liquidations.
The two daily moving averages were almost touching. Now that the price has slipped below them, that bit of short-term support has turned into a ceiling.
For the price to move higher, it first needs to reclaim both moving averages before 1368 comes into play. That’s the high from the past 12 days, and there are still trapped positions up there.
A move above 1368 would invalidate the bearish scenario outlined below.
On the node side, the issue causing Zebra to stop syncing was fixed over the past couple of days. The team says the fix landed ahead of the NU7 stable release.
It’s good work, but its impact on price will be gradual.
My view is that the price will keep grinding below these two moving averages. If it can’t break through, it’ll retreat toward the monthly low, with little meaningful support along the way.
#zec
1
1
665
·
--
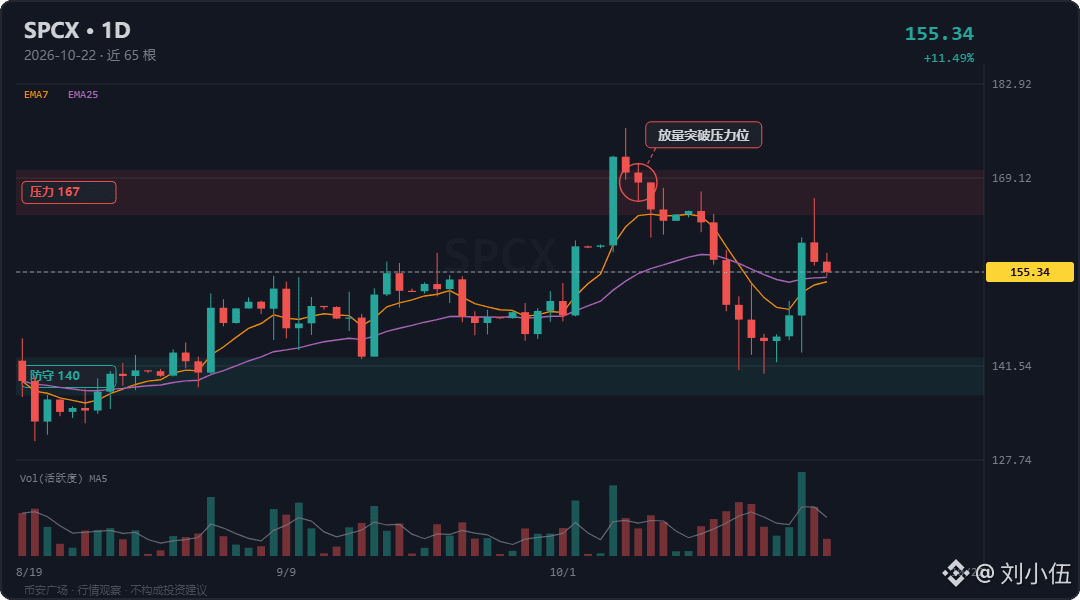
$SPCX SpaceX fair value cut to 222.71
Currently $155, down 4.74% in 24 hours
Its strongest week in more than three months, and one bearish candle today wiped out all the gains it had built up.
Volume over the past three days was 1.7 times that of the previous 20 days. Today’s volume was distribution volume.
The pressure came from Tesla: quarterly profits fell, while the company is also discussing a merger with SpaceX. Both stocks slid before the market opened.
Morningstar raised Tesla’s fair value from 450 to 475, citing stronger FSD adoption and lower spending assumptions. That news didn’t lift the stock premarket.
Investors are focused on profits; the story comes second.
For SpaceX, the model price was cut from 227.54 to 222.71. The point of disagreement is growth risk.
Some have calculated that it would take decades for this price to be realized. Morningstar puts the reuse of the upper stage at the end of 2028.
Today’s sell-off wasn’t driven by the investors focused on valuation. It was a combination of the merger story losing steam and traders taking profits after a week of gains.
167 is the high from the past two weeks. The rebound ran out of steam when it reached that level.
Unless it can break above that level, the bounce is just a recovery. If it closes above 167, my bearish view no longer holds.
140 is the low for the month. If it breaks below that, the month’s trading range will be completely invalidated.
The more likely next move is a test of 140. Any rebound will have to wait until the shares bought by those who chased the rally are absorbed.
$SPCX
{spot}(SPCXBUSDT)
$SPCX SpaceX fair value cut to 222.71
Currently $155, down 4.74% in 24 hours
Its strongest week in more than three months, and one bearish candle today wiped out all the gains it had built up.
Volume over the past three days was 1.7 times that of the previous 20 days. Today’s volume was distribution volume.
The pressure came from Tesla: quarterly profits fell, while the company is also discussing a merger with SpaceX. Both stocks slid before the market opened.
Morningstar raised Tesla’s fair value from 450 to 475, citing stronger FSD adoption and lower spending assumptions. That news didn’t lift the stock premarket.
Investors are focused on profits; the story comes second.
For SpaceX, the model price was cut from 227.54 to 222.71. The point of disagreement is growth risk.
Some have calculated that it would take decades for this price to be realized. Morningstar puts the reuse of the upper stage at the end of 2028.
Today’s sell-off wasn’t driven by the investors focused on valuation. It was a combination of the merger story losing steam and traders taking profits after a week of gains.
167 is the high from the past two weeks. The rebound ran out of steam when it reached that level.
Unless it can break above that level, the bounce is just a recovery. If it closes above 167, my bearish view no longer holds.
140 is the low for the month. If it breaks below that, the month’s trading range will be completely invalidated.
The more likely next move is a test of 140. Any rebound will have to wait until the shares bought by those who chased the rally are absorbed.
$SPCX
160
·
--
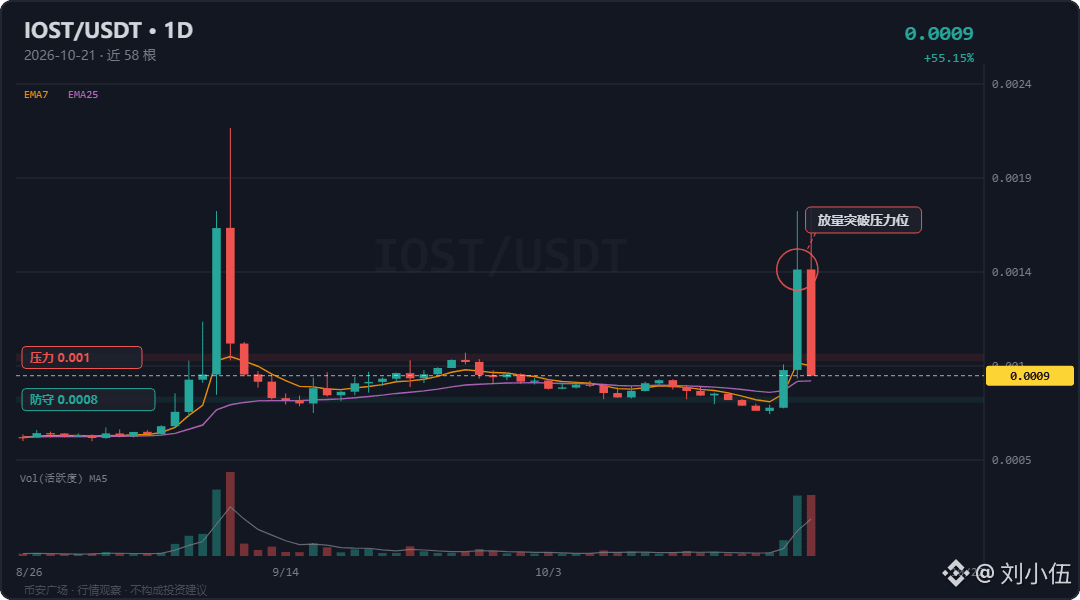
$IOST Down a third in one day, yet still up 10% net over seven days
Trading at $0.000912, down 33.92% in 24 hours
It’s too early to talk about a bottom.
This drop wiped out the leverage built up over the past seven days. The price is still nearly 30% above its monthly low, so there’s room to fall if it heads lower.
IOST is a public blockchain launched in 2018, focused on high TPS. Its market cap is just over $30 million, and it ranks outside the top 600.
Sequoia invested early on, so its foundations aren’t bad. But the market is tiny, and it doesn’t take much money to push the price up or dump it.
Trading volume over the past three days was more than 100 times that of the previous 20 days, as the price retreated all the way from its monthly high.
This much volume alongside a bearish candle points to distribution.
The funding rate is negative, so crowded shorts are paying to stay in their positions. The more crowded the shorts get, the more likely a bounce comes first—so don’t expect a straight drop.
If the rebound reaches the round-number level of 0.001 but can’t break above it or hold there, don’t expect much upside;
If it does hold above that level, my bearish view is invalidated.
Next, it’ll probably bounce first, get rejected at that level, then head lower to test the lows around the start of the month. Expect some back-and-forth along the way.
#IOST
{future}(IOSTUSDT)
$IOST Down a third in one day, yet still up 10% net over seven days
Trading at $0.000912, down 33.92% in 24 hours
It’s too early to talk about a bottom.
This drop wiped out the leverage built up over the past seven days. The price is still nearly 30% above its monthly low, so there’s room to fall if it heads lower.
IOST is a public blockchain launched in 2018, focused on high TPS. Its market cap is just over $30 million, and it ranks outside the top 600.
Sequoia invested early on, so its foundations aren’t bad. But the market is tiny, and it doesn’t take much money to push the price up or dump it.
Trading volume over the past three days was more than 100 times that of the previous 20 days, as the price retreated all the way from its monthly high.
This much volume alongside a bearish candle points to distribution.
The funding rate is negative, so crowded shorts are paying to stay in their positions. The more crowded the shorts get, the more likely a bounce comes first—so don’t expect a straight drop.
If the rebound reaches the round-number level of 0.001 but can’t break above it or hold there, don’t expect much upside;
If it does hold above that level, my bearish view is invalidated.
Next, it’ll probably bounce first, get rejected at that level, then head lower to test the lows around the start of the month. Expect some back-and-forth along the way.
#IOST
178
·
--
Partly True
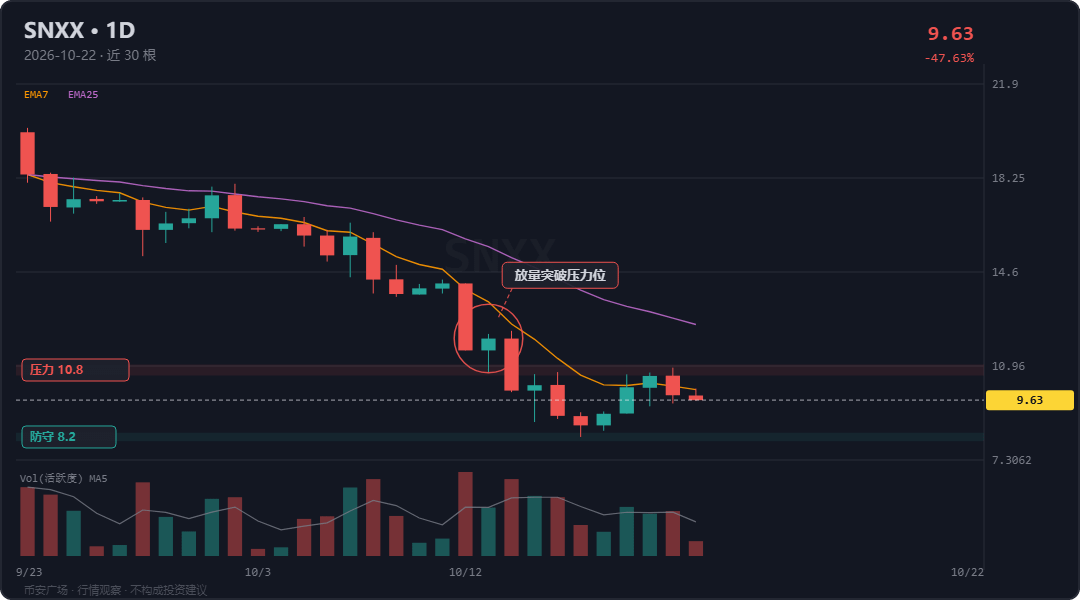
$SNXX Current price: $9.68 (24h -9.53%)
Super Micro Computer raised its full-year revenue guidance to $18.5 billion–$19.5 billion and also said gross margins should expand, yet its stock fell 6.69% today. Earnings guidance up, stock down—the money in this chain is cashing out.
Micron, Dell, and Hewlett Packard Enterprise all fell today. Western Digital was the only one to hold up, gaining 0.13%, while the semiconductor ETF fell 2.05% overall.
The drag came from server systems, pulling storage down with them.
All the moving averages are overhead and trending down. The price is not far above its monthly low, and is still about halfway below its monthly high.
Today's bearish candle left 10.80 overhead.
If it can't close back above 10.80, the path of grinding lower remains unchanged;
if it does close above, the losses on this leg down will have to be reassessed.
On October 20, VanEck ETFs still saw a combined net inflow of $360 million. Money hasn't left semiconductors; it just didn't flow into storage today.
Yesterday, some were calling SanDisk cheap at 17.6 times earnings.
After an 851% gain in a year, a 25.6% pullback is what made it cheap.
First, it may grind down toward the monthly low. There's still 18% of downside room to that area.
Based on its trading range since listing, the price is still more than halfway off its high.
$SNXX
{future}(SNXXUSDT)
$SNXX Current price: $9.68 (24h -9.53%)
Super Micro Computer raised its full-year revenue guidance to $18.5 billion–$19.5 billion and also said gross margins should expand, yet its stock fell 6.69% today. Earnings guidance up, stock down—the money in this chain is cashing out.
Micron, Dell, and Hewlett Packard Enterprise all fell today. Western Digital was the only one to hold up, gaining 0.13%, while the semiconductor ETF fell 2.05% overall.
The drag came from server systems, pulling storage down with them.
All the moving averages are overhead and trending down. The price is not far above its monthly low, and is still about halfway below its monthly high.
Today's bearish candle left 10.80 overhead.
If it can't close back above 10.80, the path of grinding lower remains unchanged;
if it does close above, the losses on this leg down will have to be reassessed.
On October 20, VanEck ETFs still saw a combined net inflow of $360 million. Money hasn't left semiconductors; it just didn't flow into storage today.
Yesterday, some were calling SanDisk cheap at 17.6 times earnings.
After an 851% gain in a year, a 25.6% pullback is what made it cheap.
First, it may grind down toward the monthly low. There's still 18% of downside room to that area.
Based on its trading range since listing, the price is still more than halfway off its high.
$SNXX
1
1.3k
·
--
Partly True
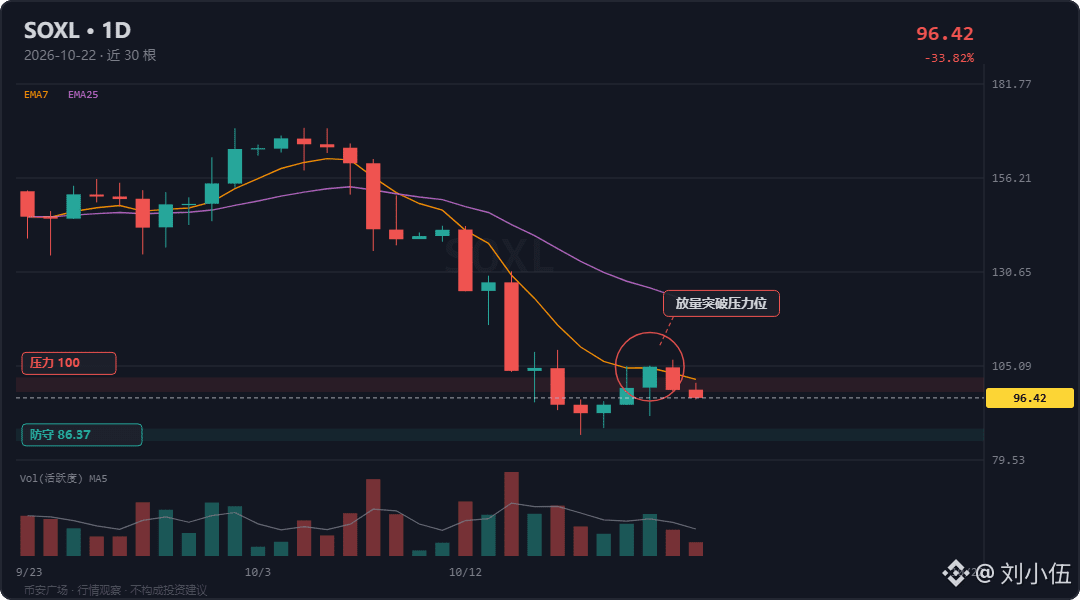
$SOXL Volume doubled, while the price remains 43% below the monthly high
Trading at $96.59, down 8.57% in 24 hours
Even after falling this far, it still hasn’t found a bottom. Volume over the past three days was twice that of the previous 20 days, but even that much trading couldn’t support the price.
The entire semiconductor sector weakened today, and this moved in tandem with it. There was no separate announcement from any of its constituents.
The price is only a little over 10% above the monthly low. The two daily moving averages overhead are still far away; the price hasn’t touched either one during this downturn.
To turn upward, it first needs to break through the round-number level of 100.
If it can’t get above that level, these rebounds along the way are just pauses in the decline.
The index it tracks is heavily weighted toward a few major companies. When they all weaken together, this fund has nowhere to hide.
This has nothing to do with any one company’s earnings; the entire semiconductor chain is moving lower.
I think it will go on to test the monthly low. I don’t see the rebounds along the way as a reversal.
$SOXL
{future}(SOXLUSDT)
$SOXL Volume doubled, while the price remains 43% below the monthly high
Trading at $96.59, down 8.57% in 24 hours
Even after falling this far, it still hasn’t found a bottom. Volume over the past three days was twice that of the previous 20 days, but even that much trading couldn’t support the price.
The entire semiconductor sector weakened today, and this moved in tandem with it. There was no separate announcement from any of its constituents.
The price is only a little over 10% above the monthly low. The two daily moving averages overhead are still far away; the price hasn’t touched either one during this downturn.
To turn upward, it first needs to break through the round-number level of 100.
If it can’t get above that level, these rebounds along the way are just pauses in the decline.
The index it tracks is heavily weighted toward a few major companies. When they all weaken together, this fund has nowhere to hide.
This has nothing to do with any one company’s earnings; the entire semiconductor chain is moving lower.
I think it will go on to test the monthly low. I don’t see the rebounds along the way as a reversal.
$SOXL
1
1
2.6k
·
--
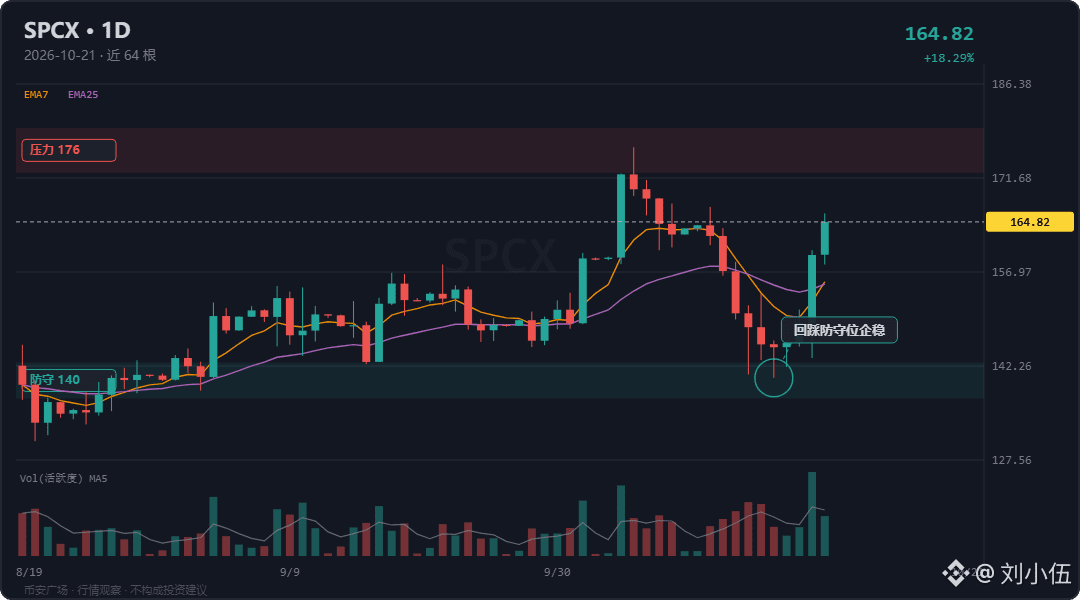
SPCX up 13% in a day: Are profits or the merger driving the rally?
Price at $166 (24h +13.58%)
The profit numbers are real, but the merger story is still up in the air. Today, the stock jumped 13 points on the story alone.
Musk himself first floated the idea, saying “a merger is a good idea.” Shareholders ran with it, putting the math for combining Tesla, SpaceXAI, and X into one group on the table.
Neither company has confirmed anything. The news is still at the “possible” stage, and the less concrete it gets, the more people try to get in early.
The third-quarter books are out: revenue of $14.58 billion, profit of $4.4 billion, and AI revenue up ninefold.
But the $19.6 billion in expenses really stands out, and institutions immediately started picking at the cost issue.
Profits look good, costs put people off, and money is being pulled in both directions.
All the daily moving averages are below the price, so they aren’t acting as resistance. The issue is that the previous high is close overhead.
Volume is up 1.7x, but the stock still hasn’t broken through the previous high. The move looks weak, so chasing it doesn’t seem worthwhile.
My expectation is that it consolidates here first. If it can’t reach the previous high, it may pull back to around 140.
140 was the platform where this move began. A drop back there would put the structure to the test; if it breaks below, this entire rally will have been for nothing.
I’m bearish on this move and won’t chase it before it breaks above the previous high.
$SPCX
{future}(SPCXUSDT)
SPCX up 13% in a day: Are profits or the merger driving the rally?
Price at $166 (24h +13.58%)
The profit numbers are real, but the merger story is still up in the air. Today, the stock jumped 13 points on the story alone.
Musk himself first floated the idea, saying “a merger is a good idea.” Shareholders ran with it, putting the math for combining Tesla, SpaceXAI, and X into one group on the table.
Neither company has confirmed anything. The news is still at the “possible” stage, and the less concrete it gets, the more people try to get in early.
The third-quarter books are out: revenue of $14.58 billion, profit of $4.4 billion, and AI revenue up ninefold.
But the $19.6 billion in expenses really stands out, and institutions immediately started picking at the cost issue.
Profits look good, costs put people off, and money is being pulled in both directions.
All the daily moving averages are below the price, so they aren’t acting as resistance. The issue is that the previous high is close overhead.
Volume is up 1.7x, but the stock still hasn’t broken through the previous high. The move looks weak, so chasing it doesn’t seem worthwhile.
My expectation is that it consolidates here first. If it can’t reach the previous high, it may pull back to around 140.
140 was the platform where this move began. A drop back there would put the structure to the test; if it breaks below, this entire rally will have been for nothing.
I’m bearish on this move and won’t chase it before it breaks above the previous high.
$SPCX
325
·
--
Partly True
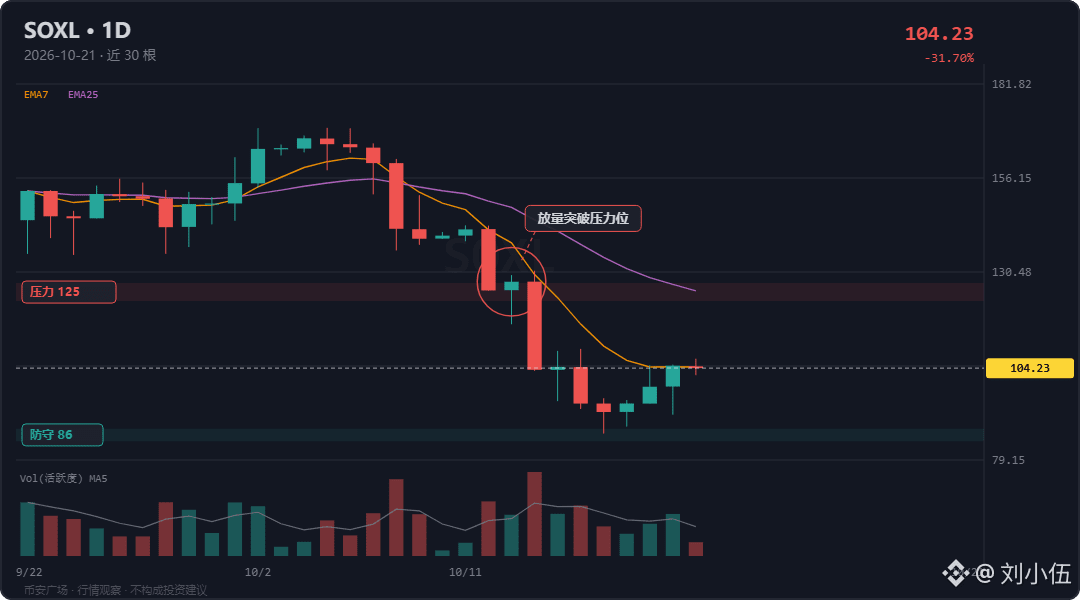
$SOXL , still 48.8% below its listing high
At $105, up 10.44% in 24 hours
Volume over three days reached 2.6 times the total for the previous 20 days, while the net gain over seven days was less than 1%.
Money is changing hands back and forth, but the price is standing still. That tells you what this rebound is really worth.
The price is still below the halfway point.
Earnings season is approaching, and the semiconductor reports will be a major focus.
Leveraged ETFs don’t wait for earnings to come out; they rebalance their positions every day. A week of sideways trading, and decay comes straight out of the fund’s net asset value.
On the daily chart, the price is still a long way from those two moving averages above. This rebound hasn’t even reached the threshold.
Those two lines are sloping downward, and every inch of this rebound is giving trapped holders room to get out.
86.37 was where this bounce started, and it was also the month’s low. If it breaks below that level, everyone who jumped in today and those who bought the dip earlier will have to rethink their positions. There aren’t many orders waiting below.
This is just a technical bounce after being oversold. Don’t mistake it for a trend reversal.
Until the underlying stock turns around, this rebound is just giving sellers time to unload.
For now, I’m inclined to think it will move up to test those two moving averages. If it can’t reach them, it’ll get pushed back down, then turn around and test 86.37 again.
If it truly gets back above the moving averages, the bearish thesis is no longer valid.
$SOXL
{future}(SOXLUSDT)
$SOXL , still 48.8% below its listing high
At $105, up 10.44% in 24 hours
Volume over three days reached 2.6 times the total for the previous 20 days, while the net gain over seven days was less than 1%.
Money is changing hands back and forth, but the price is standing still. That tells you what this rebound is really worth.
The price is still below the halfway point.
Earnings season is approaching, and the semiconductor reports will be a major focus.
Leveraged ETFs don’t wait for earnings to come out; they rebalance their positions every day. A week of sideways trading, and decay comes straight out of the fund’s net asset value.
On the daily chart, the price is still a long way from those two moving averages above. This rebound hasn’t even reached the threshold.
Those two lines are sloping downward, and every inch of this rebound is giving trapped holders room to get out.
86.37 was where this bounce started, and it was also the month’s low. If it breaks below that level, everyone who jumped in today and those who bought the dip earlier will have to rethink their positions. There aren’t many orders waiting below.
This is just a technical bounce after being oversold. Don’t mistake it for a trend reversal.
Until the underlying stock turns around, this rebound is just giving sellers time to unload.
For now, I’m inclined to think it will move up to test those two moving averages. If it can’t reach them, it’ll get pushed back down, then turn around and test 86.37 again.
If it truly gets back above the moving averages, the bearish thesis is no longer valid.
$SOXL
1.3k
·
--
$WLD Up 17% in two days!!!
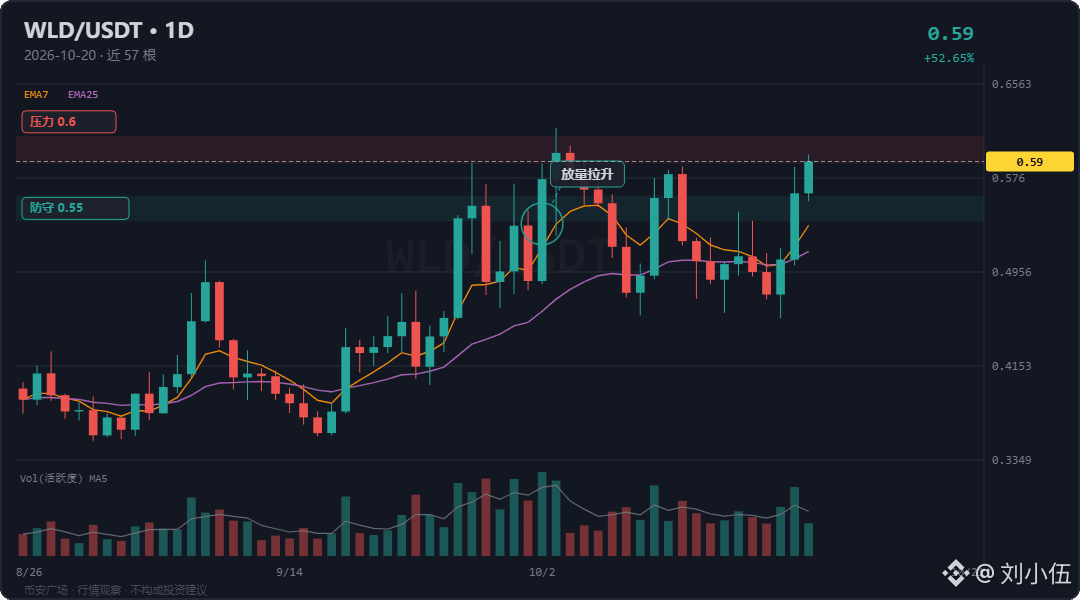
Price at $0.589 (24h +9.32%)
I’d say today’s buying in WLD is genuine.
The bears are feeling the pressure overhead. Since the dip to last Sunday’s low, it’s rallied 17%. Buying volume only started coming in Monday night, and today’s move is basically a continuation of that buying.
Analysts are weighing in too: they like the chart, they like the coin, and they think there may be an announcement coming. Public endorsements like these usually don’t happen at the bottom, but the price hasn’t fallen, so the people making these calls are effectively going along with the buying.
Those who bought near Sunday night’s low have the most confidence now; the bears can only grit their teeth.
Funding is only slightly positive, so today’s rally isn’t overcrowded;
Open interest is still elevated. If $0.55 gives way, these positions could all rush for the exits.
My level to watch is also $0.55. That’s where Sunday’s move started. If it breaks, both today’s buyers and those who bought the dip will have to rethink their positions.
I’m still treating this as a strong market tonight.
#WLD
{future}(WLDUSDT)
$WLD Up 17% in two days!!!
Price at $0.589 (24h +9.32%)
I’d say today’s buying in WLD is genuine.
The bears are feeling the pressure overhead. Since the dip to last Sunday’s low, it’s rallied 17%. Buying volume only started coming in Monday night, and today’s move is basically a continuation of that buying.
Analysts are weighing in too: they like the chart, they like the coin, and they think there may be an announcement coming. Public endorsements like these usually don’t happen at the bottom, but the price hasn’t fallen, so the people making these calls are effectively going along with the buying.
Those who bought near Sunday night’s low have the most confidence now; the bears can only grit their teeth.
Funding is only slightly positive, so today’s rally isn’t overcrowded;
Open interest is still elevated. If $0.55 gives way, these positions could all rush for the exits.
My level to watch is also $0.55. That’s where Sunday’s move started. If it breaks, both today’s buyers and those who bought the dip will have to rethink their positions.
I’m still treating this as a strong market tonight.
#WLD
458
·
--
$MSTR $2.8 billion in passive selling hangs over Strategy’s index eligibility
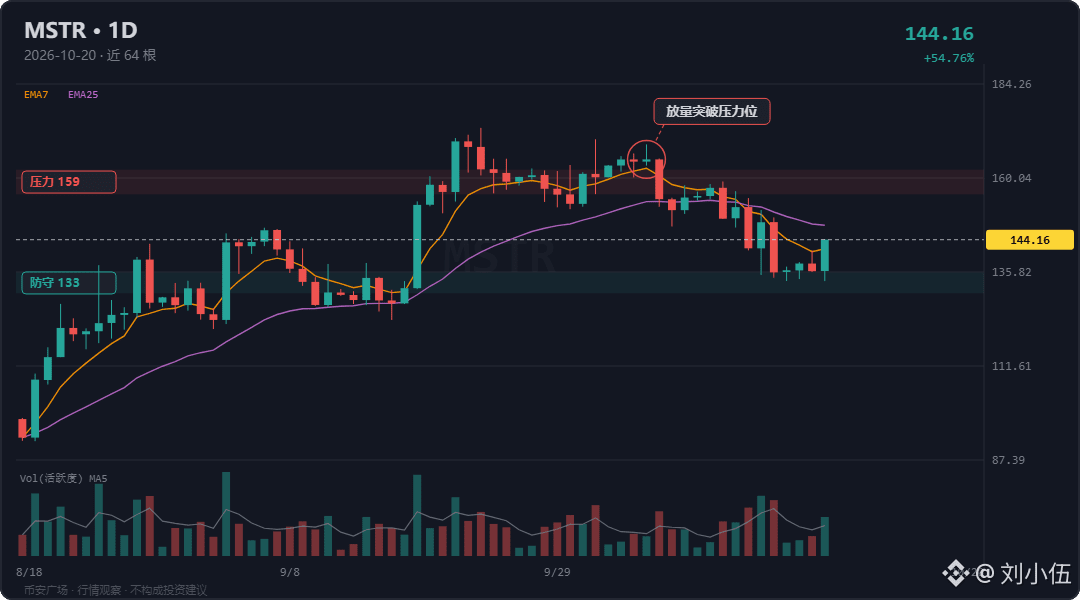
Current price: $143 (24h: +2.92%)
This rebound doesn’t have staying power; volume hasn’t followed through.
Average volume over the past three days is about the same as over the prior twenty. Today’s green candle formed without any fresh money coming in. The buyers were probably mostly short-covering from those who had reduced their positions earlier; real buyers haven’t shown up yet.
The price is still below both daily moving averages, and those two lines continue to slope downward overhead.
The unresolved issue is on the index front.
MSCI is reviewing Strategy’s index eligibility. If the company is removed, passive funds that track the rules would have to sell about $2.8 billion worth of shares.
That money won’t all hit the market in a single day, but it’s part of the valuation’s foundation: passive funds care about index constituents, not the story.
The company is still buying, too. It added $22 million worth of Bitcoin over seven days, marking its fifth consecutive week of purchases. Against the company’s size, that amount looks more like a statement than enough to support the stock price.
To the downside, I’m watching $133.47, the low from the past twelve days. If the price gets there, I’ll look to see whether there’s real support. If it doesn’t hold, this daily-chart downswing isn’t over.
Unless the price moves back above both moving averages on strong volume, nothing else matters.
My view is that this rebound will probably reach the moving averages at most before getting pushed back down. We’ll likely have to revisit the area around this month’s lows.
$MSTR
{future}(MSTRUSDT)
$MSTR $2.8 billion in passive selling hangs over Strategy’s index eligibility
Current price: $143 (24h: +2.92%)
This rebound doesn’t have staying power; volume hasn’t followed through.
Average volume over the past three days is about the same as over the prior twenty. Today’s green candle formed without any fresh money coming in. The buyers were probably mostly short-covering from those who had reduced their positions earlier; real buyers haven’t shown up yet.
The price is still below both daily moving averages, and those two lines continue to slope downward overhead.
The unresolved issue is on the index front.
MSCI is reviewing Strategy’s index eligibility. If the company is removed, passive funds that track the rules would have to sell about $2.8 billion worth of shares.
That money won’t all hit the market in a single day, but it’s part of the valuation’s foundation: passive funds care about index constituents, not the story.
The company is still buying, too. It added $22 million worth of Bitcoin over seven days, marking its fifth consecutive week of purchases. Against the company’s size, that amount looks more like a statement than enough to support the stock price.
To the downside, I’m watching $133.47, the low from the past twelve days. If the price gets there, I’ll look to see whether there’s real support. If it doesn’t hold, this daily-chart downswing isn’t over.
Unless the price moves back above both moving averages on strong volume, nothing else matters.
My view is that this rebound will probably reach the moving averages at most before getting pushed back down. We’ll likely have to revisit the area around this month’s lows.
$MSTR
219
·
--
$CRCL Expanded into 40 markets, but the stock fell 5 points
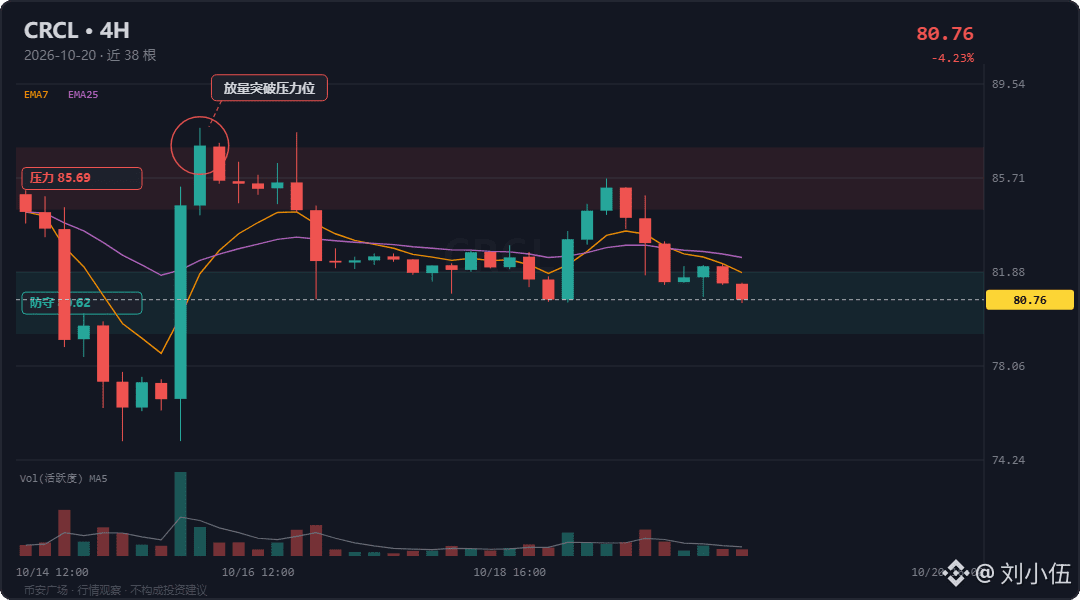
Price at $80.88 (24h -5.07%)
Down 5 points, but volume hasn't picked up. The volume of the last three 4-hour candles is about equal to the average of the previous twenty.
Sellers aren't piling in. The problem is on the buying side: nobody's showing up. This is the most painful kind of drop—it never gives you a panic-driven low.
Circle plans to bring USDC to 40 markets, focusing on making cross-border payments cheaper. Its confidence comes from USDC's sizable share of stablecoin transfer volume.
Expanding into new markets costs money and won't bring profits in the short term. Investors are doing a different kind of math right now.
Last week's figures: $36 trillion in annual settlement volume, and $1.4 billion in revenue in the first half of 2026. Nearly 60% went to ecosystem partners like Coinbase and Binance, leaving a net margin of just 7%.
No matter how large the transaction volume gets, only a sliver reaches shareholders. Against this kind of income statement, expansion news isn't enough to support the valuation.
The moving averages look bearish too: the short-term lines are stacked one below another, all sloping downward overhead.
There's not much in the way of buy orders waiting below to catch the fall.
$CRCL
{future}(CRCLUSDT)
$CRCL Expanded into 40 markets, but the stock fell 5 points
Price at $80.88 (24h -5.07%)
Down 5 points, but volume hasn't picked up. The volume of the last three 4-hour candles is about equal to the average of the previous twenty.
Sellers aren't piling in. The problem is on the buying side: nobody's showing up. This is the most painful kind of drop—it never gives you a panic-driven low.
Circle plans to bring USDC to 40 markets, focusing on making cross-border payments cheaper. Its confidence comes from USDC's sizable share of stablecoin transfer volume.
Expanding into new markets costs money and won't bring profits in the short term. Investors are doing a different kind of math right now.
Last week's figures: $36 trillion in annual settlement volume, and $1.4 billion in revenue in the first half of 2026. Nearly 60% went to ecosystem partners like Coinbase and Binance, leaving a net margin of just 7%.
No matter how large the transaction volume gets, only a sliver reaches shareholders. Against this kind of income statement, expansion news isn't enough to support the valuation.
The moving averages look bearish too: the short-term lines are stacked one below another, all sloping downward overhead.
There's not much in the way of buy orders waiting below to catch the fall.
$CRCL
345
Log in to explore more content
Join global crypto users on Binance Square
⚡️ Get latest and useful information about crypto.
💬 Trusted by the world’s largest crypto exchange.
👍 Discover real insights from verified creators.
Email / Phone number
Trending Topics
EthereumDropsBelow$2300
1,562 views
68 Discussing
$ETH remains one of the best buying between 2300 / 2150 for midterm to hold next some weeks only
Possible squeeze up 3000 to 3400
Just need to hold 2200
Quick scalper_1196
·3 Likes
·636 views
BitcoinSlipsBelow$80KAgain
3,040 views
41 Discussing
ThailandLaunchesWORPTStablecoinToQRPaymentApp
3,976 views
120 Discussing