
SunspotAlgo
1.5k Posts
SunspotAlgo
Report
Block User
全职交易员|趋势交易者|全品种交易
技术指标开发者|AI 工程师
专注趋势跟踪与多市场交易,覆盖指数、商品、外汇、加密等全品种。作为指标与AI开发者,我用代码将交易逻辑系统化,让信号可验证、可执行、可复盘。信奉顺势、风控与纪律,不预测市场,只跟随趋势。
“万种行情归一势,半由心法半由机。”
74 Following
84 Followers
54 Liked
Posts
PINNED
·
--
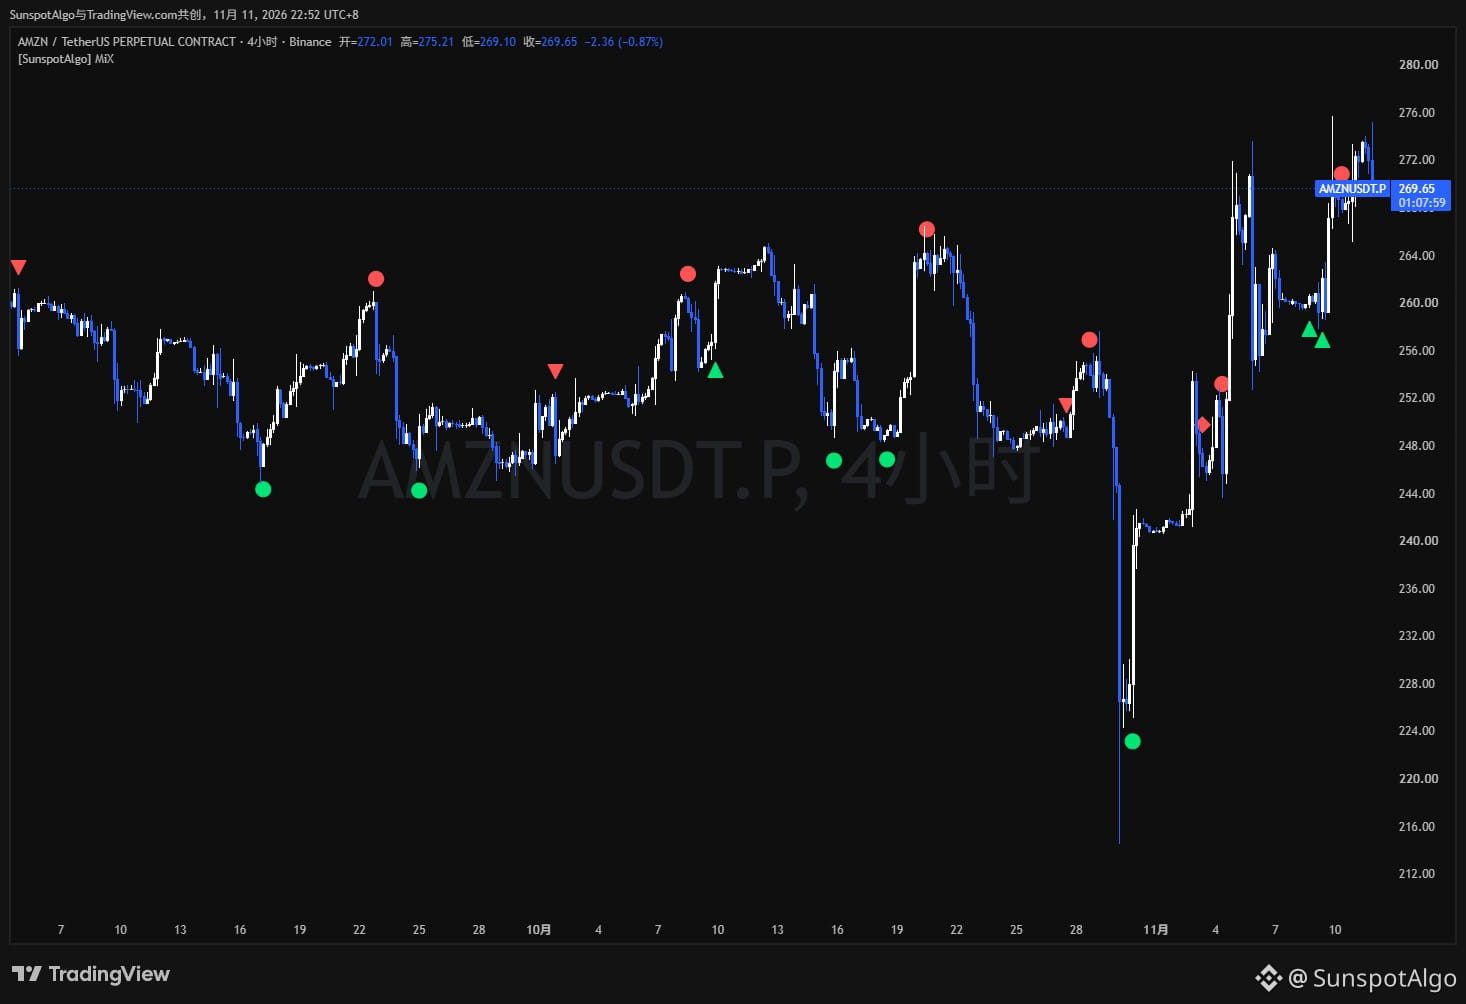
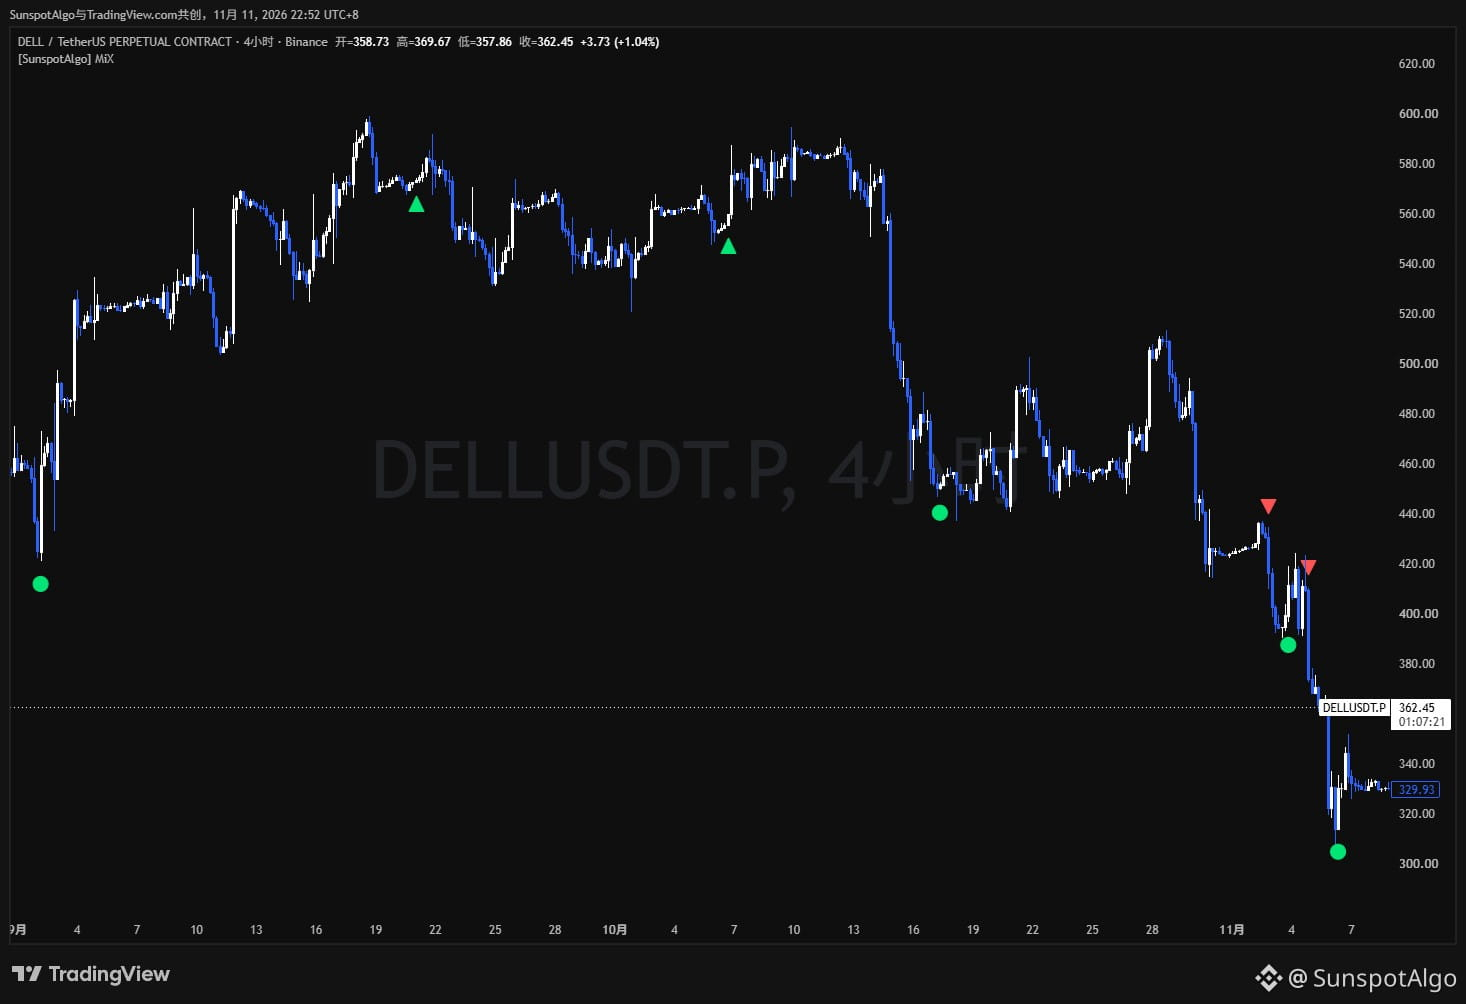
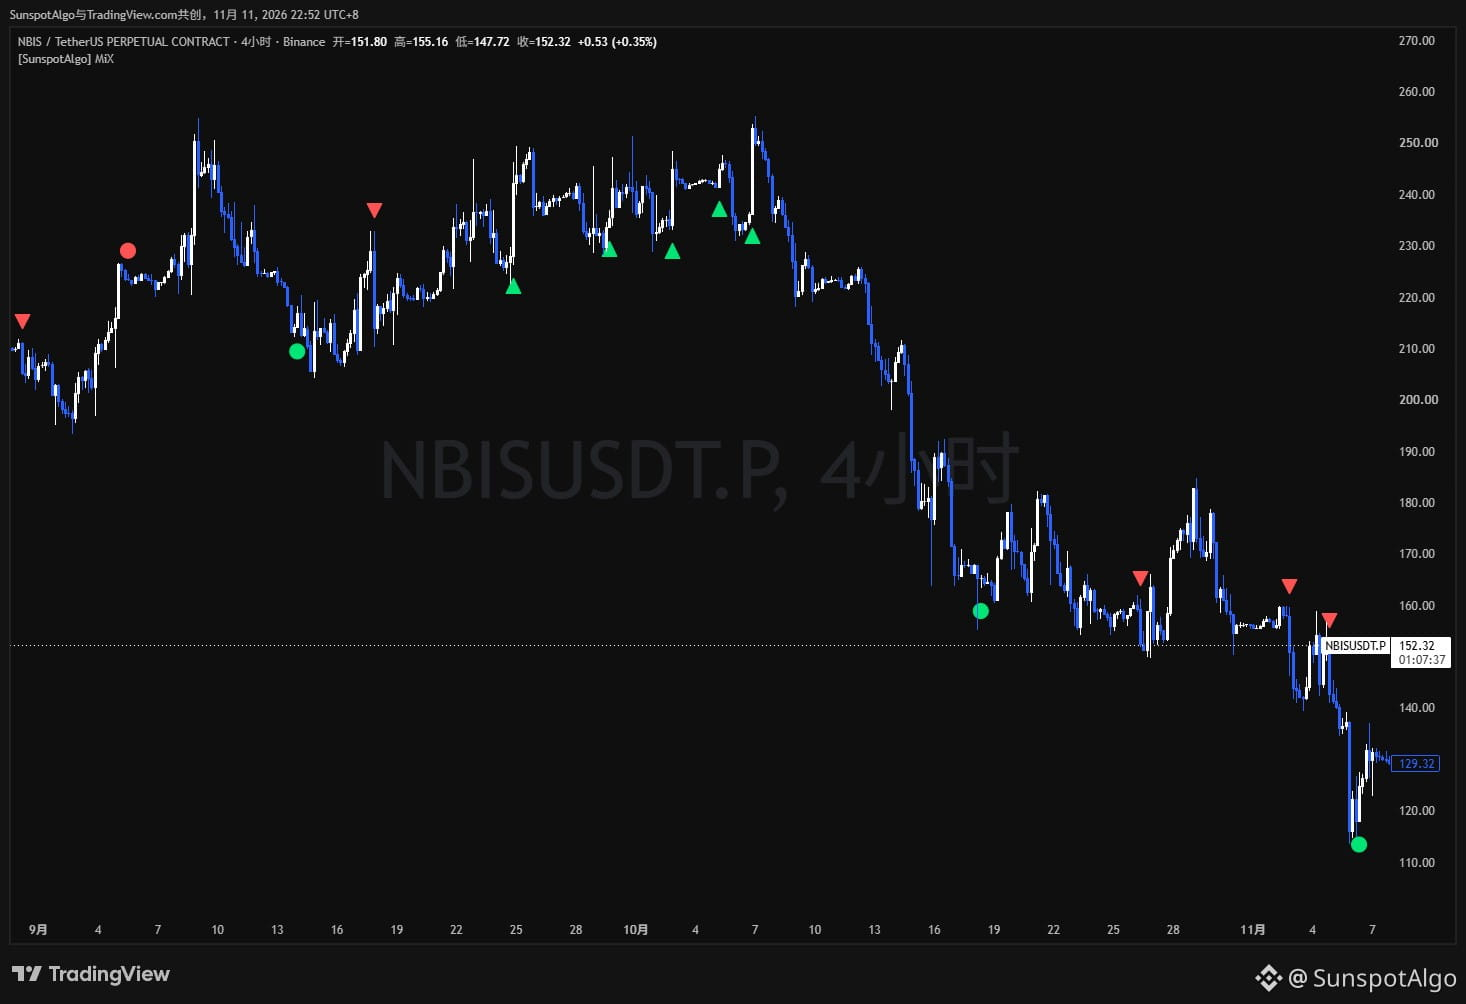
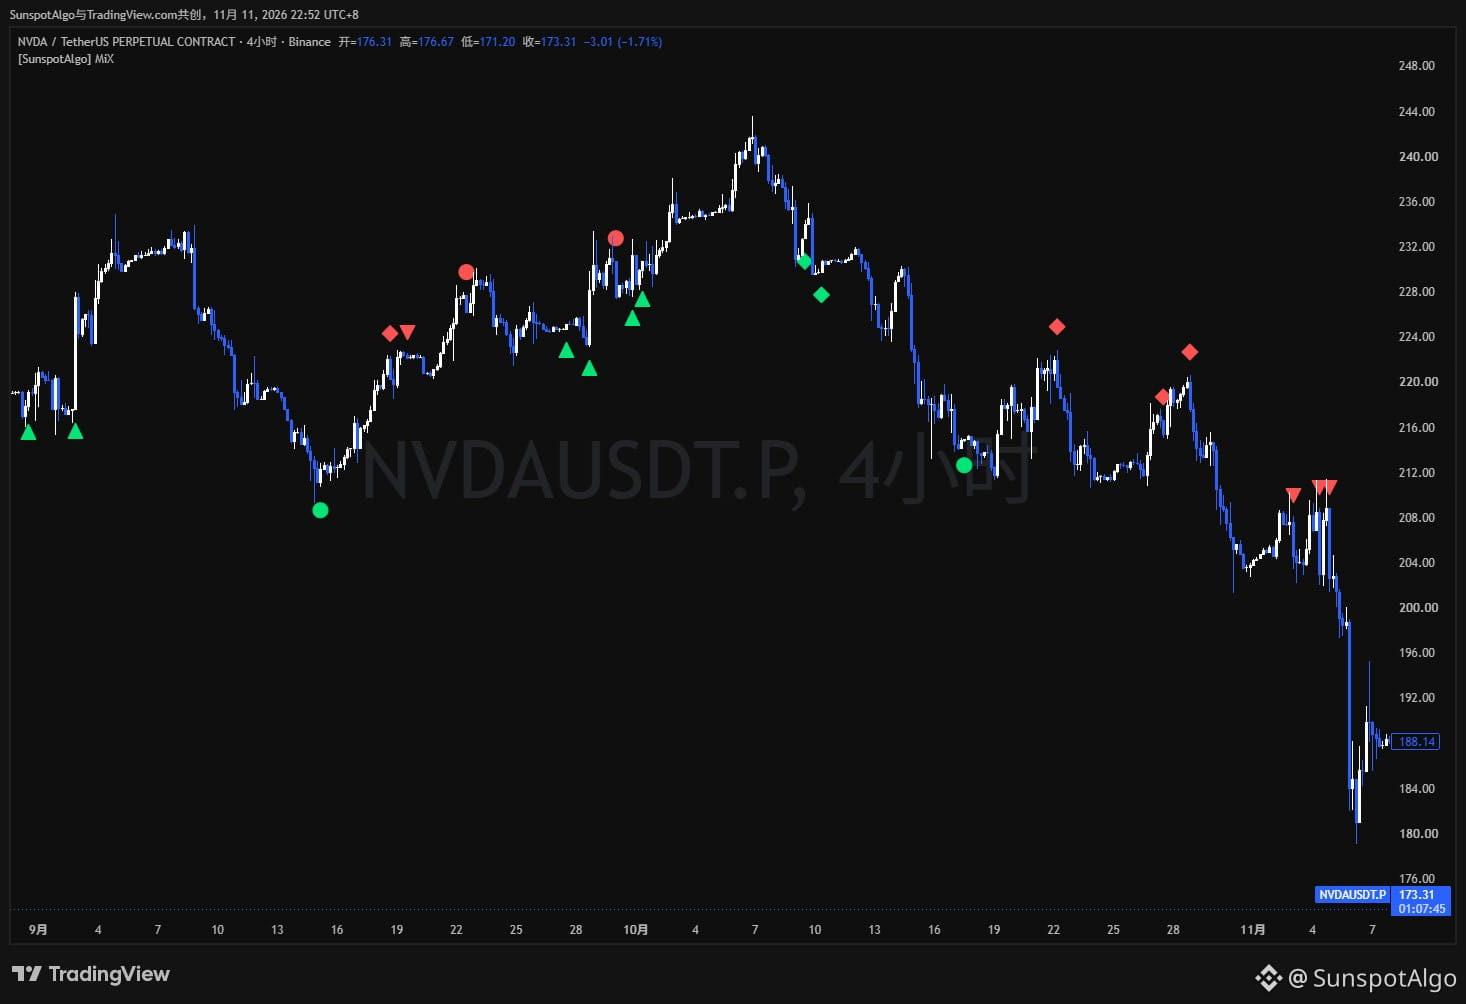
Four U.S. stocks, four different reasons for falling. But MIX doesn’t care why they fell.
Amazon: Capital expenditures are consuming cash flow
Dell: Record orders, but free cash flow down 47%
Nebius: The night before earnings
NVIDIA: A letter sparked a market reassessment
Their fundamentals are all different. MIX looks only at price.
This is the result of quantifying years of my technical analysis experience. It doesn’t read earnings reports or chase the news; it only observes market structure, momentum, and price levels.
Below are actual signals for perpetual contracts on four U.S. stocks. Most red signals appeared before declines, while green signals appeared in some cases at the bottom and in others midway through a trend. All four charts are shown as they are, with no cherry-picked perfect examples.
Signals are confirmed and locked in when the candlestick closes. No future data is used, and there is no repainting.
The data comes from U.S. stock perpetual contracts that trade 24/7, not from the underlying stocks. Continuous trading lets the indicator observe price movements after hours and on weekends, but thinly traded periods also carry risks: when liquidity is low, abnormal price spikes can cause sharp volatility. MIX identifies price structure; it does not assess order book liquidity.
MIX applies the same logic across all instruments and timeframes, with no separate parameter tuning for individual assets. When you switch timeframes, only the signal frequency changes.
Win rates and risk-reward ratios can’t be judged from a few screenshots. Put the charts back in the context of the full trend and assess them for yourself.
I usually share MIX’s 4-hour signals, and only post when there’s a signal.
——————————————
Thanks for following. You’re also welcome to share your observations and ideas in the comments. I’ll continue sharing chart records and market observations for everyone’s reference.
Four U.S. stocks, four different reasons for falling. But MIX doesn’t care why they fell.
Amazon: Capital expenditures are consuming cash flow
Dell: Record orders, but free cash flow down 47%
Nebius: The night before earnings
NVIDIA: A letter sparked a market reassessment
Their fundamentals are all different. MIX looks only at price.
This is the result of quantifying years of my technical analysis experience. It doesn’t read earnings reports or chase the news; it only observes market structure, momentum, and price levels.
Below are actual signals for perpetual contracts on four U.S. stocks. Most red signals appeared before declines, while green signals appeared in some cases at the bottom and in others midway through a trend. All four charts are shown as they are, with no cherry-picked perfect examples.
Signals are confirmed and locked in when the candlestick closes. No future data is used, and there is no repainting.
The data comes from U.S. stock perpetual contracts that trade 24/7, not from the underlying stocks. Continuous trading lets the indicator observe price movements after hours and on weekends, but thinly traded periods also carry risks: when liquidity is low, abnormal price spikes can cause sharp volatility. MIX identifies price structure; it does not assess order book liquidity.
MIX applies the same logic across all instruments and timeframes, with no separate parameter tuning for individual assets. When you switch timeframes, only the signal frequency changes.
Win rates and risk-reward ratios can’t be judged from a few screenshots. Put the charts back in the context of the full trend and assess them for yourself.
I usually share MIX’s 4-hour signals, and only post when there’s a signal.
——————————————
Thanks for following. You’re also welcome to share your observations and ideas in the comments. I’ll continue sharing chart records and market observations for everyone’s reference.
Amazon: Capital expenditures are consuming cash flow
Dell: Record orders, but free cash flow down 47%
Nebius: The night before earnings
NVIDIA: A letter sparked a market reassessment
Their fundamentals are all different. MIX looks only at price.
This is the result of quantifying years of my technical analysis experience. It doesn’t read earnings reports or chase the news; it only observes market structure, momentum, and price levels.
Below are actual signals for perpetual contracts on four U.S. stocks. Most red signals appeared before declines, while green signals appeared in some cases at the bottom and in others midway through a trend. All four charts are shown as they are, with no cherry-picked perfect examples.
Signals are confirmed and locked in when the candlestick closes. No future data is used, and there is no repainting.
The data comes from U.S. stock perpetual contracts that trade 24/7, not from the underlying stocks. Continuous trading lets the indicator observe price movements after hours and on weekends, but thinly traded periods also carry risks: when liquidity is low, abnormal price spikes can cause sharp volatility. MIX identifies price structure; it does not assess order book liquidity.
MIX applies the same logic across all instruments and timeframes, with no separate parameter tuning for individual assets. When you switch timeframes, only the signal frequency changes.
Win rates and risk-reward ratios can’t be judged from a few screenshots. Put the charts back in the context of the full trend and assess them for yourself.
I usually share MIX’s 4-hour signals, and only post when there’s a signal.
——————————————
Thanks for following. You’re also welcome to share your observations and ideas in the comments. I’ll continue sharing chart records and market observations for everyone’s reference.
2
570
PINNED
·
--
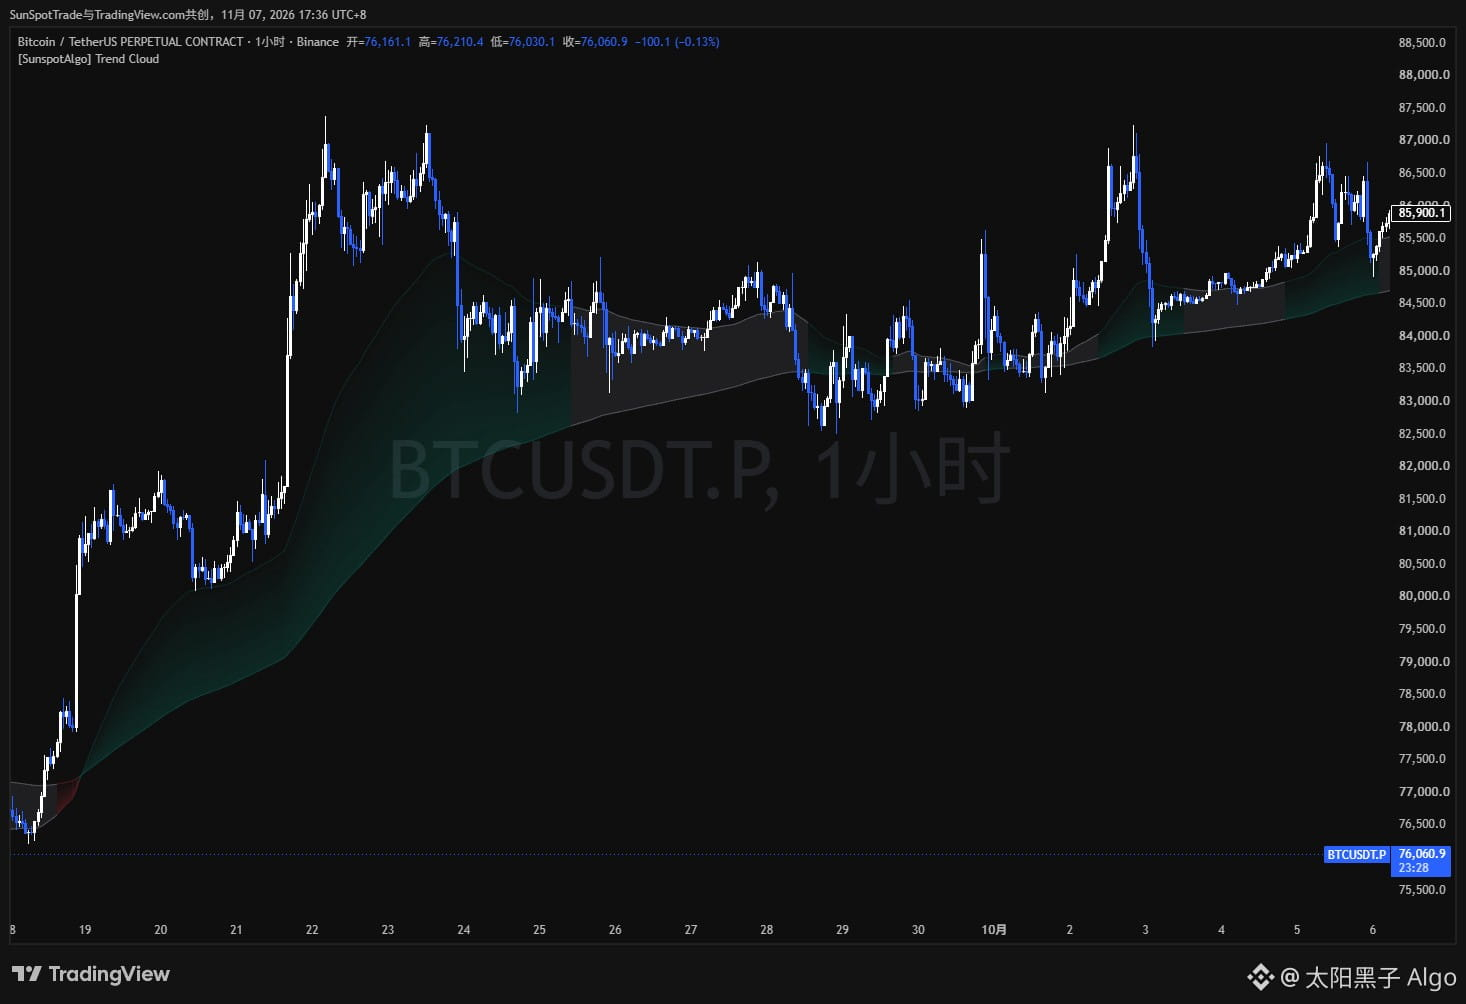
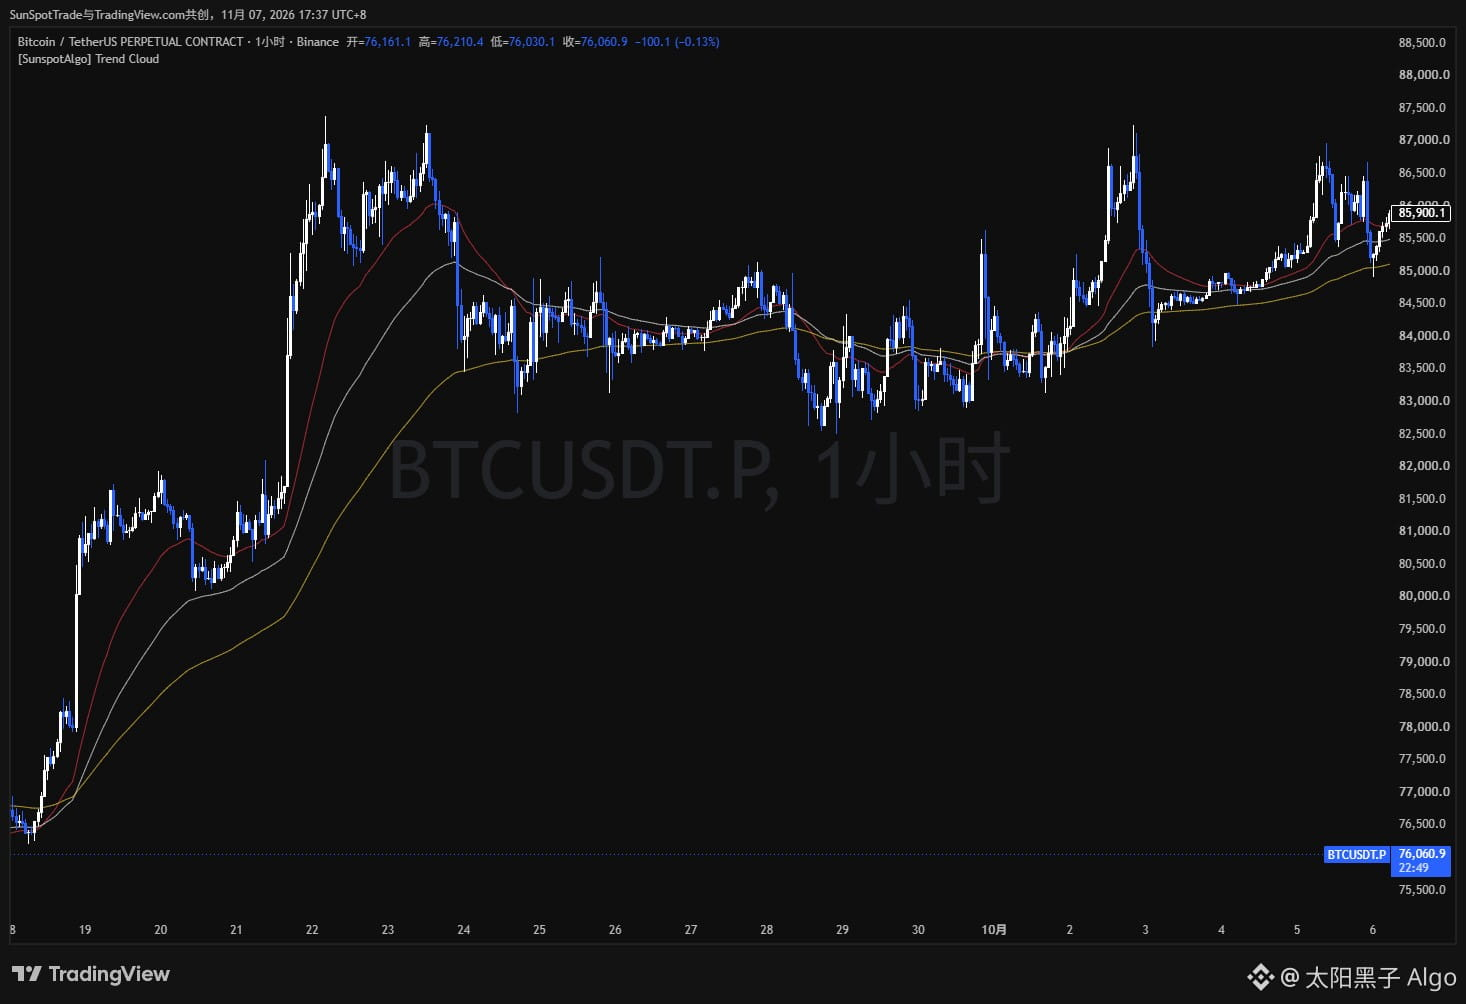
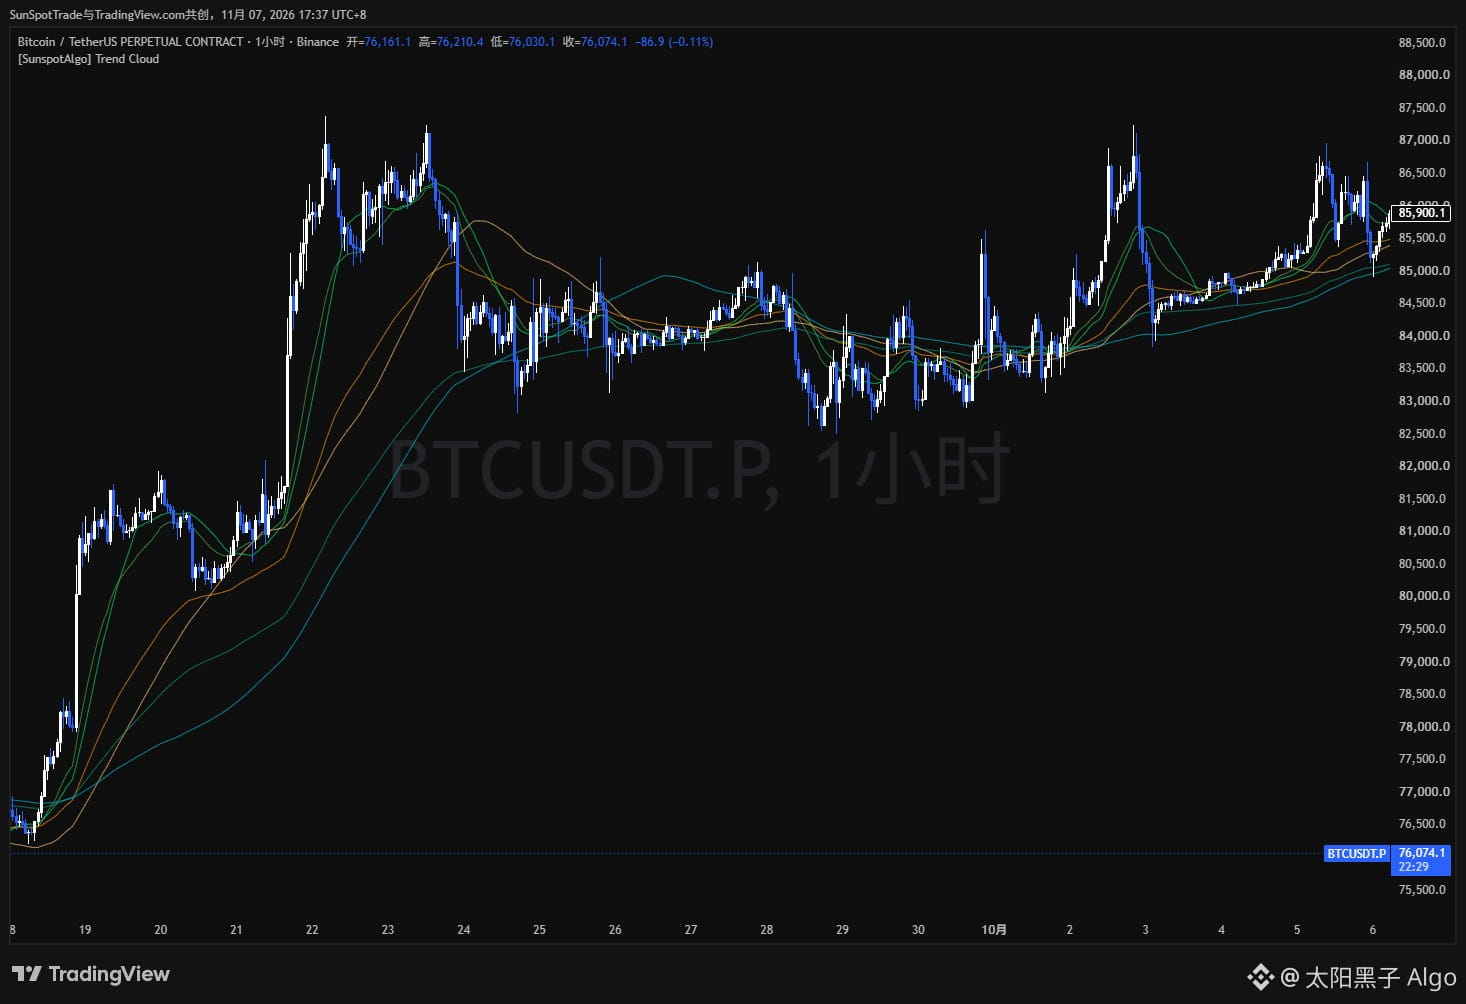
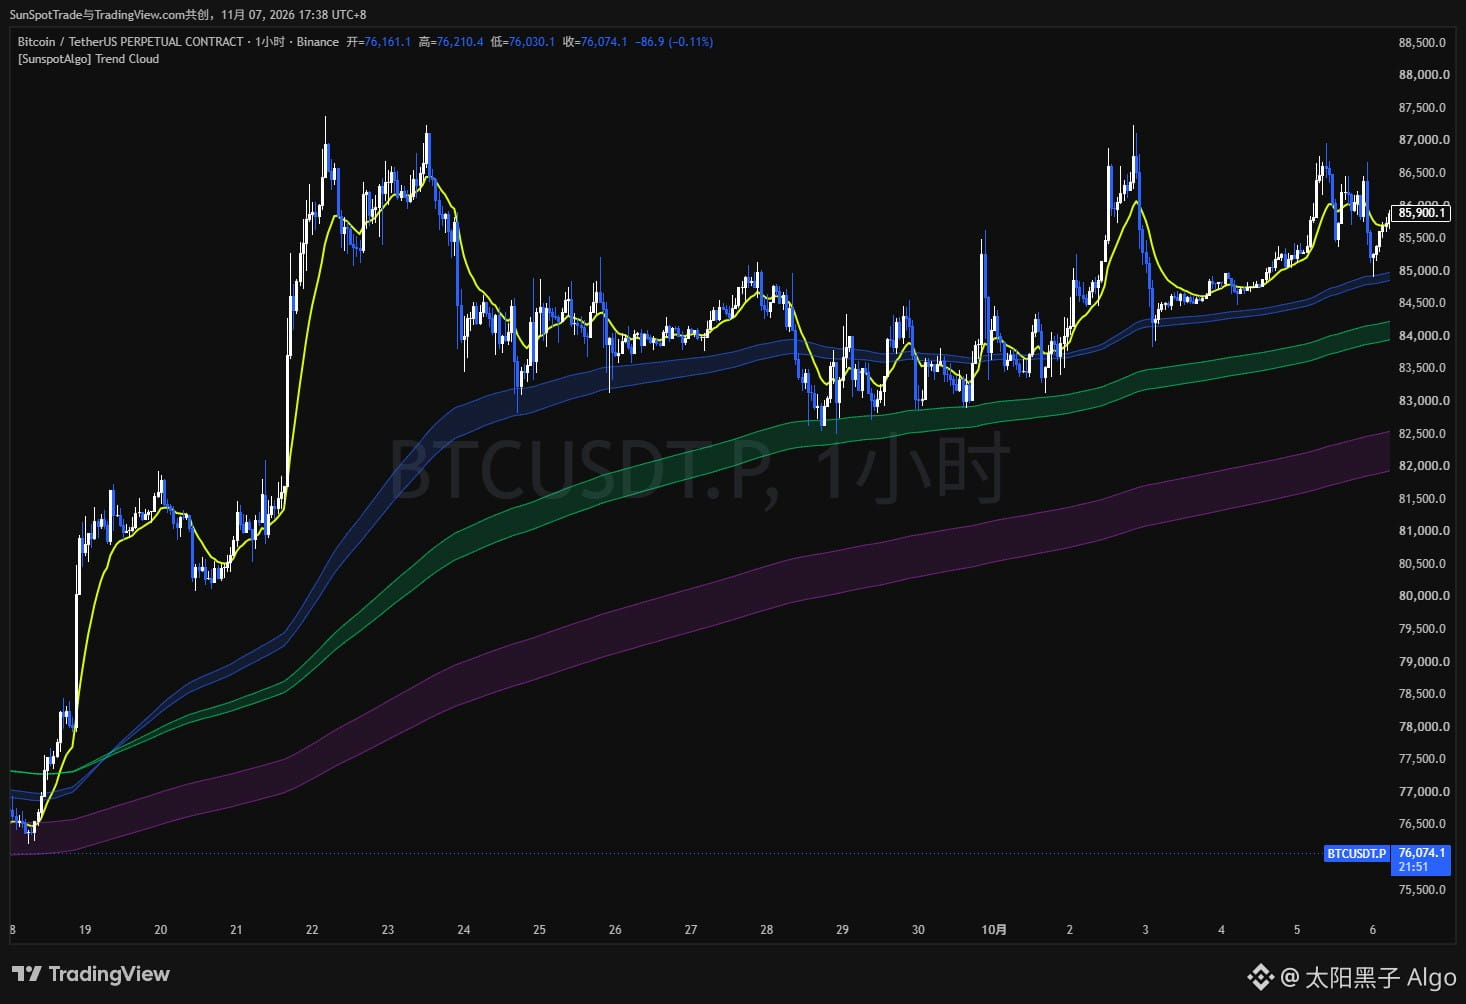
I’ve published a free indicator: Trend Cloud & MA Toolkit. It brings four moving-average setups together in one chart; Figures 1–4 show each of the four configurations.
The main cloud compares a fast and a slow moving average, set by default to EMA 55 and EMA 200. You can change both the lengths and the methods. When the fast line is above, the cloud shows a bullish color; when the slow line is above, it shows a bearish color. ADX filtering is enabled by default, with a threshold of 20. Below that threshold, the cloud turns neutral to indicate that trend strength is weak. Turn filtering off, and the cloud will reflect only the relationship between the fast and slow lines.
The three optional modules operate independently. The three-MA cluster is set by default to 30, 60, and 120, with a separate color for each. The dual-MA groups plot EMA and SMA side by side at 20, 60, and 120, making it easy to compare the two methods over the same periods. The VEGAS module is off by default. When enabled, it displays an EMA 12 filter line, along with short-term tunnels at 144 and 169, a medium-term tunnel at 288 and 338, and a long-term tunnel at 576 and 676. Each tunnel and its fill can be controlled individually.
This is a visual tool; it does not generate entry or exit signals or place orders. Moving averages and ADX are based on historical prices and lag, and performance varies across instruments and timeframes.
This indicator is public on TradingView. Its source code is protected, and you can use it by adding it directly to your chart—no application is required.
——————————————
Thanks for following! You’re also welcome to share your observations and ideas in the comments. I’ll continue sharing chart notes and market observations for your reference.
I’ve published a free indicator: Trend Cloud & MA Toolkit. It brings four moving-average setups together in one chart; Figures 1–4 show each of the four configurations.
The main cloud compares a fast and a slow moving average, set by default to EMA 55 and EMA 200. You can change both the lengths and the methods. When the fast line is above, the cloud shows a bullish color; when the slow line is above, it shows a bearish color. ADX filtering is enabled by default, with a threshold of 20. Below that threshold, the cloud turns neutral to indicate that trend strength is weak. Turn filtering off, and the cloud will reflect only the relationship between the fast and slow lines.
The three optional modules operate independently. The three-MA cluster is set by default to 30, 60, and 120, with a separate color for each. The dual-MA groups plot EMA and SMA side by side at 20, 60, and 120, making it easy to compare the two methods over the same periods. The VEGAS module is off by default. When enabled, it displays an EMA 12 filter line, along with short-term tunnels at 144 and 169, a medium-term tunnel at 288 and 338, and a long-term tunnel at 576 and 676. Each tunnel and its fill can be controlled individually.
This is a visual tool; it does not generate entry or exit signals or place orders. Moving averages and ADX are based on historical prices and lag, and performance varies across instruments and timeframes.
This indicator is public on TradingView. Its source code is protected, and you can use it by adding it directly to your chart—no application is required.
——————————————
Thanks for following! You’re also welcome to share your observations and ideas in the comments. I’ll continue sharing chart notes and market observations for your reference.
The main cloud compares a fast and a slow moving average, set by default to EMA 55 and EMA 200. You can change both the lengths and the methods. When the fast line is above, the cloud shows a bullish color; when the slow line is above, it shows a bearish color. ADX filtering is enabled by default, with a threshold of 20. Below that threshold, the cloud turns neutral to indicate that trend strength is weak. Turn filtering off, and the cloud will reflect only the relationship between the fast and slow lines.
The three optional modules operate independently. The three-MA cluster is set by default to 30, 60, and 120, with a separate color for each. The dual-MA groups plot EMA and SMA side by side at 20, 60, and 120, making it easy to compare the two methods over the same periods. The VEGAS module is off by default. When enabled, it displays an EMA 12 filter line, along with short-term tunnels at 144 and 169, a medium-term tunnel at 288 and 338, and a long-term tunnel at 576 and 676. Each tunnel and its fill can be controlled individually.
This is a visual tool; it does not generate entry or exit signals or place orders. Moving averages and ADX are based on historical prices and lag, and performance varies across instruments and timeframes.
This indicator is public on TradingView. Its source code is protected, and you can use it by adding it directly to your chart—no application is required.
——————————————
Thanks for following! You’re also welcome to share your observations and ideas in the comments. I’ll continue sharing chart notes and market observations for your reference.
1
1
146
·
--
#AAPL $AAPL 🔴 AAPL-4-hour-countertrend short
• Real-time price: 355.90
• Signal type: MIX reversal signal
• Instrument: Apple stock
Sunspot Trading Signal @ 04:00:24
#AAPL $AAPL 🔴 AAPL-4-hour-countertrend short
• Real-time price: 355.90
• Signal type: MIX reversal signal
• Instrument: Apple stock
Sunspot Trading Signal @ 04:00:24
• Real-time price: 355.90
• Signal type: MIX reversal signal
• Instrument: Apple stock
Sunspot Trading Signal @ 04:00:24
·
--
Resigned, effective immediately.
On November 12, Nvidia’s board announced that Jensen Huang had resigned as president, CEO, and board member, with CFO Colette Kress taking over on an interim basis. From news of an extramarital affair breaking last week, to reports this week that he had been involved with a company subordinate, the board launching an independent investigation, and his formal departure—it all took less than a week. The speed alone sends a signal: the board didn’t want to drag this out.
The market showed no mercy. The stock was down more than 13% at one point before the market opened and nearly 14% at the open. Its market capitalization has fallen by about $888 billion this week. Nvidia is a major component of the S&P 500 and Nasdaq. When it faces a governance crisis, it doesn’t just weigh on one stock—it shakes the anchor of the entire AI trade.
Kress, who is stepping in on an interim basis, has been Nvidia’s CFO for more than a decade and is well regarded in the industry. But the company has been founder-led from the outset, with Huang concentrating a great deal of decision-making in his own hands. Succession is therefore exceptionally difficult. The board has also appointed its first independent chair and is searching for a permanent CEO, looking both internally and externally.
I wouldn’t buy Nvidia just because it’s “fallen a lot,” and I wouldn’t short it just because the “CEO is leaving.” The initial pricing of events like this is often driven by emotion. I’ll wait for the market to separate the governance discount from the fundamental discount, then decide whether it’s worth making a move.
But one thing is certain: the central anchor of the AI narrative now needs to be found again.
#黄仁勋辞任CEO,英伟达战略走向受关注
Resigned, effective immediately.
On November 12, Nvidia’s board announced that Jensen Huang had resigned as president, CEO, and board member, with CFO Colette Kress taking over on an interim basis. From news of an extramarital affair breaking last week, to reports this week that he had been involved with a company subordinate, the board launching an independent investigation, and his formal departure—it all took less than a week. The speed alone sends a signal: the board didn’t want to drag this out.
The market showed no mercy. The stock was down more than 13% at one point before the market opened and nearly 14% at the open. Its market capitalization has fallen by about $888 billion this week. Nvidia is a major component of the S&P 500 and Nasdaq. When it faces a governance crisis, it doesn’t just weigh on one stock—it shakes the anchor of the entire AI trade.
Kress, who is stepping in on an interim basis, has been Nvidia’s CFO for more than a decade and is well regarded in the industry. But the company has been founder-led from the outset, with Huang concentrating a great deal of decision-making in his own hands. Succession is therefore exceptionally difficult. The board has also appointed its first independent chair and is searching for a permanent CEO, looking both internally and externally.
I wouldn’t buy Nvidia just because it’s “fallen a lot,” and I wouldn’t short it just because the “CEO is leaving.” The initial pricing of events like this is often driven by emotion. I’ll wait for the market to separate the governance discount from the fundamental discount, then decide whether it’s worth making a move.
But one thing is certain: the central anchor of the AI narrative now needs to be found again.
#黄仁勋辞任CEO,英伟达战略走向受关注
On November 12, Nvidia’s board announced that Jensen Huang had resigned as president, CEO, and board member, with CFO Colette Kress taking over on an interim basis. From news of an extramarital affair breaking last week, to reports this week that he had been involved with a company subordinate, the board launching an independent investigation, and his formal departure—it all took less than a week. The speed alone sends a signal: the board didn’t want to drag this out.
The market showed no mercy. The stock was down more than 13% at one point before the market opened and nearly 14% at the open. Its market capitalization has fallen by about $888 billion this week. Nvidia is a major component of the S&P 500 and Nasdaq. When it faces a governance crisis, it doesn’t just weigh on one stock—it shakes the anchor of the entire AI trade.
Kress, who is stepping in on an interim basis, has been Nvidia’s CFO for more than a decade and is well regarded in the industry. But the company has been founder-led from the outset, with Huang concentrating a great deal of decision-making in his own hands. Succession is therefore exceptionally difficult. The board has also appointed its first independent chair and is searching for a permanent CEO, looking both internally and externally.
I wouldn’t buy Nvidia just because it’s “fallen a lot,” and I wouldn’t short it just because the “CEO is leaving.” The initial pricing of events like this is often driven by emotion. I’ll wait for the market to separate the governance discount from the fundamental discount, then decide whether it’s worth making a move.
But one thing is certain: the central anchor of the AI narrative now needs to be found again.
#黄仁勋辞任CEO,英伟达战略走向受关注
206
·
--
#GOOGL $GOOGL 🔴 GOOGL-4-hour-Short with the trend
• Real-time price: 292.50
• Signal type: MIX reversal signal
• Asset information: Google stock
Sunspot Trading Signal @ 20:00:24
#GOOGL $GOOGL 🔴 GOOGL-4-hour-Short with the trend
• Real-time price: 292.50
• Signal type: MIX reversal signal
• Asset information: Google stock
Sunspot Trading Signal @ 20:00:24
• Real-time price: 292.50
• Signal type: MIX reversal signal
• Asset information: Google stock
Sunspot Trading Signal @ 20:00:24
130
·
--
🟢 EURUSD-4-hour-countertrend long
• Real-time price: 1.10947
• Signal type: MIX reversal signal
• Instrument: EUR/USD
Sunspot trading signal @ 18:01:07
🟢 EURUSD-4-hour-countertrend long
• Real-time price: 1.10947
• Signal type: MIX reversal signal
• Instrument: EUR/USD
Sunspot trading signal @ 18:01:07
• Real-time price: 1.10947
• Signal type: MIX reversal signal
• Instrument: EUR/USD
Sunspot trading signal @ 18:01:07
11
·
--
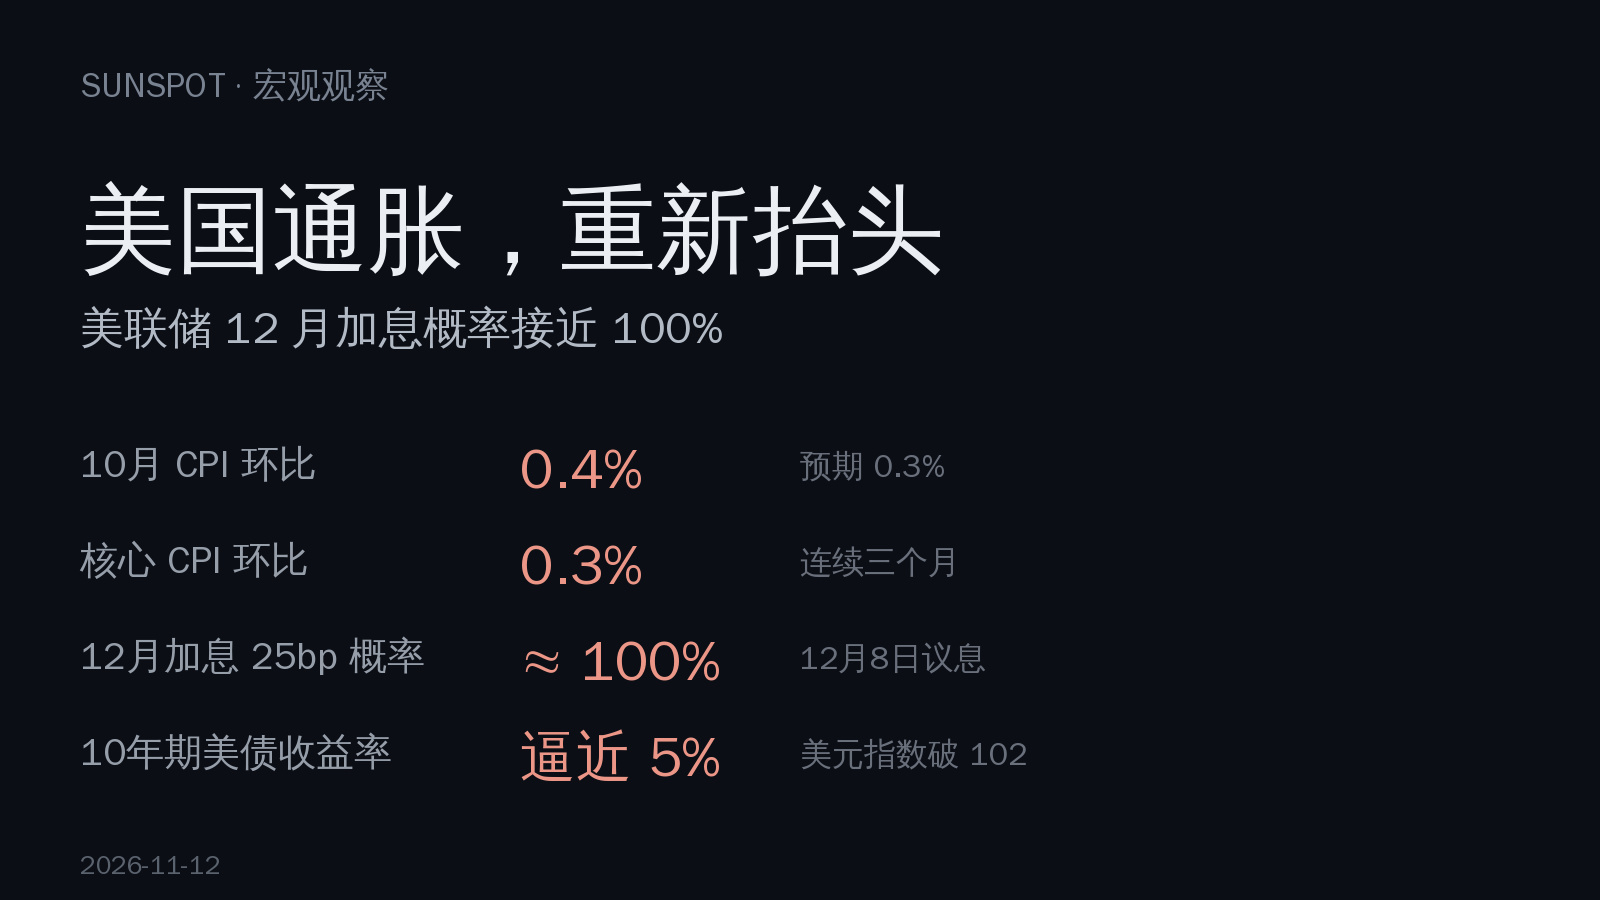
U.S. CPI rose 0.4% month over month in October, 0.1 percentage point above expectations. Core CPI rose 0.3% month over month, refusing to cool for a third consecutive month. There’s no year-over-year figure this time: the government shutdown last October distorted the base, so we can only judge by the monthly numbers. Annualized, inflation has been running above 3% over the past three months.
Housing drove prices higher, rising 0.3% month over month and accounting for more than 30% of the overall increase. Rent is sticky: once it rises, it’s hard to bring back down. Food and energy prices are also climbing.
The Fed raised rates by 25 basis points in September, the first hike since 2023. It held steady at the end of October, leaving the target range at 3.75% to 4%. The vote was 10 to 2, with two officials favoring an outright rate hike. Policymakers have made their position clear: inflation takes priority over growth.
Markets have priced in a 25-basis-point rate hike at the December 8 meeting at close to 100%. Deutsche Bank is taking an even more aggressive view, betting on three consecutive hikes in December, January, and March, pushing the range to 4.5%–4.75%.
The bond market moved first. The 2-year Treasury yield climbed to around 4.68%, the 10-year approached 5%, the dollar index broke above 102, and the S&P 500 fell at the open.
For crypto traders, this signals tightening liquidity. Valuations that rose on rate-cut expectations over the past two years now have to give back those gains. A stronger dollar and higher real interest rates make risk-free returns more attractive, weighing on risk appetite for Bitcoin and altcoins.
Don’t bet against a Fed that’s worried about inflation. Until there’s a clear turning point in sticky components like rent, the window for rate hikes will remain open.
——————————————
Thanks for following, and feel free to share your observations and ideas in the comments. I’ll continue sharing chart notes and market observations for your reference.
U.S. CPI rose 0.4% month over month in October, 0.1 percentage point above expectations. Core CPI rose 0.3% month over month, refusing to cool for a third consecutive month. There’s no year-over-year figure this time: the government shutdown last October distorted the base, so we can only judge by the monthly numbers. Annualized, inflation has been running above 3% over the past three months.
Housing drove prices higher, rising 0.3% month over month and accounting for more than 30% of the overall increase. Rent is sticky: once it rises, it’s hard to bring back down. Food and energy prices are also climbing.
The Fed raised rates by 25 basis points in September, the first hike since 2023. It held steady at the end of October, leaving the target range at 3.75% to 4%. The vote was 10 to 2, with two officials favoring an outright rate hike. Policymakers have made their position clear: inflation takes priority over growth.
Markets have priced in a 25-basis-point rate hike at the December 8 meeting at close to 100%. Deutsche Bank is taking an even more aggressive view, betting on three consecutive hikes in December, January, and March, pushing the range to 4.5%–4.75%.
The bond market moved first. The 2-year Treasury yield climbed to around 4.68%, the 10-year approached 5%, the dollar index broke above 102, and the S&P 500 fell at the open.
For crypto traders, this signals tightening liquidity. Valuations that rose on rate-cut expectations over the past two years now have to give back those gains. A stronger dollar and higher real interest rates make risk-free returns more attractive, weighing on risk appetite for Bitcoin and altcoins.
Don’t bet against a Fed that’s worried about inflation. Until there’s a clear turning point in sticky components like rent, the window for rate hikes will remain open.
——————————————
Thanks for following, and feel free to share your observations and ideas in the comments. I’ll continue sharing chart notes and market observations for your reference.
Housing drove prices higher, rising 0.3% month over month and accounting for more than 30% of the overall increase. Rent is sticky: once it rises, it’s hard to bring back down. Food and energy prices are also climbing.
The Fed raised rates by 25 basis points in September, the first hike since 2023. It held steady at the end of October, leaving the target range at 3.75% to 4%. The vote was 10 to 2, with two officials favoring an outright rate hike. Policymakers have made their position clear: inflation takes priority over growth.
Markets have priced in a 25-basis-point rate hike at the December 8 meeting at close to 100%. Deutsche Bank is taking an even more aggressive view, betting on three consecutive hikes in December, January, and March, pushing the range to 4.5%–4.75%.
The bond market moved first. The 2-year Treasury yield climbed to around 4.68%, the 10-year approached 5%, the dollar index broke above 102, and the S&P 500 fell at the open.
For crypto traders, this signals tightening liquidity. Valuations that rose on rate-cut expectations over the past two years now have to give back those gains. A stronger dollar and higher real interest rates make risk-free returns more attractive, weighing on risk appetite for Bitcoin and altcoins.
Don’t bet against a Fed that’s worried about inflation. Until there’s a clear turning point in sticky components like rent, the window for rate hikes will remain open.
——————————————
Thanks for following, and feel free to share your observations and ideas in the comments. I’ll continue sharing chart notes and market observations for your reference.
77
·
--
Don’t be fooled by the market action right now. This bull run is essentially an “artificial bull market,” driven by Trump’s calls to buy and market makers pumping prices. Crypto moguls played a huge role in getting Trump into office, and the pump was all about winning votes in the midterms and delivering on promises. Now they’ve lost both chambers, and those expectations have fallen flat. More dangerously, if the Democrats take full control, they’ll very likely come after the crypto industry.
The market isn’t holding up because it’s resilient—it’s because a handful of shady market makers are controlling it (just look at last week’s 11% short liquidation in Ethereum). This is a manipulated bull market, not a natural one. The cycle has run its course; it’s time for the market to break down. I got mocked across the internet after being stopped out of a short at the absolute bottom for a loss of 300,000, then used the same logic and entry point to make a million back. The point is, all it needed was a catalyst for a drop. Now that the catalyst has arrived, I’m simply going with the trend and cashing in.
Don’t be fooled by the market action right now. This bull run is essentially an “artificial bull market,” driven by Trump’s calls to buy and market makers pumping prices. Crypto moguls played a huge role in getting Trump into office, and the pump was all about winning votes in the midterms and delivering on promises. Now they’ve lost both chambers, and those expectations have fallen flat. More dangerously, if the Democrats take full control, they’ll very likely come after the crypto industry.
The market isn’t holding up because it’s resilient—it’s because a handful of shady market makers are controlling it (just look at last week’s 11% short liquidation in Ethereum). This is a manipulated bull market, not a natural one. The cycle has run its course; it’s time for the market to break down. I got mocked across the internet after being stopped out of a short at the absolute bottom for a loss of 300,000, then used the same logic and entry point to make a million back. The point is, all it needed was a catalyst for a drop. Now that the catalyst has arrived, I’m simply going with the trend and cashing in.
The market isn’t holding up because it’s resilient—it’s because a handful of shady market makers are controlling it (just look at last week’s 11% short liquidation in Ethereum). This is a manipulated bull market, not a natural one. The cycle has run its course; it’s time for the market to break down. I got mocked across the internet after being stopped out of a short at the absolute bottom for a loss of 300,000, then used the same logic and entry point to make a million back. The point is, all it needed was a catalyst for a drop. Now that the catalyst has arrived, I’m simply going with the trend and cashing in.
286
·
--
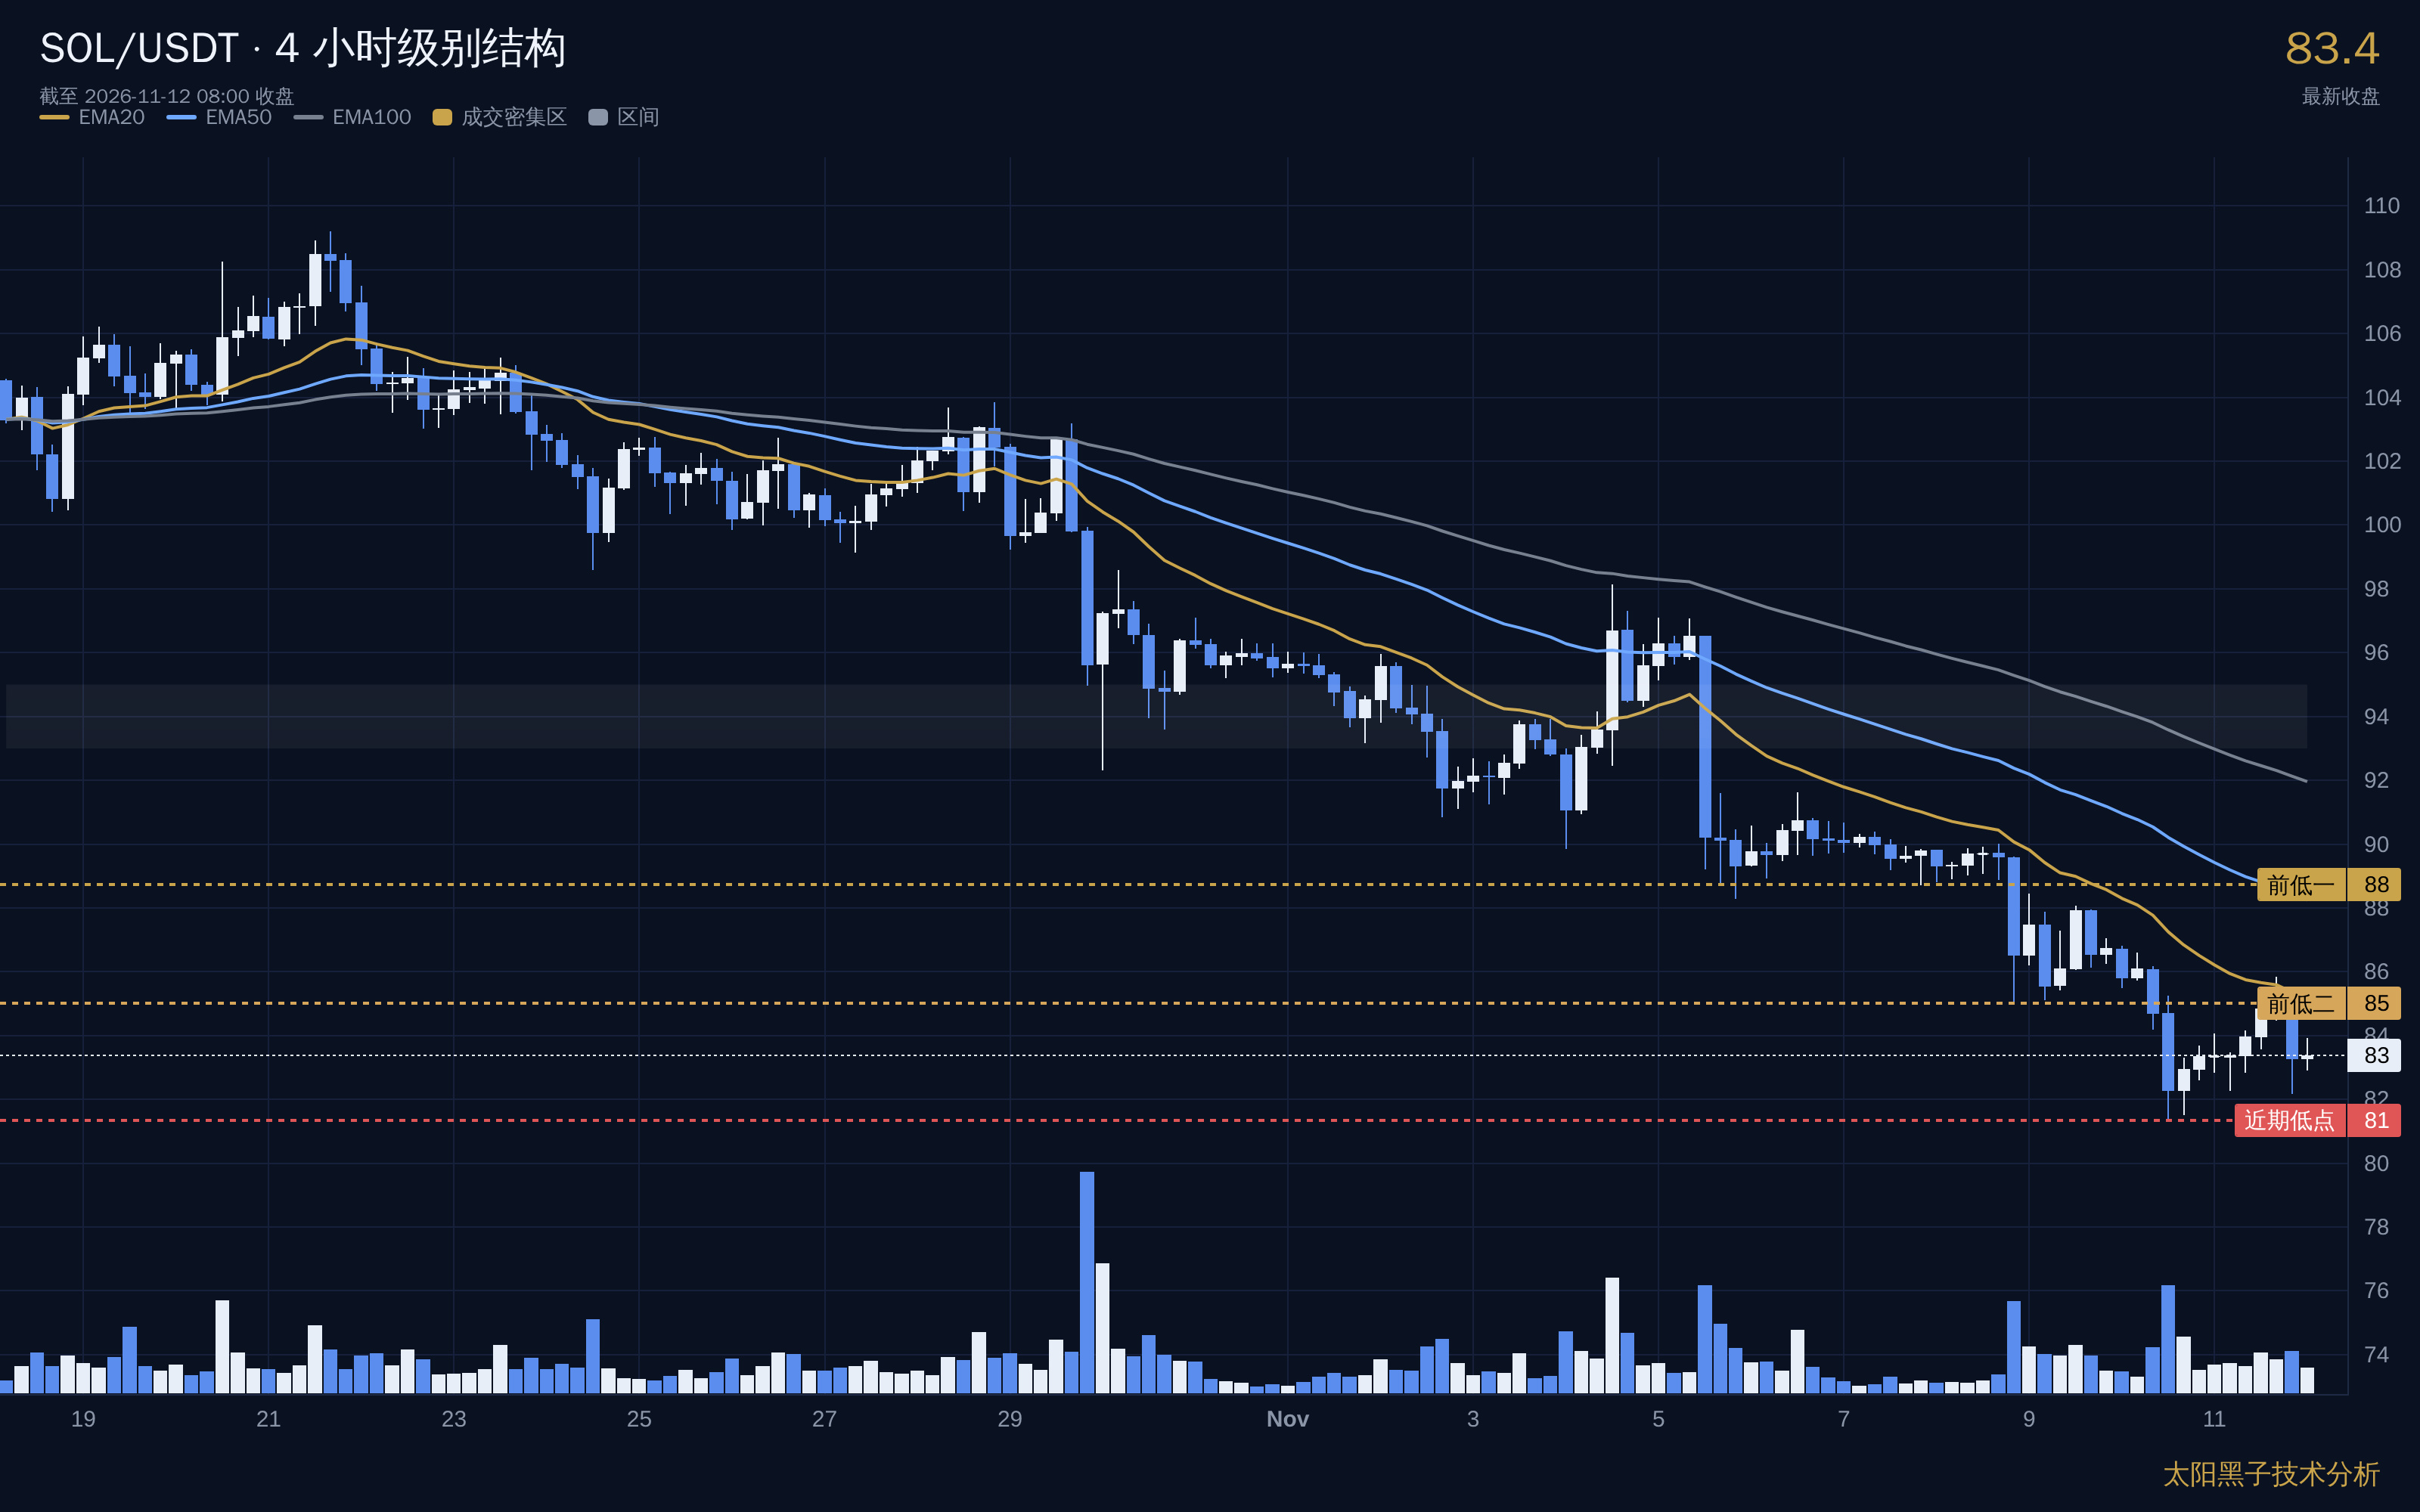
$SOL SOL 4-hour chart—let’s first establish where we are.
The September high was around 124. We’re now at 83, down more than 30%. It wasn’t a single straight drop; the price moved down step by step.
Look at the three lows: 88.73 on November 8, 85.02 on the 9th, and 81.34 on the 10th. Each one is lower than the last, and every bounce in between failed to reclaim the previous low. This is a textbook downtrend structure. Price is still below the 20-period moving average, and the 20, 50, and 100 moving averages are stacked from top to bottom—the bearish alignment remains intact.
Now, let’s talk about where we are right now.
The 81–85 range is where the last few candlesticks have been grinding. After dropping to 81.34 on the 10th, the price hasn’t continued lower or bounced back—it has just moved sideways. Below, trading volume is thin: between the current price and the older volume area, there isn’t much volume to provide support. Above, there’s real resistance: the 93–95 area was a high-volume zone in September, leaving a lot of holders underwater.
So there’s a contradiction here: the structure is bearish, and the trend is still down, but the selling momentum is fading. Since November 9, volume has been shrinking day by day. The volume on the November 10 drop to 81.34 was even lower than the average of the previous few days. The price is struggling to fall further, but that doesn’t mean it’s about to rise—it just means the downward pressure is easing.
I can’t call this a bottom yet. There’s no convincing reversal signal on the 4-hour chart. What I can say is that this is a level to watch: either price holds above 81 and then climbs back above 85 on increased volume, reclaiming that previous low—that would be the first convincing sign that the decline is stabilizing—or it breaks below 81, in which case the vacuum zone below will probably get filled.
Let’s see how the 4-hour candle closes before saying more.
——————————————
Thanks for following, and feel free to share your observations and thoughts in the comments. I’ll continue sharing chart notes and market observations for reference.
$SOL SOL 4-hour chart—let’s first establish where we are.
The September high was around 124. We’re now at 83, down more than 30%. It wasn’t a single straight drop; the price moved down step by step.
Look at the three lows: 88.73 on November 8, 85.02 on the 9th, and 81.34 on the 10th. Each one is lower than the last, and every bounce in between failed to reclaim the previous low. This is a textbook downtrend structure. Price is still below the 20-period moving average, and the 20, 50, and 100 moving averages are stacked from top to bottom—the bearish alignment remains intact.
Now, let’s talk about where we are right now.
The 81–85 range is where the last few candlesticks have been grinding. After dropping to 81.34 on the 10th, the price hasn’t continued lower or bounced back—it has just moved sideways. Below, trading volume is thin: between the current price and the older volume area, there isn’t much volume to provide support. Above, there’s real resistance: the 93–95 area was a high-volume zone in September, leaving a lot of holders underwater.
So there’s a contradiction here: the structure is bearish, and the trend is still down, but the selling momentum is fading. Since November 9, volume has been shrinking day by day. The volume on the November 10 drop to 81.34 was even lower than the average of the previous few days. The price is struggling to fall further, but that doesn’t mean it’s about to rise—it just means the downward pressure is easing.
I can’t call this a bottom yet. There’s no convincing reversal signal on the 4-hour chart. What I can say is that this is a level to watch: either price holds above 81 and then climbs back above 85 on increased volume, reclaiming that previous low—that would be the first convincing sign that the decline is stabilizing—or it breaks below 81, in which case the vacuum zone below will probably get filled.
Let’s see how the 4-hour candle closes before saying more.
——————————————
Thanks for following, and feel free to share your observations and thoughts in the comments. I’ll continue sharing chart notes and market observations for reference.
The September high was around 124. We’re now at 83, down more than 30%. It wasn’t a single straight drop; the price moved down step by step.
Look at the three lows: 88.73 on November 8, 85.02 on the 9th, and 81.34 on the 10th. Each one is lower than the last, and every bounce in between failed to reclaim the previous low. This is a textbook downtrend structure. Price is still below the 20-period moving average, and the 20, 50, and 100 moving averages are stacked from top to bottom—the bearish alignment remains intact.
Now, let’s talk about where we are right now.
The 81–85 range is where the last few candlesticks have been grinding. After dropping to 81.34 on the 10th, the price hasn’t continued lower or bounced back—it has just moved sideways. Below, trading volume is thin: between the current price and the older volume area, there isn’t much volume to provide support. Above, there’s real resistance: the 93–95 area was a high-volume zone in September, leaving a lot of holders underwater.
So there’s a contradiction here: the structure is bearish, and the trend is still down, but the selling momentum is fading. Since November 9, volume has been shrinking day by day. The volume on the November 10 drop to 81.34 was even lower than the average of the previous few days. The price is struggling to fall further, but that doesn’t mean it’s about to rise—it just means the downward pressure is easing.
I can’t call this a bottom yet. There’s no convincing reversal signal on the 4-hour chart. What I can say is that this is a level to watch: either price holds above 81 and then climbs back above 85 on increased volume, reclaiming that previous low—that would be the first convincing sign that the decline is stabilizing—or it breaks below 81, in which case the vacuum zone below will probably get filled.
Let’s see how the 4-hour candle closes before saying more.
——————————————
Thanks for following, and feel free to share your observations and thoughts in the comments. I’ll continue sharing chart notes and market observations for reference.
114
·
--
#BTC走势分析 $BTC To see whether a trend indicator is worth using over the long term, I first check one rather dull thing: once a candlestick closes, does it change the position of a signal it drew earlier?
Some tools display a signal before a candlestick has finished forming. Then, after the close, a price change can move the marker or make the whole thing disappear. It feels very responsive in real time, but when you look back at the chart, the signal you saw at the time is nowhere to be found. Getting in a little earlier isn’t a problem in itself, but once signals get revised, you can’t use the historical record to test your decisions.
When visualizing trends, I use the opposite standard: I’d rather have a signal settle a little later, and then stay put. The trade-off is missing the very beginning of a move and not catching sharp reversals—and I accept that. In return, when I look back at the chart later, the marked positions are the same ones I saw at the time. If I was wrong, I can pinpoint where things went off track; if I was right, I can see which condition was met first.
In practice, I only let the indicator mark structures that have already formed. It doesn’t get to decide how the next candlestick will close. The more frequently it fires while the market is moving, the fewer signals tend to remain after the close. That kind of responsiveness doesn’t help with reviewing trades.
It’s easy to check: pick any old stretch of BTC price action and compare the chart from then with the chart now. See whether the signal positions have changed. If they have, take everything said afterward about the price action with a grain of salt.
#BTC走势分析 $BTC To see whether a trend indicator is worth using over the long term, I first check one rather dull thing: once a candlestick closes, does it change the position of a signal it drew earlier?
Some tools display a signal before a candlestick has finished forming. Then, after the close, a price change can move the marker or make the whole thing disappear. It feels very responsive in real time, but when you look back at the chart, the signal you saw at the time is nowhere to be found. Getting in a little earlier isn’t a problem in itself, but once signals get revised, you can’t use the historical record to test your decisions.
When visualizing trends, I use the opposite standard: I’d rather have a signal settle a little later, and then stay put. The trade-off is missing the very beginning of a move and not catching sharp reversals—and I accept that. In return, when I look back at the chart later, the marked positions are the same ones I saw at the time. If I was wrong, I can pinpoint where things went off track; if I was right, I can see which condition was met first.
In practice, I only let the indicator mark structures that have already formed. It doesn’t get to decide how the next candlestick will close. The more frequently it fires while the market is moving, the fewer signals tend to remain after the close. That kind of responsiveness doesn’t help with reviewing trades.
It’s easy to check: pick any old stretch of BTC price action and compare the chart from then with the chart now. See whether the signal positions have changed. If they have, take everything said afterward about the price action with a grain of salt.
Some tools display a signal before a candlestick has finished forming. Then, after the close, a price change can move the marker or make the whole thing disappear. It feels very responsive in real time, but when you look back at the chart, the signal you saw at the time is nowhere to be found. Getting in a little earlier isn’t a problem in itself, but once signals get revised, you can’t use the historical record to test your decisions.
When visualizing trends, I use the opposite standard: I’d rather have a signal settle a little later, and then stay put. The trade-off is missing the very beginning of a move and not catching sharp reversals—and I accept that. In return, when I look back at the chart later, the marked positions are the same ones I saw at the time. If I was wrong, I can pinpoint where things went off track; if I was right, I can see which condition was met first.
In practice, I only let the indicator mark structures that have already formed. It doesn’t get to decide how the next candlestick will close. The more frequently it fires while the market is moving, the fewer signals tend to remain after the close. That kind of responsiveness doesn’t help with reviewing trades.
It’s easy to check: pick any old stretch of BTC price action and compare the chart from then with the chart now. See whether the signal positions have changed. If they have, take everything said afterward about the price action with a grain of salt.
63
·
--
#BTC走势分析 $BTC BTC has rebounded from its lows over the past two days, with the price returning to the vicinity of its previous trading range. I didn’t look at the price first; I started by reviewing liquidation and position data from the past few days.
The positions that were closed out were mainly on the sell side. After forced liquidations, those positions had to be bought back, and that buying pushed the price up. At the same time, open interest has been declining, spot ETFs have seen net outflows for several consecutive days, and the stablecoin supply has also been shrinking. Taken together, I’d rather record this as a clearing of positions; demand hasn’t taken over yet.
I haven’t changed my original view on the direction. To change it, I’d need to see two things happen together: spot ETFs stop seeing net outflows, and trading volume expand as the price recovers. I haven’t seen either yet, so for now I’ll just note that this was a short-covering rally and won’t rush to call it something else.
I’m still watching the spot market. How far leverage has retreated matters less; it only shows that the crowded positions from the previous stretch have unwound, not whether new money is coming in.
#BTC走势分析 $BTC BTC has rebounded from its lows over the past two days, with the price returning to the vicinity of its previous trading range. I didn’t look at the price first; I started by reviewing liquidation and position data from the past few days.
The positions that were closed out were mainly on the sell side. After forced liquidations, those positions had to be bought back, and that buying pushed the price up. At the same time, open interest has been declining, spot ETFs have seen net outflows for several consecutive days, and the stablecoin supply has also been shrinking. Taken together, I’d rather record this as a clearing of positions; demand hasn’t taken over yet.
I haven’t changed my original view on the direction. To change it, I’d need to see two things happen together: spot ETFs stop seeing net outflows, and trading volume expand as the price recovers. I haven’t seen either yet, so for now I’ll just note that this was a short-covering rally and won’t rush to call it something else.
I’m still watching the spot market. How far leverage has retreated matters less; it only shows that the crowded positions from the previous stretch have unwound, not whether new money is coming in.
The positions that were closed out were mainly on the sell side. After forced liquidations, those positions had to be bought back, and that buying pushed the price up. At the same time, open interest has been declining, spot ETFs have seen net outflows for several consecutive days, and the stablecoin supply has also been shrinking. Taken together, I’d rather record this as a clearing of positions; demand hasn’t taken over yet.
I haven’t changed my original view on the direction. To change it, I’d need to see two things happen together: spot ETFs stop seeing net outflows, and trading volume expand as the price recovers. I haven’t seen either yet, so for now I’ll just note that this was a short-covering rally and won’t rush to call it something else.
I’m still watching the spot market. How far leverage has retreated matters less; it only shows that the crowded positions from the previous stretch have unwound, not whether new money is coming in.
128
·
--
#BTC走势分析 $BTC Market commentary reads smoothly these days. It has all the background, reasoning, and conclusions you could want, with not a single awkward turn of phrase. Yet once you put it down, you can't say what you actually remember.
I don't think the writing has gotten worse. Quite the opposite: generating a decent analysis has become so cheap that simply having “a piece of commentary” is no longer valuable in itself. It used to take time to clearly describe a market move, and that time acted as a filter. Now the filter is gone, supply has exploded, and fluency has become the least scarce thing of all.
The problem is that fluency and usefulness look so much alike. When the cause-and-effect story hangs together, readers are inclined to believe it without asking what the judgment is based on. What really sets analyses apart is what can be checked later: which part of the price action informed the view at the time, which claim turned out to be wrong, and under what conditions the judgment changed. These details don't make for pretty reading, but they determine whether you can avoid repeating the same mistake next time.
This is especially clear when it comes to predicting BTC's price movements. Before the direction becomes clear, you can make a complete and convincing case for either side. But once the move has played out, what tends to retain its value isn't the smoothest explanation—it's the analysis that clearly stated in advance, “If this doesn't hold, I'll admit I was wrong.”
So I've adopted a simple, if clumsy, rule: when I read an analysis, I first ask whether it gives me grounds that could be disproved. If not, I treat it as a tidy story and leave it out of my decisions. I'll keep using the tools; I just won't mistake smooth writing for evidence of sound judgment.
#BTC走势分析 $BTC Market commentary reads smoothly these days. It has all the background, reasoning, and conclusions you could want, with not a single awkward turn of phrase. Yet once you put it down, you can't say what you actually remember.
I don't think the writing has gotten worse. Quite the opposite: generating a decent analysis has become so cheap that simply having “a piece of commentary” is no longer valuable in itself. It used to take time to clearly describe a market move, and that time acted as a filter. Now the filter is gone, supply has exploded, and fluency has become the least scarce thing of all.
The problem is that fluency and usefulness look so much alike. When the cause-and-effect story hangs together, readers are inclined to believe it without asking what the judgment is based on. What really sets analyses apart is what can be checked later: which part of the price action informed the view at the time, which claim turned out to be wrong, and under what conditions the judgment changed. These details don't make for pretty reading, but they determine whether you can avoid repeating the same mistake next time.
This is especially clear when it comes to predicting BTC's price movements. Before the direction becomes clear, you can make a complete and convincing case for either side. But once the move has played out, what tends to retain its value isn't the smoothest explanation—it's the analysis that clearly stated in advance, “If this doesn't hold, I'll admit I was wrong.”
So I've adopted a simple, if clumsy, rule: when I read an analysis, I first ask whether it gives me grounds that could be disproved. If not, I treat it as a tidy story and leave it out of my decisions. I'll keep using the tools; I just won't mistake smooth writing for evidence of sound judgment.
I don't think the writing has gotten worse. Quite the opposite: generating a decent analysis has become so cheap that simply having “a piece of commentary” is no longer valuable in itself. It used to take time to clearly describe a market move, and that time acted as a filter. Now the filter is gone, supply has exploded, and fluency has become the least scarce thing of all.
The problem is that fluency and usefulness look so much alike. When the cause-and-effect story hangs together, readers are inclined to believe it without asking what the judgment is based on. What really sets analyses apart is what can be checked later: which part of the price action informed the view at the time, which claim turned out to be wrong, and under what conditions the judgment changed. These details don't make for pretty reading, but they determine whether you can avoid repeating the same mistake next time.
This is especially clear when it comes to predicting BTC's price movements. Before the direction becomes clear, you can make a complete and convincing case for either side. But once the move has played out, what tends to retain its value isn't the smoothest explanation—it's the analysis that clearly stated in advance, “If this doesn't hold, I'll admit I was wrong.”
So I've adopted a simple, if clumsy, rule: when I read an analysis, I first ask whether it gives me grounds that could be disproved. If not, I treat it as a tidy story and leave it out of my decisions. I'll keep using the tools; I just won't mistake smooth writing for evidence of sound judgment.
83
·
--
🔴 USDCHF-4-hour-trend-following short
• Live price: 0.83229
• Signal type: MIX reversal signal
• Instrument: US dollar/Swiss franc
Sunspot Trading Signal @ 10:01:07
🔴 USDCHF-4-hour-trend-following short
• Live price: 0.83229
• Signal type: MIX reversal signal
• Instrument: US dollar/Swiss franc
Sunspot Trading Signal @ 10:01:07
• Live price: 0.83229
• Signal type: MIX reversal signal
• Instrument: US dollar/Swiss franc
Sunspot Trading Signal @ 10:01:07
36
·
--
#BTC走势分析 $BTC Many people envy the freedom of trading full-time. I used to think that way too. It wasn’t until I actually did it that I realized “freedom” is too broad a word. It’s more like completely changing the way you work, along with all the things that come with it.
The freedom people imagine is mostly being in control of your own time and going wherever you want. In reality, a different set of things changes: no commute, no meetings, no colleagues, and no act of “clocking off.” Without those boundaries, your days lose their natural dividing lines. Morning and evening blur together, and before you know it, it’s dark.
For a while, I noticed that the number of times I actually spoke out loud in a day could be absurdly low. Those little opportunities to chat along the way or add a comment in a meeting were all gone. By the time I realized it, my first words of the day were often to place a food delivery order. This has nothing to do with being free or not; it’s simply what this kind of work looks like.
The market is the same. When BTC is moving sideways and the direction is unclear, I’d rather admit that I can’t read anything from it right now and note my take on the price action as “no conclusion” than force myself to come up with a view. The least useful time to analyze a trend is often when you insist on getting an answer out of it. Set it aside and come back to it a few days later to see what you missed at the time—that’s more reliable than making up a direction on the spot.
So these days, I don’t really use “freedom” to describe this line of work. It’s more like a job where you have to reorganize your schedule, social life, and emotions all over again, with benefits and costs coming together. You set your own pace, and no one else is there to tell you to stop.
#BTC走势分析 $BTC Many people envy the freedom of trading full-time. I used to think that way too. It wasn’t until I actually did it that I realized “freedom” is too broad a word. It’s more like completely changing the way you work, along with all the things that come with it.
The freedom people imagine is mostly being in control of your own time and going wherever you want. In reality, a different set of things changes: no commute, no meetings, no colleagues, and no act of “clocking off.” Without those boundaries, your days lose their natural dividing lines. Morning and evening blur together, and before you know it, it’s dark.
For a while, I noticed that the number of times I actually spoke out loud in a day could be absurdly low. Those little opportunities to chat along the way or add a comment in a meeting were all gone. By the time I realized it, my first words of the day were often to place a food delivery order. This has nothing to do with being free or not; it’s simply what this kind of work looks like.
The market is the same. When BTC is moving sideways and the direction is unclear, I’d rather admit that I can’t read anything from it right now and note my take on the price action as “no conclusion” than force myself to come up with a view. The least useful time to analyze a trend is often when you insist on getting an answer out of it. Set it aside and come back to it a few days later to see what you missed at the time—that’s more reliable than making up a direction on the spot.
So these days, I don’t really use “freedom” to describe this line of work. It’s more like a job where you have to reorganize your schedule, social life, and emotions all over again, with benefits and costs coming together. You set your own pace, and no one else is there to tell you to stop.
The freedom people imagine is mostly being in control of your own time and going wherever you want. In reality, a different set of things changes: no commute, no meetings, no colleagues, and no act of “clocking off.” Without those boundaries, your days lose their natural dividing lines. Morning and evening blur together, and before you know it, it’s dark.
For a while, I noticed that the number of times I actually spoke out loud in a day could be absurdly low. Those little opportunities to chat along the way or add a comment in a meeting were all gone. By the time I realized it, my first words of the day were often to place a food delivery order. This has nothing to do with being free or not; it’s simply what this kind of work looks like.
The market is the same. When BTC is moving sideways and the direction is unclear, I’d rather admit that I can’t read anything from it right now and note my take on the price action as “no conclusion” than force myself to come up with a view. The least useful time to analyze a trend is often when you insist on getting an answer out of it. Set it aside and come back to it a few days later to see what you missed at the time—that’s more reliable than making up a direction on the spot.
So these days, I don’t really use “freedom” to describe this line of work. It’s more like a job where you have to reorganize your schedule, social life, and emotions all over again, with benefits and costs coming together. You set your own pace, and no one else is there to tell you to stop.
77
·
--
#SKHY $SKHY 🔴 SKHY-4-hour-trend-following short
• Real-time price: 138.94
• Signal type: MIX confluence signal
• Instrument: SK hynix stock
Sunspot trading signal @ 08:00:31
#SKHY $SKHY 🔴 SKHY-4-hour-trend-following short
• Real-time price: 138.94
• Signal type: MIX confluence signal
• Instrument: SK hynix stock
Sunspot trading signal @ 08:00:31
• Real-time price: 138.94
• Signal type: MIX confluence signal
• Instrument: SK hynix stock
Sunspot trading signal @ 08:00:31
27
·
--
#TSLA $TSLA 🔴 TSLA-4-hour-trend-following short
• Live price: 386.88
• Signal type: MIX confluence signal
• Instrument: Tesla stock
Sunspot trading signal @ 08:00:22
#TSLA $TSLA 🔴 TSLA-4-hour-trend-following short
• Live price: 386.88
• Signal type: MIX confluence signal
• Instrument: Tesla stock
Sunspot trading signal @ 08:00:22
• Live price: 386.88
• Signal type: MIX confluence signal
• Instrument: Tesla stock
Sunspot trading signal @ 08:00:22
6
·
--
#INTC $INTC 🔴 INTC-4-hour trend-following short
• Real-time price: 60.57
• Signal type: MIX reversal signal
• Instrument information: Intel stock
Sunspot trading signal @ 08:00:06
#INTC $INTC 🔴 INTC-4-hour trend-following short
• Real-time price: 60.57
• Signal type: MIX reversal signal
• Instrument information: Intel stock
Sunspot trading signal @ 08:00:06
• Real-time price: 60.57
• Signal type: MIX reversal signal
• Instrument information: Intel stock
Sunspot trading signal @ 08:00:06
79
·
--
#NBIS $NBIS 🔴 NBIS - 4-hour - Trend-following short
• Real-time price: 149.34
• Signal type: MIX reversal signal
• Instrument: Nebius stock
Sunspot trading signal @ 08:00:06
#NBIS $NBIS 🔴 NBIS - 4-hour - Trend-following short
• Real-time price: 149.34
• Signal type: MIX reversal signal
• Instrument: Nebius stock
Sunspot trading signal @ 08:00:06
• Real-time price: 149.34
• Signal type: MIX reversal signal
• Instrument: Nebius stock
Sunspot trading signal @ 08:00:06
67
·
--
#QQQ $QQQ 🔴 QQQ-4-hour-Short in the direction of the trend
• Real-time price: 684.52
• Signal type: MIX reversal signal
• Instrument information: Nasdaq-100 ETF
Sunspot trading signal @ 08:00:05
#QQQ $QQQ 🔴 QQQ-4-hour-Short in the direction of the trend
• Real-time price: 684.52
• Signal type: MIX reversal signal
• Instrument information: Nasdaq-100 ETF
Sunspot trading signal @ 08:00:05
• Real-time price: 684.52
• Signal type: MIX reversal signal
• Instrument information: Nasdaq-100 ETF
Sunspot trading signal @ 08:00:05
91
·
--
#CPI高于预期,美股与BTC再度承压 $BTC U.S. stocks have gradually recovered from the previous tech sell-off, but BTC hasn’t really followed suit this time. Looking at price alone, it’s easy to sum things up with “still weak.” What I care more about is how, beneath the pressure in this cycle, money is actually moving in different directions.
On the spot side, Bitcoin ETFs have seen net outflows for some time now, and institutions are clearly cautious. Every time prices rebound, there’s a lack of buyers willing to step in and provide firm support. On the derivatives side, open interest in perpetual futures is elevated, while funding rates have consistently shown that leveraged bets on the upside are not cheap. One side is pulling back, the other is piling in—their directions don’t line up.
This divergence doesn’t tell us which way prices will go, but it does shape the market’s temperament. When spot buyers aren’t there to absorb selling, leverage-driven entries and exits can amplify price moves. The more crowded the positioning, the more likely an ordinary pullback is to trigger a cascade of liquidations, which in turn intensifies volatility. Even if prices return to the same interim lows, the presence or absence of this leverage underneath makes all the difference.
I don’t use this to guess whether prices will rise or fall next, and I don’t treat it as a definitive conclusion. I simply make a habit of tracking market structure separately from price: price tells me what happened, while structure serves as a reminder of how irrational this stretch of volatility could become. The divergence will only be behind us once sustained buying reappears on the spot side, or leverage clears out on its own. Until then, I’d rather just note what’s happening and avoid rushing to draw conclusions about the market.
#CPI高于预期,美股与BTC再度承压 $BTC U.S. stocks have gradually recovered from the previous tech sell-off, but BTC hasn’t really followed suit this time. Looking at price alone, it’s easy to sum things up with “still weak.” What I care more about is how, beneath the pressure in this cycle, money is actually moving in different directions.
On the spot side, Bitcoin ETFs have seen net outflows for some time now, and institutions are clearly cautious. Every time prices rebound, there’s a lack of buyers willing to step in and provide firm support. On the derivatives side, open interest in perpetual futures is elevated, while funding rates have consistently shown that leveraged bets on the upside are not cheap. One side is pulling back, the other is piling in—their directions don’t line up.
This divergence doesn’t tell us which way prices will go, but it does shape the market’s temperament. When spot buyers aren’t there to absorb selling, leverage-driven entries and exits can amplify price moves. The more crowded the positioning, the more likely an ordinary pullback is to trigger a cascade of liquidations, which in turn intensifies volatility. Even if prices return to the same interim lows, the presence or absence of this leverage underneath makes all the difference.
I don’t use this to guess whether prices will rise or fall next, and I don’t treat it as a definitive conclusion. I simply make a habit of tracking market structure separately from price: price tells me what happened, while structure serves as a reminder of how irrational this stretch of volatility could become. The divergence will only be behind us once sustained buying reappears on the spot side, or leverage clears out on its own. Until then, I’d rather just note what’s happening and avoid rushing to draw conclusions about the market.
On the spot side, Bitcoin ETFs have seen net outflows for some time now, and institutions are clearly cautious. Every time prices rebound, there’s a lack of buyers willing to step in and provide firm support. On the derivatives side, open interest in perpetual futures is elevated, while funding rates have consistently shown that leveraged bets on the upside are not cheap. One side is pulling back, the other is piling in—their directions don’t line up.
This divergence doesn’t tell us which way prices will go, but it does shape the market’s temperament. When spot buyers aren’t there to absorb selling, leverage-driven entries and exits can amplify price moves. The more crowded the positioning, the more likely an ordinary pullback is to trigger a cascade of liquidations, which in turn intensifies volatility. Even if prices return to the same interim lows, the presence or absence of this leverage underneath makes all the difference.
I don’t use this to guess whether prices will rise or fall next, and I don’t treat it as a definitive conclusion. I simply make a habit of tracking market structure separately from price: price tells me what happened, while structure serves as a reminder of how irrational this stretch of volatility could become. The divergence will only be behind us once sustained buying reappears on the spot side, or leverage clears out on its own. Until then, I’d rather just note what’s happening and avoid rushing to draw conclusions about the market.
87
Log in to explore more content
Join global crypto users on Binance Square
⚡️ Get latest and useful information about crypto.
💬 Trusted by the world’s largest crypto exchange.
👍 Discover real insights from verified creators.
Email / Phone number
Trending Topics
HuangExitNvidiaStrategyInFocus
91,002 views
1,000 Discussing
STOCKS | Nvidia’s Jensen Huang Resigns, Colette Kress Named as Interim CEO
Binance News
·24 Likes
·35.4k views
AnthropicRejectsIPODelayValuationinQuestion
694,342 views
5,260 Discussing
BitMineReports$6.3BNetLossForFiscal2026
11,601 views
123 Discussing