
LINK信仰者
684 Posts

LINK信仰者
Report
Block User
20 Following
66 Followers
87 Liked
Posts
All
Quotes
·
--
You often see “ETF net inflows”—what does this figure actually represent?
Definition: Bitcoin spot ETF issuers buy and custody Bitcoin directly. Investors can track Bitcoin’s price movements by trading fund shares through a securities account.
How it works: Spot ETFs let institutional investors who find it inconvenient to hold private keys directly gain exposure to Bitcoin through traditional brokerage channels.
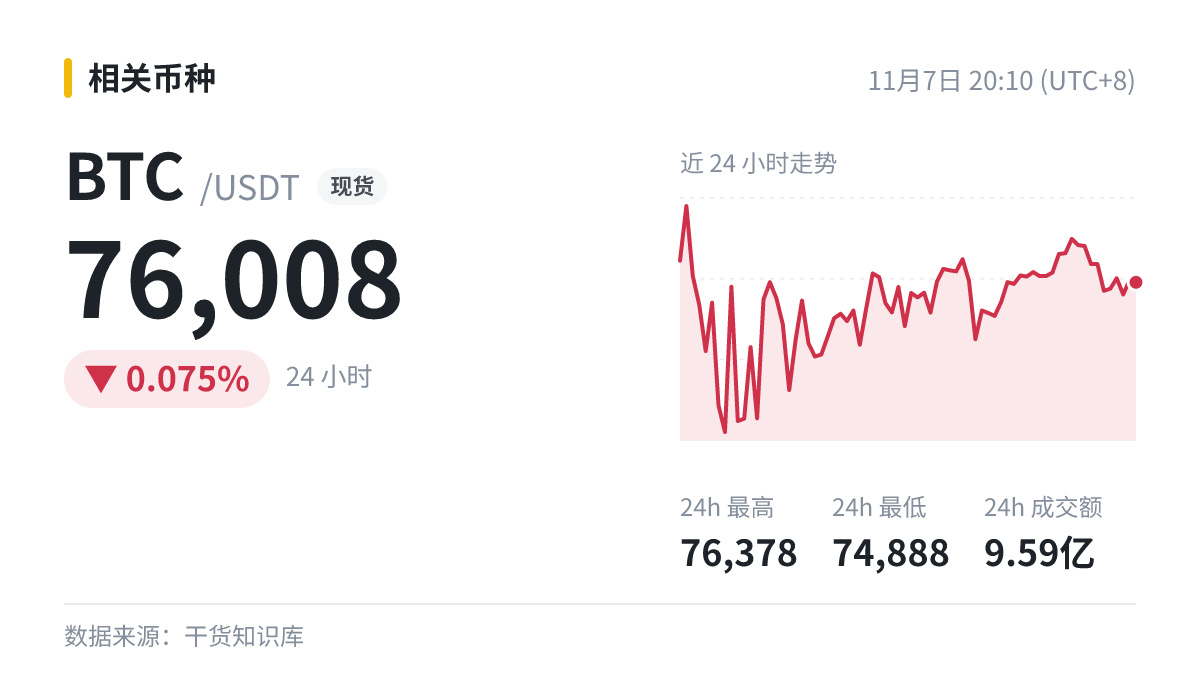
For market context: $BTC is trading at 76008 (24h -0.075%).
If you don’t understand a product, avoid taking a large position. Try a small amount first.
#BTC
You often see “ETF net inflows”—what does this figure actually represent?
Definition: Bitcoin spot ETF issuers buy and custody Bitcoin directly. Investors can track Bitcoin’s price movements by trading fund shares through a securities account.
How it works: Spot ETFs let institutional investors who find it inconvenient to hold private keys directly gain exposure to Bitcoin through traditional brokerage channels.
For market context: $BTC is trading at 76008 (24h -0.075%).
If you don’t understand a product, avoid taking a large position. Try a small amount first.
#BTC
Definition: Bitcoin spot ETF issuers buy and custody Bitcoin directly. Investors can track Bitcoin’s price movements by trading fund shares through a securities account.
How it works: Spot ETFs let institutional investors who find it inconvenient to hold private keys directly gain exposure to Bitcoin through traditional brokerage channels.
For market context: $BTC is trading at 76008 (24h -0.075%).
If you don’t understand a product, avoid taking a large position. Try a small amount first.
#BTC
4
·
--
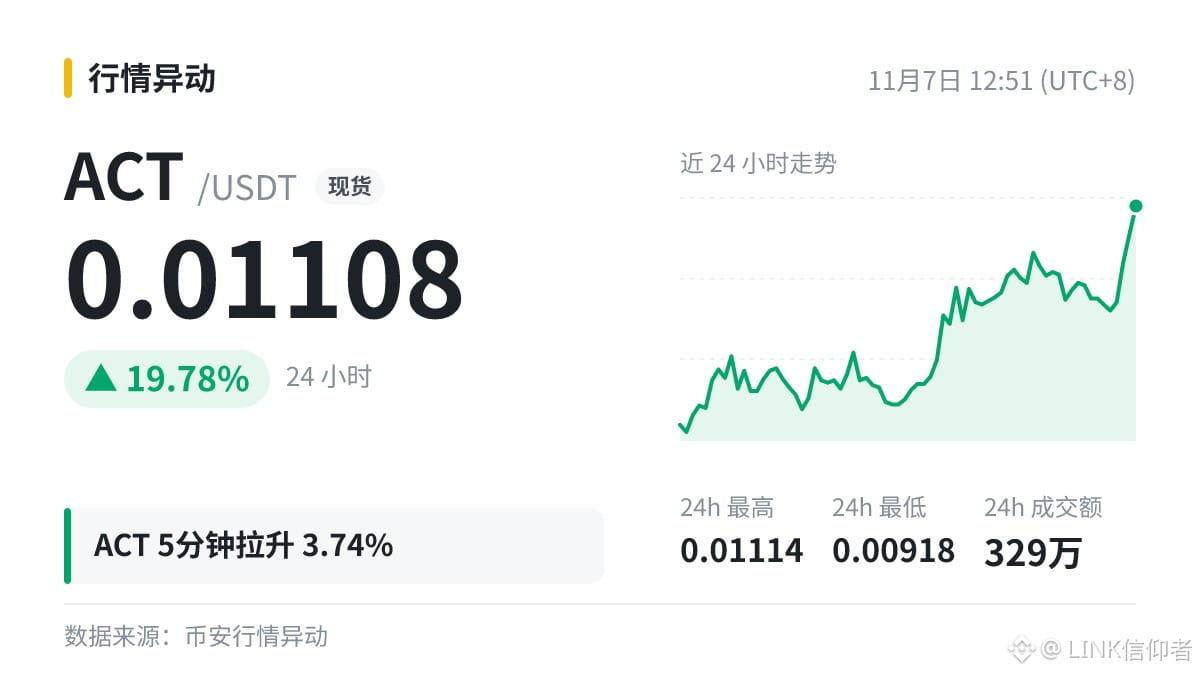
$ACT 5-minute spike of 3.74%, at 0.01108, with a 24h range of 0.00918 ~ 0.01114.
Signals are most reliable when the trend aligns across multiple timeframes. Be a little more cautious when shorter and longer timeframes diverge.
Momentum is still there, but the higher the price goes, the worse the risk-reward ratio gets. Think that through carefully.
#ACT
$ACT 5-minute spike of 3.74%, at 0.01108, with a 24h range of 0.00918 ~ 0.01114.
Signals are most reliable when the trend aligns across multiple timeframes. Be a little more cautious when shorter and longer timeframes diverge.
Momentum is still there, but the higher the price goes, the worse the risk-reward ratio gets. Think that through carefully.
#ACT
Signals are most reliable when the trend aligns across multiple timeframes. Be a little more cautious when shorter and longer timeframes diverge.
Momentum is still there, but the higher the price goes, the worse the risk-reward ratio gets. Think that through carefully.
#ACT
16
·
--
【Key points】A certain whale spent $15.15 million accumulating LINK and ETH over the past five days, and holds 787,000 LINK
· Sentiment: Moderately bullish
· Source: BlockBeats
· Related: $LINK (24h -1.08%)
· What to watch: Whether other coins in the same sector follow suit
#LINK
【Key points】A certain whale spent $15.15 million accumulating LINK and ETH over the past five days, and holds 787,000 LINK
· Sentiment: Moderately bullish
· Source: BlockBeats
· Related: $LINK (24h -1.08%)
· What to watch: Whether other coins in the same sector follow suit
#LINK
· Sentiment: Moderately bullish
· Source: BlockBeats
· Related: $LINK (24h -1.08%)
· What to watch: Whether other coins in the same sector follow suit
#LINK
29
·
--
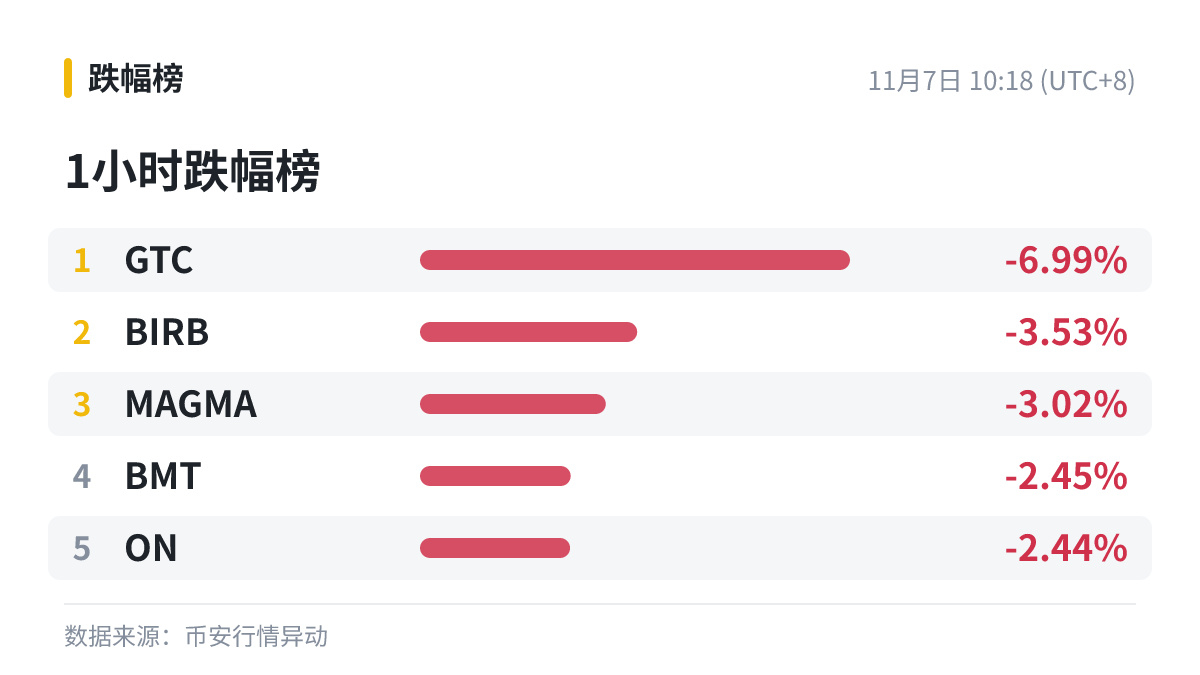
Top 5 biggest declines over 1 hour:
1. $GTC -6.99%
2. $BIRB -3.53%
3. $MAGMA -3.02%
4. BMT -2.45%
5. ON -2.44%
Quick take: The declines are relatively mild, suggesting sector rotation. The biggest-decliner list often sees technical rebounds, but a rebound does not mean a reversal.
#GTC
Top 5 biggest declines over 1 hour:
1. $GTC -6.99%
2. $BIRB -3.53%
3. $MAGMA -3.02%
4. BMT -2.45%
5. ON -2.44%
Quick take: The declines are relatively mild, suggesting sector rotation. The biggest-decliner list often sees technical rebounds, but a rebound does not mean a reversal.
#GTC
1. $GTC -6.99%
2. $BIRB -3.53%
3. $MAGMA -3.02%
4. BMT -2.45%
5. ON -2.44%
Quick take: The declines are relatively mild, suggesting sector rotation. The biggest-decliner list often sees technical rebounds, but a rebound does not mean a reversal.
#GTC
914
·
--
Honestly, I just took a look at the 24-hour gainers list:
No.1 $AKE +157.42%
No.2 $ONE +64.10%
No.3 $UAI +46.06%
No.4 ICNT +32.45%
No.5 LYN +27.81%
$AKE +157.42%—to be honest, when I see gains like this, I usually just watch and don’t chase. Rather than chasing the top performer, I prefer to see if there are any coins further down the list that haven’t gone up much yet.
How do you use the gainers list?
#AKE
Honestly, I just took a look at the 24-hour gainers list:
No.1 $AKE +157.42%
No.2 $ONE +64.10%
No.3 $UAI +46.06%
No.4 ICNT +32.45%
No.5 LYN +27.81%
$AKE +157.42%—to be honest, when I see gains like this, I usually just watch and don’t chase. Rather than chasing the top performer, I prefer to see if there are any coins further down the list that haven’t gone up much yet.
How do you use the gainers list?
#AKE
No.1 $AKE +157.42%
No.2 $ONE +64.10%
No.3 $UAI +46.06%
No.4 ICNT +32.45%
No.5 LYN +27.81%
$AKE +157.42%—to be honest, when I see gains like this, I usually just watch and don’t chase. Rather than chasing the top performer, I prefer to see if there are any coins further down the list that haven’t gone up much yet.
How do you use the gainers list?
#AKE
67
·
--
What determines the liquidation price? Many people can't explain it clearly!
In cross margin mode, lowering the leverage multiplier alone won't move the liquidation price farther away. Reducing your position or adding funds will help.
Positions with high leverage have very little initial margin. After deducting the maintenance margin, they can absorb even fewer losses, so the liquidation price is very close to the entry price.
Fees are also part of the cost of holding a position, so the longer you keep a trade open, the more carefully you need to account for them.
$BTC 75951.4 (-0.3%)
#BTC
What determines the liquidation price? Many people can't explain it clearly!
In cross margin mode, lowering the leverage multiplier alone won't move the liquidation price farther away. Reducing your position or adding funds will help.
Positions with high leverage have very little initial margin. After deducting the maintenance margin, they can absorb even fewer losses, so the liquidation price is very close to the entry price.
Fees are also part of the cost of holding a position, so the longer you keep a trade open, the more carefully you need to account for them.
$BTC 75951.4 (-0.3%)
#BTC
In cross margin mode, lowering the leverage multiplier alone won't move the liquidation price farther away. Reducing your position or adding funds will help.
Positions with high leverage have very little initial margin. After deducting the maintenance margin, they can absorb even fewer losses, so the liquidation price is very close to the entry price.
Fees are also part of the cost of holding a position, so the longer you keep a trade open, the more carefully you need to account for them.
$BTC 75951.4 (-0.3%)
#BTC
75
·
--
The story that hit me hardest just now: South Korean crypto exchange Gopax has suspended all trading services and is transferring users’ assets to cold wallets.
I’m not feeling great about it, but the more things are like this, the less I check the market. I’ll wait for my emotions to settle first.
$BTC is now at 76074.01. I’ll keep an eye on it for now. What do you all think? See you in the comments.
The story that hit me hardest just now: South Korean crypto exchange Gopax has suspended all trading services and is transferring users’ assets to cold wallets.
I’m not feeling great about it, but the more things are like this, the less I check the market. I’ll wait for my emotions to settle first.
$BTC is now at 76074.01. I’ll keep an eye on it for now. What do you all think? See you in the comments.
I’m not feeling great about it, but the more things are like this, the less I check the market. I’ll wait for my emotions to settle first.
$BTC is now at 76074.01. I’ll keep an eye on it for now. What do you all think? See you in the comments.
·
--
$HYPE HYPE is diverging from BTC. Once it goes up later, you can short it, targeting 60.
$HYPE HYPE is diverging from BTC. Once it goes up later, you can short it, targeting 60.
303
·
--
Institutional perspective: “Ethereum ETFs saw net outflows of $99.9 million on November 5, U.S. Eastern Time.”
Institutional selling doesn’t necessarily signal a bearish outlook; it could simply reflect redemption pressure. Don’t read too much into it, but keep an eye on whether the trend continues.
$ETH Add it to your watchlist first. Like this if you agree.
Institutional perspective: “Ethereum ETFs saw net outflows of $99.9 million on November 5, U.S. Eastern Time.”
Institutional selling doesn’t necessarily signal a bearish outlook; it could simply reflect redemption pressure. Don’t read too much into it, but keep an eye on whether the trend continues.
$ETH Add it to your watchlist first. Like this if you agree.
Institutional selling doesn’t necessarily signal a bearish outlook; it could simply reflect redemption pressure. Don’t read too much into it, but keep an eye on whether the trend continues.
$ETH Add it to your watchlist first. Like this if you agree.
28
·
--
How is capital voting?
U.S. Democrats are mulling legislation to repeal Trump’s tariffs on Canada
Institutions often don’t chase the first wave of news; they prefer to accumulate in batches on pullbacks. If things remain steady, just make a note of it—there’s no need to adjust your trades because of it.
$BTC (24h -5.43%).
How is capital voting?
U.S. Democrats are mulling legislation to repeal Trump’s tariffs on Canada
Institutions often don’t chase the first wave of news; they prefer to accumulate in batches on pullbacks. If things remain steady, just make a note of it—there’s no need to adjust your trades because of it.
$BTC (24h -5.43%).
U.S. Democrats are mulling legislation to repeal Trump’s tariffs on Canada
Institutions often don’t chase the first wave of news; they prefer to accumulate in batches on pullbacks. If things remain steady, just make a note of it—there’s no need to adjust your trades because of it.
$BTC (24h -5.43%).
30
·
--
🐋 $SOXLB 5-minute trading volume was about $3.57 million, 16.5 times the previous average; the price was nearly flat over the same period.
When volume spikes, many people’s first reaction is that big money has arrived, but it’s not that simple.
When assessing a volume spike, look at price as well: where the price stalls and how long the wicks are usually tell you more than the trading volume alone.
A rise on higher volume is often interpreted as having buying support, while a drop on higher volume is often seen as heavier selling pressure, but these are just rules of thumb.
The same readings can mean very different things in different market conditions, so don’t blindly apply any single rule of thumb.
🐋 $SOXLB 5-minute trading volume was about $3.57 million, 16.5 times the previous average; the price was nearly flat over the same period.
When volume spikes, many people’s first reaction is that big money has arrived, but it’s not that simple.
When assessing a volume spike, look at price as well: where the price stalls and how long the wicks are usually tell you more than the trading volume alone.
A rise on higher volume is often interpreted as having buying support, while a drop on higher volume is often seen as heavier selling pressure, but these are just rules of thumb.
The same readings can mean very different things in different market conditions, so don’t blindly apply any single rule of thumb.
When volume spikes, many people’s first reaction is that big money has arrived, but it’s not that simple.
When assessing a volume spike, look at price as well: where the price stalls and how long the wicks are usually tell you more than the trading volume alone.
A rise on higher volume is often interpreted as having buying support, while a drop on higher volume is often seen as heavier selling pressure, but these are just rules of thumb.
The same readings can mean very different things in different market conditions, so don’t blindly apply any single rule of thumb.
80
·
--
Trending discussion in the plaza: $BTC : Personal opinion (whales, sell-off)—rather bearish.
$BTC reports 76239.43 (24h -5.39%).
Which camp are you in?
Trending discussion in the plaza: $BTC : Personal opinion (whales, sell-off)—rather bearish.
$BTC reports 76239.43 (24h -5.39%).
Which camp are you in?
$BTC reports 76239.43 (24h -5.39%).
Which camp are you in?
140
·
--
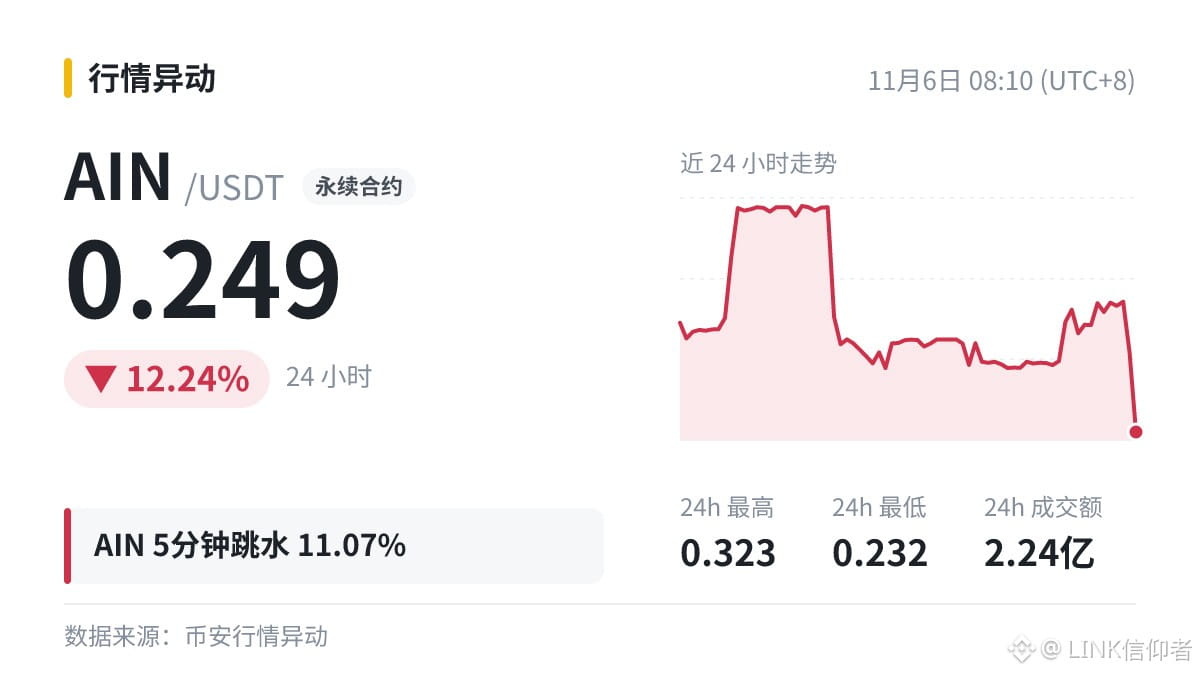
The crypto market's little drama has another update: $AIN 5 minutes down 11.07%.
When prices are falling fast, don't rush to call the bottom.
The crypto market's little drama has another update: $AIN 5 minutes down 11.07%.
When prices are falling fast, don't rush to call the bottom.
When prices are falling fast, don't rush to call the bottom.
1
443
·
--
Hot post opinions vs. market data:
① Plaza: Some people are venting about losses on $TRUMP (there are people on both sides)
② Market: $TRUMP current price: 1.228 (24h -15.49%)
The discussion getting heated is one thing; how the price moves is another.
Hot post opinions vs. market data:
① Plaza: Some people are venting about losses on $TRUMP (there are people on both sides)
② Market: $TRUMP current price: 1.228 (24h -15.49%)
The discussion getting heated is one thing; how the price moves is another.
① Plaza: Some people are venting about losses on $TRUMP (there are people on both sides)
② Market: $TRUMP current price: 1.228 (24h -15.49%)
The discussion getting heated is one thing; how the price moves is another.
1
416
·
--
$HYPE Once all the good news is out, only bad news remains
$HYPE Once all the good news is out, only bad news remains
253
·
--
Key price level breached: $JCT broke through 0.006.
Short-term sentiment is overheated. Before chasing the price higher, decide on your stop-loss level.
Key price level breached: $JCT broke through 0.006.
Short-term sentiment is overheated. Before chasing the price higher, decide on your stop-loss level.
Short-term sentiment is overheated. Before chasing the price higher, decide on your stop-loss level.
186
·
--
‼️ Binance gradually restores withdrawals for more assets after a security incident
The moment a project releases news, the candlesticks sometimes move even faster than the press release. $ETH 24h +8.59%, do you think this reaction is about right?
First grab some popcorn, then check the market, and finally decide whether to make a move.
#ETH
‼️ Binance gradually restores withdrawals for more assets after a security incident
The moment a project releases news, the candlesticks sometimes move even faster than the press release. $ETH 24h +8.59%, do you think this reaction is about right?
First grab some popcorn, then check the market, and finally decide whether to make a move.
#ETH
The moment a project releases news, the candlesticks sometimes move even faster than the press release. $ETH 24h +8.59%, do you think this reaction is about right?
First grab some popcorn, then check the market, and finally decide whether to make a move.
#ETH
116
·
--
Q: The Digital Chamber says Sherrod Brown’s victory is the worst outcome for the crypto industry. What’s your take?
A: It’s not a major issue, but viewed in the context of broader trends, it may offer some insight. I’d use the high before the news broke as the dividing line: holding above it is bullish; falling below it is bearish.
$BTC .
Q: The Digital Chamber says Sherrod Brown’s victory is the worst outcome for the crypto industry. What’s your take?
A: It’s not a major issue, but viewed in the context of broader trends, it may offer some insight. I’d use the high before the news broke as the dividing line: holding above it is bullish; falling below it is bearish.
$BTC .
A: It’s not a major issue, but viewed in the context of broader trends, it may offer some insight. I’d use the high before the news broke as the dividing line: holding above it is bullish; falling below it is bearish.
$BTC .
37
Log in to explore more content
Join global crypto users on Binance Square
⚡️ Get latest and useful information about crypto.
💬 Trusted by the world’s largest crypto exchange.
👍 Discover real insights from verified creators.
Email / Phone number
Trending Topics
JobsReportRaisesHikeOdds
358,543 views
2,684 Discussing
TradFi News | US Adds 165,000 Jobs in October, More Than Double the 65,000 Forecast, as Unemployment Falls to 4.1%
Binance News
·39 Likes
·23.6k views
CPITestsDecemberRateOutlook
73,902 views
726 Discussing
BitcoinRebounds$75KAsChipsLead
30,616 views
269 Discussing