
Crypto460
3.9k Posts

Crypto460
Crypto Trader || Market Analyst || Content Creator || Binance Square Creator || Community Builder || X:- @Soikat0077
Frequent Trader
2.3 Years
1.2K+ Following
4.2K+ Followers
8.4K+ Liked
Posts
All
Quotes
#dusk $DUSK @Dusk
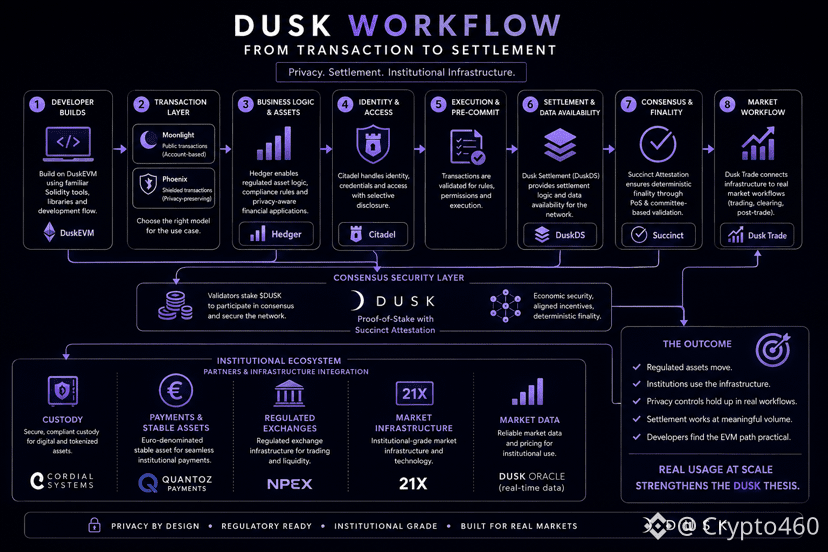
Fifteen days ago, I started looking at Dusk one feature at a time.
I expected to find a privacy-focused blockchain with a collection of financial features.
My view is more specific now.
The interesting part is how the pieces fit together.
DuskEVM keeps the EVM development path familiar.
Moonlight and Phoenix handle different transaction models.
Hedger focuses on regulated asset logic and privacy.
Citadel deals with identity and access.
DuskDS provides settlement and data availability.
Succinct Attestation provides deterministic finality.
Dusk Trade moves the infrastructure toward an actual market workflow.
Then there are the institutional relationships around custody, payments, exchanges, and market data, all secured by validators staking $DUSK underneath @Dusk ’s consensus. #dusk
After looking at all of this, I think the real question is no longer whether Dusk has interesting technology.
The harder question is execution.
Do regulated assets actually move?
Do institutions use the infrastructure?
Do the privacy controls hold up in real workflows?
Does settlement work at meaningful volume?
Do developers find the EVM path practical?
Those answers matter more to me now than another feature announcement.
I also think this is where being cautious helps.
A good architecture gives you a starting point.
A partnership gives you access.
Neither one proves adoption.
The next evidence I want to see is real usage at scale.
That is where the Dusk thesis either gets stronger or gets challenged.
After 15 days, that is the part I will be watching most closely.
Fifteen days ago, I started looking at Dusk one feature at a time.
I expected to find a privacy-focused blockchain with a collection of financial features.
My view is more specific now.
The interesting part is how the pieces fit together.
DuskEVM keeps the EVM development path familiar.
Moonlight and Phoenix handle different transaction models.
Hedger focuses on regulated asset logic and privacy.
Citadel deals with identity and access.
DuskDS provides settlement and data availability.
Succinct Attestation provides deterministic finality.
Dusk Trade moves the infrastructure toward an actual market workflow.
Then there are the institutional relationships around custody, payments, exchanges, and market data, all secured by validators staking $DUSK underneath @Dusk ’s consensus. #dusk
After looking at all of this, I think the real question is no longer whether Dusk has interesting technology.
The harder question is execution.
Do regulated assets actually move?
Do institutions use the infrastructure?
Do the privacy controls hold up in real workflows?
Does settlement work at meaningful volume?
Do developers find the EVM path practical?
Those answers matter more to me now than another feature announcement.
I also think this is where being cautious helps.
A good architecture gives you a starting point.
A partnership gives you access.
Neither one proves adoption.
The next evidence I want to see is real usage at scale.
That is where the Dusk thesis either gets stronger or gets challenged.
After 15 days, that is the part I will be watching most closely.
#dusk $DUSK @Dusk
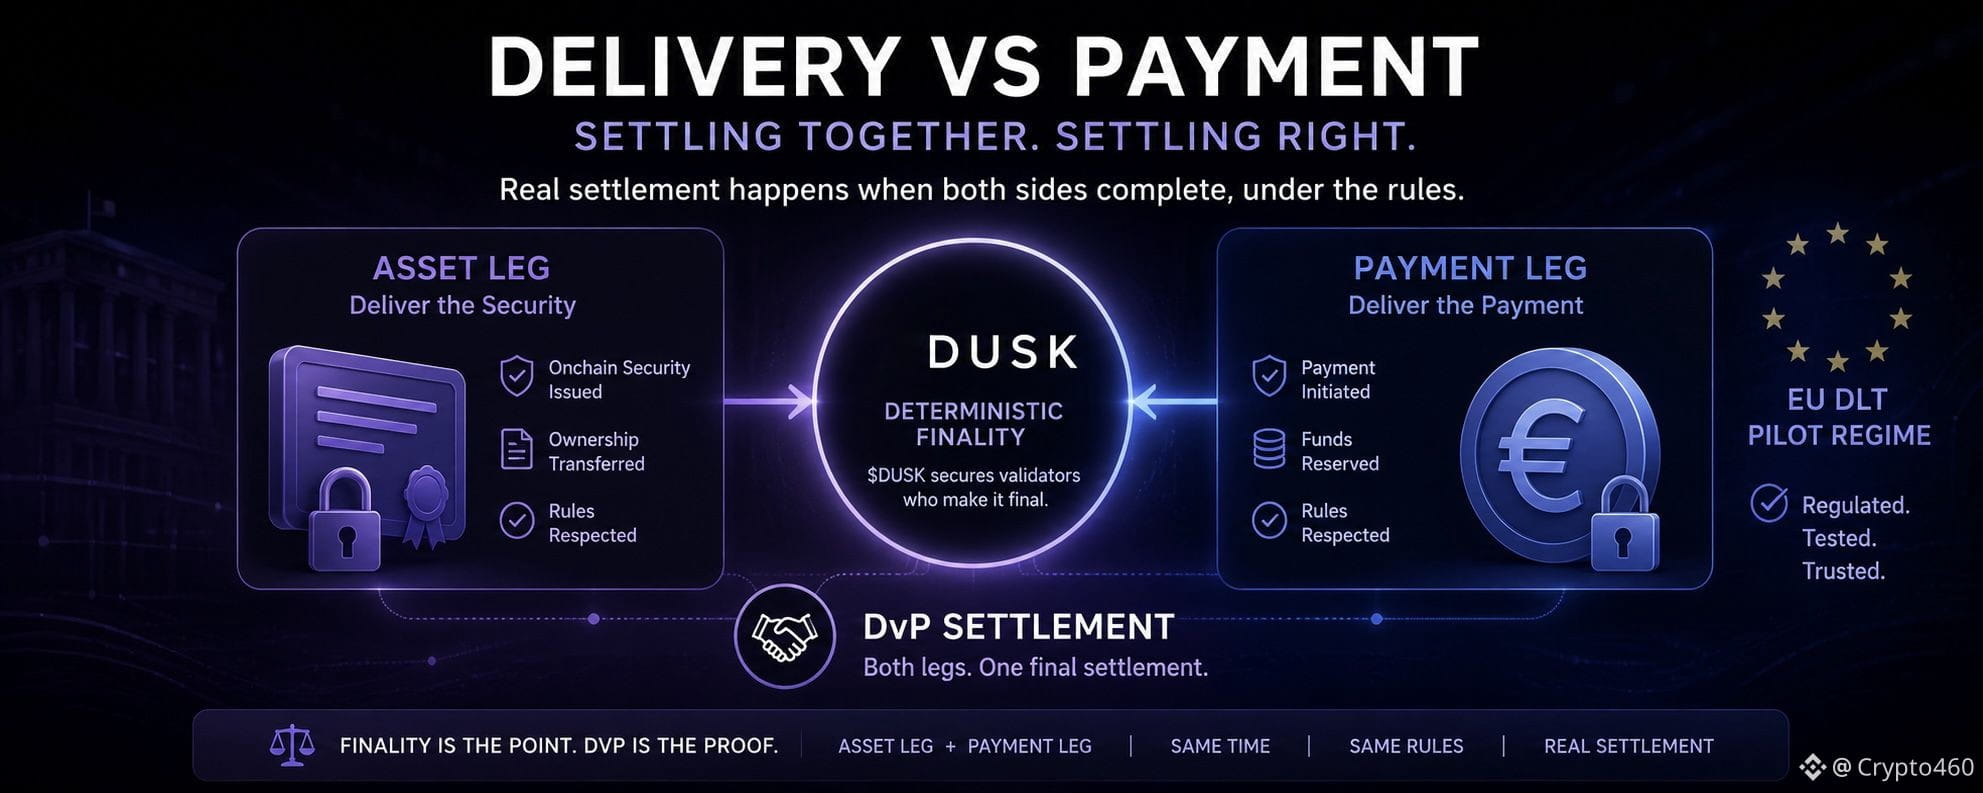
I started looking at settlement design and ended up focusing on one financial concept:
Delivery versus payment.
The idea is simple.
One side delivers the asset.
The other side delivers payment.
Both need to settle together.
If the asset moves while payment fails, the transaction has a problem.
If payment moves while the asset fails, the problem simply changes sides.
This is why putting a security onchain is only part of the settlement problem.
The asset leg and payment leg both matter.
The EU DLT Pilot Regime makes this especially relevant because it provides a framework for testing DLT-based financial market infrastructure under regulatory conditions.
@Dusk ’s deterministic finality gives the network a clear settlement point, with $DUSK underwriting the validators who get it there. #dusk
But finality alone does not create DvP.
Both sides still need to coordinate correctly.
That is the part I would want to see demonstrated in a real regulated transaction.
Not a diagram.
Not a concept.
An actual asset leg and payment leg completing together under the required rules.
That would tell me much more about Dusk’s settlement design than another performance comparison.
I started looking at settlement design and ended up focusing on one financial concept:
Delivery versus payment.
The idea is simple.
One side delivers the asset.
The other side delivers payment.
Both need to settle together.
If the asset moves while payment fails, the transaction has a problem.
If payment moves while the asset fails, the problem simply changes sides.
This is why putting a security onchain is only part of the settlement problem.
The asset leg and payment leg both matter.
The EU DLT Pilot Regime makes this especially relevant because it provides a framework for testing DLT-based financial market infrastructure under regulatory conditions.
@Dusk ’s deterministic finality gives the network a clear settlement point, with $DUSK underwriting the validators who get it there. #dusk
But finality alone does not create DvP.
Both sides still need to coordinate correctly.
That is the part I would want to see demonstrated in a real regulated transaction.
Not a diagram.
Not a concept.
An actual asset leg and payment leg completing together under the required rules.
That would tell me much more about Dusk’s settlement design than another performance comparison.
Selective disclosure sounds simple until you ask:
Who is allowed to see the information?
That question led me to Citadel.
@Dusk describes Citadel as its identity and access layer, with support for selective disclosure. #dusk
The idea is straightforward.
A participant proves something about themselves without exposing every piece of personal information behind the proof.
For a regulated financial system, that distinction matters.
An investor might need to prove eligibility.
A service provider needs to verify the relevant credential.
A regulator might need controlled access to specific information.
The whole network does not need to see everything.
That is where identity becomes more than an account address.
The system needs a way to establish who a participant is and what they are authorized to do, with the verification itself still settling as a $DUSK transaction underneath.
Citadel uses zero-knowledge proofs as part of this identity model.
What I still want to understand is the practical workflow.
How does someone receive a credential?
How does another party verify it?
How are permissions changed when the underlying status changes?
Those details determine how useful selective disclosure becomes in practice.
For me, Citadel is interesting because privacy only works well in regulated finance when access itself is programmable.
Who is allowed to see the information?
That question led me to Citadel.
@Dusk describes Citadel as its identity and access layer, with support for selective disclosure. #dusk
The idea is straightforward.
A participant proves something about themselves without exposing every piece of personal information behind the proof.
For a regulated financial system, that distinction matters.
An investor might need to prove eligibility.
A service provider needs to verify the relevant credential.
A regulator might need controlled access to specific information.
The whole network does not need to see everything.
That is where identity becomes more than an account address.
The system needs a way to establish who a participant is and what they are authorized to do, with the verification itself still settling as a $DUSK transaction underneath.
Citadel uses zero-knowledge proofs as part of this identity model.
What I still want to understand is the practical workflow.
How does someone receive a credential?
How does another party verify it?
How are permissions changed when the underlying status changes?
Those details determine how useful selective disclosure becomes in practice.
For me, Citadel is interesting because privacy only works well in regulated finance when access itself is programmable.
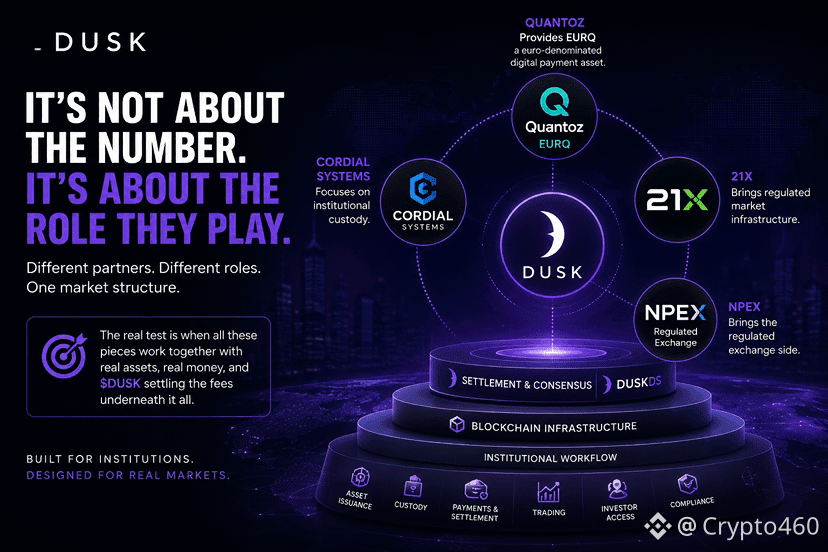
I started looking at institutional partners as separate announcements.
Then I noticed something.
They solve different parts of the same market structure.
Quantoz provides EURQ, a euro-denominated digital payment asset.
Cordial Systems focuses on institutional custody.
21X brings regulated market infrastructure.
NPEX brings the regulated exchange side.
Those roles are different.
A regulated asset needs somewhere to trade.
Investors need a compliant way to access it.
Assets need custody.
Payments need a settlement asset.
The blockchain sits underneath all of this.
That changed how I look at @Dusk ’s partnership strategy. #dusk
A long list of partners does not mean much by itself.
The useful question is whether each partner fills a specific requirement in the financial workflow.
There is still a gap between infrastructure and usage.
I want to see actual transactions move through these relationships, with $DUSK settling whatever fees sit underneath them.
I want to see how the different components connect when real assets and real money are involved.
For me, the interesting part is the structure of the network around Dusk.
The next test is whether those separate pieces operate as one working market.
@Dusk $DUSK #dusk
Then I noticed something.
They solve different parts of the same market structure.
Quantoz provides EURQ, a euro-denominated digital payment asset.
Cordial Systems focuses on institutional custody.
21X brings regulated market infrastructure.
NPEX brings the regulated exchange side.
Those roles are different.
A regulated asset needs somewhere to trade.
Investors need a compliant way to access it.
Assets need custody.
Payments need a settlement asset.
The blockchain sits underneath all of this.
That changed how I look at @Dusk ’s partnership strategy. #dusk
A long list of partners does not mean much by itself.
The useful question is whether each partner fills a specific requirement in the financial workflow.
There is still a gap between infrastructure and usage.
I want to see actual transactions move through these relationships, with $DUSK settling whatever fees sit underneath them.
I want to see how the different components connect when real assets and real money are involved.
For me, the interesting part is the structure of the network around Dusk.
The next test is whether those separate pieces operate as one working market.
@Dusk $DUSK #dusk
I wanted to separate the token from the trading conversation.
What does it actually do inside the @Dusk network? #dusk
Two functions stood out to me.
Gas.
Staking.
$DUSK pays transaction fees and contract execution costs on Dusk.
It also serves as the staking asset for network security.
The number that caught my attention was 210M+ DUSK staked.
That gives the network a significant amount of economic value committed to staking.
But I would not judge security from that number alone.
Distribution matters too.
210M DUSK spread across many independent participants presents a different security picture from the same amount concentrated among a small number of participants.
So I think there are two separate conversations around DUSK.
One is the market.
The other is network utility.
Gas pays for execution.
Staking connects the token to consensus participation.
Those functions do not depend on whether the market price is moving up or down.
The next number I would want to understand is not only total DUSK staked.
It is how that stake is distributed across the network.
What matters more when judging $DUSK network security?
What does it actually do inside the @Dusk network? #dusk
Two functions stood out to me.
Gas.
Staking.
$DUSK pays transaction fees and contract execution costs on Dusk.
It also serves as the staking asset for network security.
The number that caught my attention was 210M+ DUSK staked.
That gives the network a significant amount of economic value committed to staking.
But I would not judge security from that number alone.
Distribution matters too.
210M DUSK spread across many independent participants presents a different security picture from the same amount concentrated among a small number of participants.
So I think there are two separate conversations around DUSK.
One is the market.
The other is network utility.
Gas pays for execution.
Staking connects the token to consensus participation.
Those functions do not depend on whether the market price is moving up or down.
The next number I would want to understand is not only total DUSK staked.
It is how that stake is distributed across the network.
What matters more when judging $DUSK network security?
Total DUSK staked
0%
Stake distribution
0%
DUSK market price
0%
Trading volume
0%
0 votes • Voting closed
I used to think of consensus as the moment validators agree on a block.
Looking deeper into Dusk made me separate two things:
Block production.
Finality.
Dusk uses Succinct Attestation, a proof-of-stake, committee-based consensus design where validators stake $DUSK to participate.
The key detail for me is deterministic finality.
Once a block reaches the required ratification, the network has a defined final state rather than relying on a growing number of confirmations to make reversal less likely.
That distinction matters more when the blockchain is being used for settlement.
A financial institution needs to know when a transaction is final.
“Probably final” is a different guarantee from deterministic finality.
The committee structure is what makes the process interesting.
But I would not stop at the protocol description.
Committee selection matters.
Participation matters.
Network conditions matter.
Those are the details I would want to understand before judging how the system behaves under serious stress.
So my takeaway is not that @Dusk has solved consensus. #dusk
It is that Dusk treats finality as a specific protocol outcome rather than assuming block production alone answers the settlement question.
For financial infrastructure, I think that distinction deserves more attention.
@Dusk $DUSK #dusk
What matters most to you?
Looking deeper into Dusk made me separate two things:
Block production.
Finality.
Dusk uses Succinct Attestation, a proof-of-stake, committee-based consensus design where validators stake $DUSK to participate.
The key detail for me is deterministic finality.
Once a block reaches the required ratification, the network has a defined final state rather than relying on a growing number of confirmations to make reversal less likely.
That distinction matters more when the blockchain is being used for settlement.
A financial institution needs to know when a transaction is final.
“Probably final” is a different guarantee from deterministic finality.
The committee structure is what makes the process interesting.
But I would not stop at the protocol description.
Committee selection matters.
Participation matters.
Network conditions matter.
Those are the details I would want to understand before judging how the system behaves under serious stress.
So my takeaway is not that @Dusk has solved consensus. #dusk
It is that Dusk treats finality as a specific protocol outcome rather than assuming block production alone answers the settlement question.
For financial infrastructure, I think that distinction deserves more attention.
@Dusk $DUSK #dusk
What matters most to you?
Fast blocks
100%
Finality
0%
Validator security
0%
Network stability
0%
1 votes • Voting closed
I used to look at T+2 settlement mainly as a speed problem.
Then I started thinking about why those two days exist.
A trade happens.
Different parties confirm their obligations.
Custodians update records.
The asset and payment still need to reach the correct sides.
The waiting period gives the traditional system time to handle settlement risk.
So when I look at DuskDS, I do not think the interesting question is simply:
“Can settlement happen faster?”
The better question is:
“What provides certainty when the waiting period gets shorter?”
DuskDS is designed as the settlement and data availability layer of the @Dusk network, with $DUSK settling whatever fees move through it. #dusk
Its deterministic finality gives applications a defined point where the state is settled.
That matters for financial workflows.
But faster settlement does not automatically reproduce every protection inside traditional settlement systems.
The risk still needs to be handled somewhere.
That is the part I want to see demonstrated.
A real institutional transaction would tell me much more than a simple seconds-versus-days comparison.
For me, the interesting part of DuskDS is not speed alone.
It is what the system does with certainty once the transaction reaches finality.
@Dusk $DUSK #dusk
What matters most when settlement gets faster?
Then I started thinking about why those two days exist.
A trade happens.
Different parties confirm their obligations.
Custodians update records.
The asset and payment still need to reach the correct sides.
The waiting period gives the traditional system time to handle settlement risk.
So when I look at DuskDS, I do not think the interesting question is simply:
“Can settlement happen faster?”
The better question is:
“What provides certainty when the waiting period gets shorter?”
DuskDS is designed as the settlement and data availability layer of the @Dusk network, with $DUSK settling whatever fees move through it. #dusk
Its deterministic finality gives applications a defined point where the state is settled.
That matters for financial workflows.
But faster settlement does not automatically reproduce every protection inside traditional settlement systems.
The risk still needs to be handled somewhere.
That is the part I want to see demonstrated.
A real institutional transaction would tell me much more than a simple seconds-versus-days comparison.
For me, the interesting part of DuskDS is not speed alone.
It is what the system does with certainty once the transaction reaches finality.
@Dusk $DUSK #dusk
What matters most when settlement gets faster?
Speed of settlement
0%
Certainty after finality
0%
Lower settlement risk
0%
Institutional adoption
0%
0 votes • Voting closed
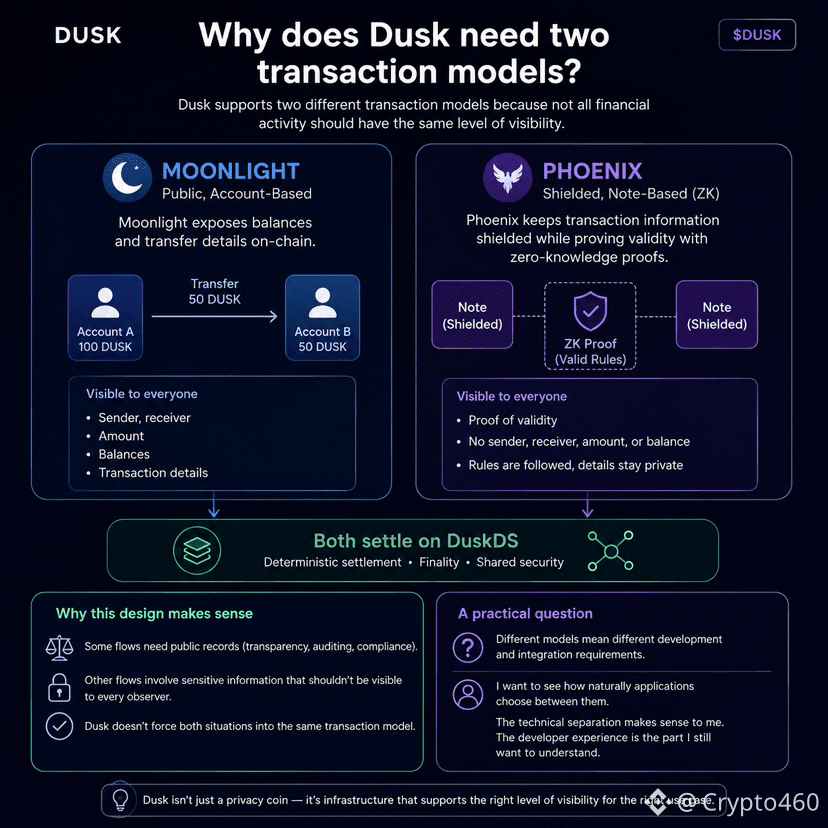
I kept seeing Moonlight and Phoenix mentioned separately.
So I started with one question:
Why does @Dusk need two transaction models?
Moonlight uses public, account-based transfers.
Phoenix uses shielded, note-based transfers with zero-knowledge proofs.
Both settle on DuskDS.
The difference is what information becomes visible.
Moonlight exposes balances and transfer details.
Phoenix keeps transaction information shielded while still proving the transaction follows the required rules.
That distinction makes more sense when you think about financial activity.
Some flows need public records.
Others involve information that should not be visible to every network observer.
Dusk does not force both situations into the same transaction model.
I find that design more interesting than simply calling $DUSK a privacy coin. #dusk
There is also a practical question.
Different transaction models mean different development and integration requirements.
So I want to see how naturally applications choose between them.
The technical separation makes sense to me.
The developer experience is the part I still want to understand.
@Dusk $DUSK #dusk
So I started with one question:
Why does @Dusk need two transaction models?
Moonlight uses public, account-based transfers.
Phoenix uses shielded, note-based transfers with zero-knowledge proofs.
Both settle on DuskDS.
The difference is what information becomes visible.
Moonlight exposes balances and transfer details.
Phoenix keeps transaction information shielded while still proving the transaction follows the required rules.
That distinction makes more sense when you think about financial activity.
Some flows need public records.
Others involve information that should not be visible to every network observer.
Dusk does not force both situations into the same transaction model.
I find that design more interesting than simply calling $DUSK a privacy coin. #dusk
There is also a practical question.
Different transaction models mean different development and integration requirements.
So I want to see how naturally applications choose between them.
The technical separation makes sense to me.
The developer experience is the part I still want to understand.
@Dusk $DUSK #dusk
I started looking at Dusk Trade from one simple perspective:
What does an investor actually do?
You find an asset.
You check whether you’re eligible.
You decide to buy.
The trade needs to happen.
Then the transaction needs to settle.
A token by itself does not provide this entire workflow.
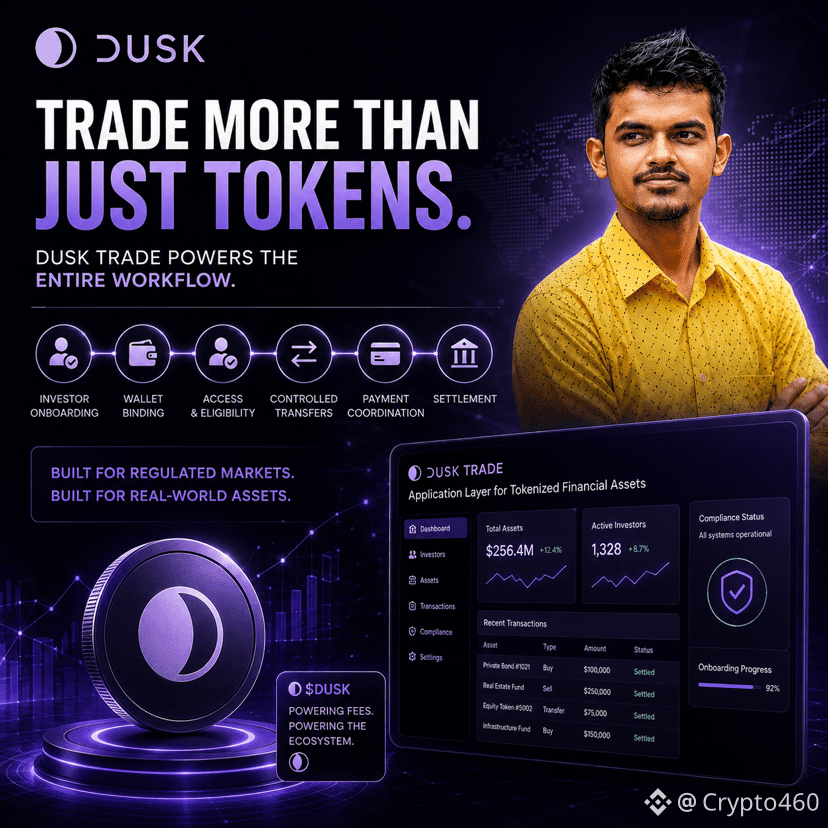
This is why Dusk Trade caught my attention. @Dusk describes it as the application layer for tokenized financial assets, with workflows covering investor onboarding, wallet binding, controlled transfers, payment coordination, and settlement. #dusk
That makes the product different from looking at an RWA token in isolation.
The hard part of regulated markets is the workflow around the asset.
Who gets access?
Who can hold it?
Who can transfer it?
How does the trade settle?
Dusk Trade is being built around those questions.
I still want to see the complete process working with real regulated assets and real users, transaction fees paid in $DUSK the same as anything else on the network.
The architecture gives me an idea of how the workflow is supposed to operate.
The live product will tell me how much friction remains.
That is the part I am watching.....
What does an investor actually do?
You find an asset.
You check whether you’re eligible.
You decide to buy.
The trade needs to happen.
Then the transaction needs to settle.
A token by itself does not provide this entire workflow.
This is why Dusk Trade caught my attention. @Dusk describes it as the application layer for tokenized financial assets, with workflows covering investor onboarding, wallet binding, controlled transfers, payment coordination, and settlement. #dusk
That makes the product different from looking at an RWA token in isolation.
The hard part of regulated markets is the workflow around the asset.
Who gets access?
Who can hold it?
Who can transfer it?
How does the trade settle?
Dusk Trade is being built around those questions.
I still want to see the complete process working with real regulated assets and real users, transaction fees paid in $DUSK the same as anything else on the network.
The architecture gives me an idea of how the workflow is supposed to operate.
The live product will tell me how much friction remains.
That is the part I am watching.....
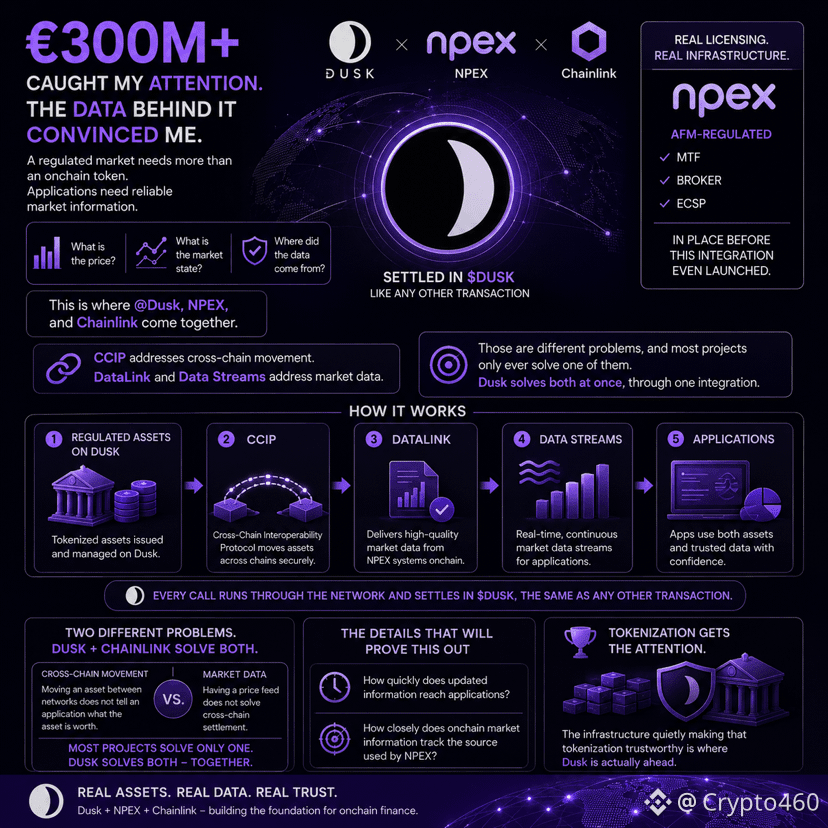
€300M+ caught my attention when I started looking at Dusk and NPEX.🔥🔥🔥
Then I stopped looking at the asset figure and started looking at the data behind the assets.
A regulated market needs more than an onchain token.
Applications also need reliable market information.
What is the price?
What is the market state?
Where did the data come from?
This is where the @Dusk , NPEX, and Chainlink relationship gets interesting to me. #dusk
CCIP addresses cross chain movement.
DataLink and Data Streams address market data.
Those are different problems, and most projects only ever solve one of them.
Moving an asset between networks does not tell an application its value.
A price feed does not solve cross chain settlement.
Dusk solving both at once, through one integration instead of two separate bolt-ons, is what actually convinced me this isn’t just another partnership announcement.
While I was digging into this, one number stood out that wasn’t about the partnership at all…. Dusk’s incentivized testnet already has 8,000+ active nodes running. That’s not a headline figure, it’s an infrastructure one, and it tells me there’s real participation happening before mainnet is even live.
Every call still runs through the network and settles in $DUSK the same as any other transaction.
How closely does onchain market information track the source used by NPEX?
How quickly does updated information reach applications?
Those are the details that will actually prove this out, and NPEX already brings real licensing to the table while it happens … AFM-regulated, MTF, Broker, and ECSP status all in place before this integration even launched.
Tokenization gets the attention.
The infrastructure quietly making that tokenization trustworthy, node count included, is where I think Dusk is actually ahead.
@Dusk $DUSK #dusk
Then I stopped looking at the asset figure and started looking at the data behind the assets.
A regulated market needs more than an onchain token.
Applications also need reliable market information.
What is the price?
What is the market state?
Where did the data come from?
This is where the @Dusk , NPEX, and Chainlink relationship gets interesting to me. #dusk
CCIP addresses cross chain movement.
DataLink and Data Streams address market data.
Those are different problems, and most projects only ever solve one of them.
Moving an asset between networks does not tell an application its value.
A price feed does not solve cross chain settlement.
Dusk solving both at once, through one integration instead of two separate bolt-ons, is what actually convinced me this isn’t just another partnership announcement.
While I was digging into this, one number stood out that wasn’t about the partnership at all…. Dusk’s incentivized testnet already has 8,000+ active nodes running. That’s not a headline figure, it’s an infrastructure one, and it tells me there’s real participation happening before mainnet is even live.
Every call still runs through the network and settles in $DUSK the same as any other transaction.
How closely does onchain market information track the source used by NPEX?
How quickly does updated information reach applications?
Those are the details that will actually prove this out, and NPEX already brings real licensing to the table while it happens … AFM-regulated, MTF, Broker, and ECSP status all in place before this integration even launched.
Tokenization gets the attention.
The infrastructure quietly making that tokenization trustworthy, node count included, is where I think Dusk is actually ahead.
@Dusk $DUSK #dusk
Verified
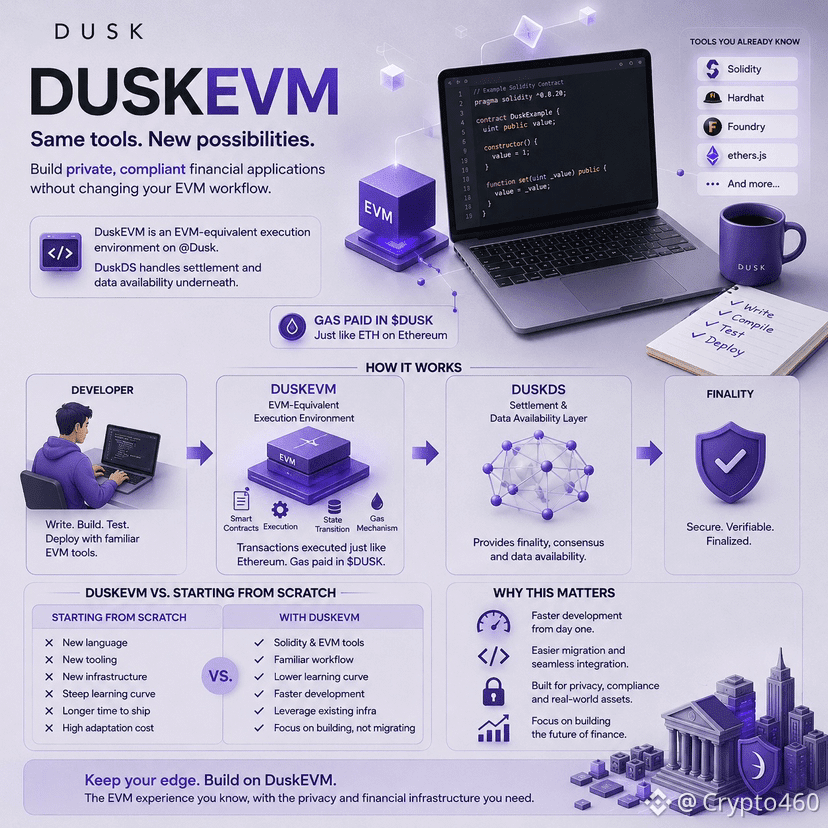
I expected DuskEVM to require a completely different developer workflow….
Then I looked at the tooling. 👍
Solidity stays familiar.
Hardhat.
Foundry.
ethers.
The usual EVM development stack still applies.
That caught my attention because moving to a new blockchain often means learning a new environment before building anything useful.
DuskEVM takes a different route. It provides an EVM-equivalent execution environment on @Dusk while DuskDS handles settlement and data availability underneath…
So the developer does not need to throw away the EVM workflow to build on the network, gas paid in $DUSK the same way ETH works on Ethereum.
For me, this changes the adoption question.
The issue is no longer only whether Dusk has the features developers need…
It is also how much existing EVM knowledge and infrastructure developers get to carry over.
There is still something I want to test.
Compatibility in documentation is one thing.
Deploying a real application, debugging contracts, connecting wallets, and maintaining the application is another.
That is where I think DuskEVM will prove whether this approach works as smoothly as the architecture suggests. #dusk
Then I looked at the tooling. 👍
Solidity stays familiar.
Hardhat.
Foundry.
ethers.
The usual EVM development stack still applies.
That caught my attention because moving to a new blockchain often means learning a new environment before building anything useful.
DuskEVM takes a different route. It provides an EVM-equivalent execution environment on @Dusk while DuskDS handles settlement and data availability underneath…
So the developer does not need to throw away the EVM workflow to build on the network, gas paid in $DUSK the same way ETH works on Ethereum.
For me, this changes the adoption question.
The issue is no longer only whether Dusk has the features developers need…
It is also how much existing EVM knowledge and infrastructure developers get to carry over.
There is still something I want to test.
Compatibility in documentation is one thing.
Deploying a real application, debugging contracts, connecting wallets, and maintaining the application is another.
That is where I think DuskEVM will prove whether this approach works as smoothly as the architecture suggests. #dusk
#dusk $DUSK @Dusk I keep seeing RWA discussions treat tokenized and natively issued assets as same thing.
@Dusk treats them differently, and I think this distinction matters.
Tokenized usually means a token represents an asset held somewhere else.
Think about a bond, fund, or equity.....
The asset still sits offchain with a custodian.
The token points to the asset.
When the token moves onchain, the system holding the real asset still needs a matching update.
Two records.
Two places.
Someone has to keep them aligned.
Native issuance takes a different approach.
Dusk focuses on the full asset lifecycle:
Issuance.
Transfer.
Servicing.
Settlement.
These processes run on infrastructure designed for regulated markets, where the legal structure permits the model.
The token is not a receipt for something sitting elsewhere.
The record on Dusk becomes the primary record.
This is where Dusk’s base layer becomes interesting to me.
Access controls.
Eligibility checks.
Selective disclosure.
These features sit in the base layer instead of being added later.
A general-purpose chain without compliance primitives does not have the same setup.
So the asset stays at the wrapper stage by design.
Now look at the bond example from the other side.
With native issuance, the bond’s issuance and transfers happen where the eligibility and disclosure rules already live.
There is no separate system to keep in sync.
So I keep coming back to one question when looking at RWA projects:
Are assets actually being natively issued, or are they still tokens representing assets held somewhere else?
For me, this distinction says more about the infrastructure than the word “tokenization” does.
@Dusk treats them differently, and I think this distinction matters.
Tokenized usually means a token represents an asset held somewhere else.
Think about a bond, fund, or equity.....
The asset still sits offchain with a custodian.
The token points to the asset.
When the token moves onchain, the system holding the real asset still needs a matching update.
Two records.
Two places.
Someone has to keep them aligned.
Native issuance takes a different approach.
Dusk focuses on the full asset lifecycle:
Issuance.
Transfer.
Servicing.
Settlement.
These processes run on infrastructure designed for regulated markets, where the legal structure permits the model.
The token is not a receipt for something sitting elsewhere.
The record on Dusk becomes the primary record.
This is where Dusk’s base layer becomes interesting to me.
Access controls.
Eligibility checks.
Selective disclosure.
These features sit in the base layer instead of being added later.
A general-purpose chain without compliance primitives does not have the same setup.
So the asset stays at the wrapper stage by design.
Now look at the bond example from the other side.
With native issuance, the bond’s issuance and transfers happen where the eligibility and disclosure rules already live.
There is no separate system to keep in sync.
So I keep coming back to one question when looking at RWA projects:
Are assets actually being natively issued, or are they still tokens representing assets held somewhere else?
For me, this distinction says more about the infrastructure than the word “tokenization” does.
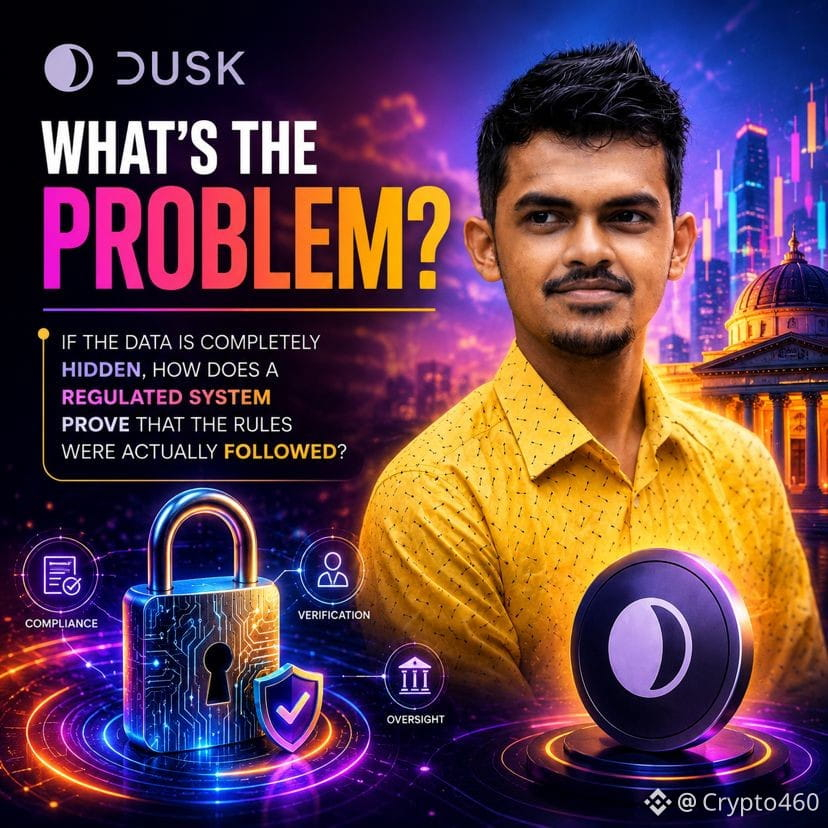
#dusk $DUSK @Dusk If the data is completely hidden how does a regulated system prove that the rules were actually followed?
That is the question where a lot of privacy tools fall short. They focus on hiding the data. Leave almost no clean way to check what happened.
For applications that need oversight this trade-off becomes a problem.
What stood out when I looked at @Dusk is Hedger. It sits on DuskEVM. Is built as a privacy module for financial apps.
Hedger combines homomorphic encryption with zero-knowledge proofs so a transaction can stay confidential while still allowing verification.
An encrypted trade can remain hidden from the public. An authorized compliance officer can still confirm that the correct rules were followed without seeing the full underlying data of the transaction.
The design choice of Hedger feels deliberate.
Of treating privacy as total opacity Hedger tries to keep the data of the financial apps protected and the process reviewable at the same time.
This combination of protecting the data and allowing verification is rarer than it should be in the applications.
Privacy becomes more useful for finance when it can still support verification and oversight of the apps.
That is the part I keep coming to when I think about Hedger and Dusk and the role of $DUSK , in it.
That is the question where a lot of privacy tools fall short. They focus on hiding the data. Leave almost no clean way to check what happened.
For applications that need oversight this trade-off becomes a problem.
What stood out when I looked at @Dusk is Hedger. It sits on DuskEVM. Is built as a privacy module for financial apps.
Hedger combines homomorphic encryption with zero-knowledge proofs so a transaction can stay confidential while still allowing verification.
An encrypted trade can remain hidden from the public. An authorized compliance officer can still confirm that the correct rules were followed without seeing the full underlying data of the transaction.
The design choice of Hedger feels deliberate.
Of treating privacy as total opacity Hedger tries to keep the data of the financial apps protected and the process reviewable at the same time.
This combination of protecting the data and allowing verification is rarer than it should be in the applications.
Privacy becomes more useful for finance when it can still support verification and oversight of the apps.
That is the part I keep coming to when I think about Hedger and Dusk and the role of $DUSK , in it.
⚠️ BIG STORM WARNING🚨🚨🚨
$BTC never bottoms on the first crash.
It bottoms on the second leg — the final capitulation that almost nobody is positioned for.
Look at the cycle pattern:
2018: $19k → $10k → $3.5k 2022: $69k → $32k → $15k 2026: $126k → $64k → $45k
First leg shakes out the tourists. Then comes the bounce that everyone calls “the bottom.” That’s the bull trap.
The real flush hits after … cutting the price nearly in half again while the timeline is still screaming that the worst is over.
That second leg is where the cycle actually resets. It’s the number most people refuse to say out loud until it’s already printed. And it’s exactly where the real money gets made.
We’re sitting in the trap right now.
Most will only recognize it in the rearview mirror.
$BTC never bottoms on the first crash.
It bottoms on the second leg — the final capitulation that almost nobody is positioned for.
Look at the cycle pattern:
2018: $19k → $10k → $3.5k 2022: $69k → $32k → $15k 2026: $126k → $64k → $45k
First leg shakes out the tourists. Then comes the bounce that everyone calls “the bottom.” That’s the bull trap.
The real flush hits after … cutting the price nearly in half again while the timeline is still screaming that the worst is over.
That second leg is where the cycle actually resets. It’s the number most people refuse to say out loud until it’s already printed. And it’s exactly where the real money gets made.
We’re sitting in the trap right now.
Most will only recognize it in the rearview mirror.
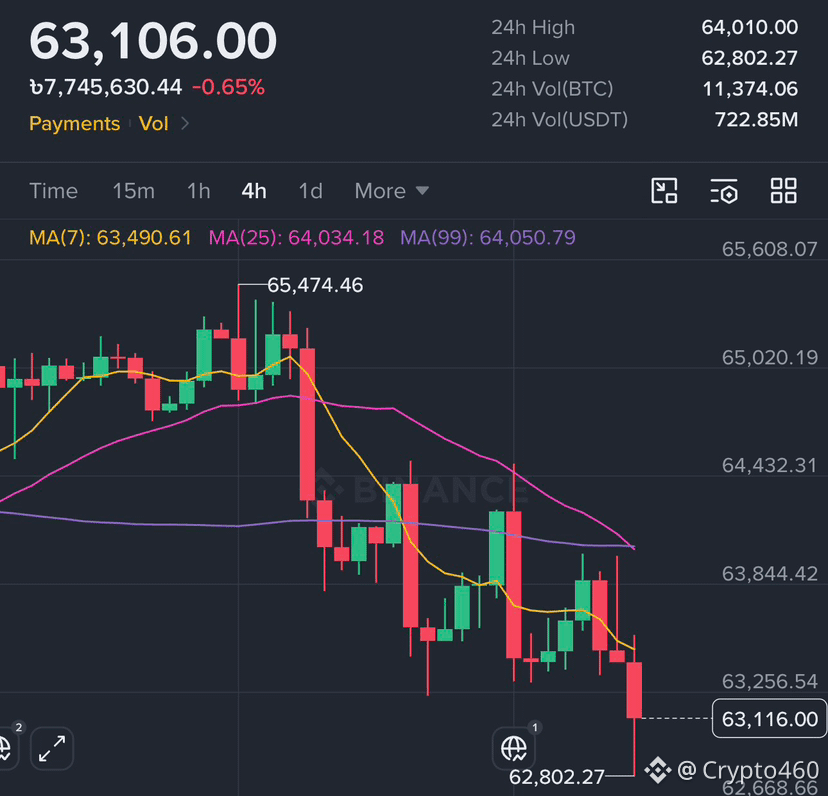
$BTC just slipped under $63K. The S&P is sitting at record highs.
Two assets, same week, opposite directions. That’s not noise … $that’s a signal about where risk appetite actually is right now.
Doesn’t mean crypto is done. It means capital is rotating, and rotations like this have happened before. The difference this time is how loud it feels because everyone’s watching both charts at once.
Not selling. Not panicking. Just paying attention.
Two assets, same week, opposite directions. That’s not noise … $that’s a signal about where risk appetite actually is right now.
Doesn’t mean crypto is done. It means capital is rotating, and rotations like this have happened before. The difference this time is how loud it feels because everyone’s watching both charts at once.
Not selling. Not panicking. Just paying attention.
#dusk $DUSK @Dusk I used to assume privacy and compliance were basically opposites on public blockchains. Everything is either fully visible or locked away so tightly that checking anything becomes almost impossible. Most systems seemed built around that either-or.
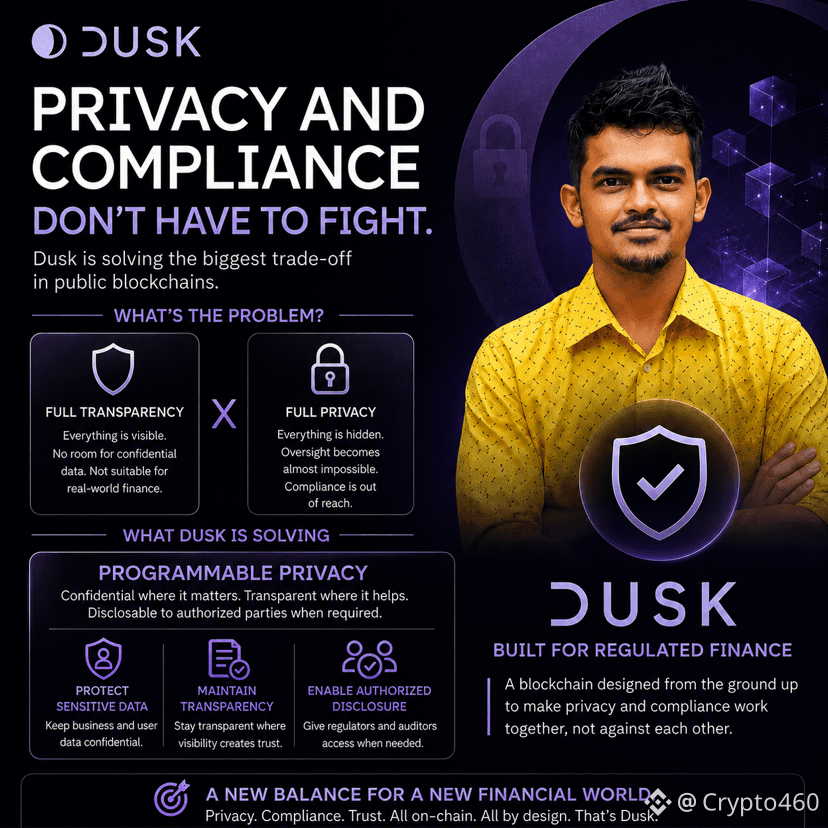
Looking closer at @Dusk changed how I see it. Their approach is called programmable privacy. It doesn’t force the network into one extreme. Some data stays private. Some stays open when that helps. And the right people can still review what they need to. Privacy and compliance don’t have to fight each other. They can both exist at once.
Imagine a simple scenario.... A fund manager might want portfolio positions kept away from competitors. At the same time, a regulator may need access to specific records. Programmable privacy is designed so both can be true without breaking the other.
What I find interesting is the shift in framing. Instead of treating privacy as something that has to be sacrificed for regulation, or regulation as something that kills privacy, the design starts from the assumption that regulated finance needs both. That small change in starting point seems to shape everything else.
I’m still early in looking at the project, but this particular idea is the one that made me keep reading.
Looking closer at @Dusk changed how I see it. Their approach is called programmable privacy. It doesn’t force the network into one extreme. Some data stays private. Some stays open when that helps. And the right people can still review what they need to. Privacy and compliance don’t have to fight each other. They can both exist at once.
Imagine a simple scenario.... A fund manager might want portfolio positions kept away from competitors. At the same time, a regulator may need access to specific records. Programmable privacy is designed so both can be true without breaking the other.
What I find interesting is the shift in framing. Instead of treating privacy as something that has to be sacrificed for regulation, or regulation as something that kills privacy, the design starts from the assumption that regulated finance needs both. That small change in starting point seems to shape everything else.
I’m still early in looking at the project, but this particular idea is the one that made me keep reading.
Just spun the wheel and snagged some rewards!❤️❤️❤️
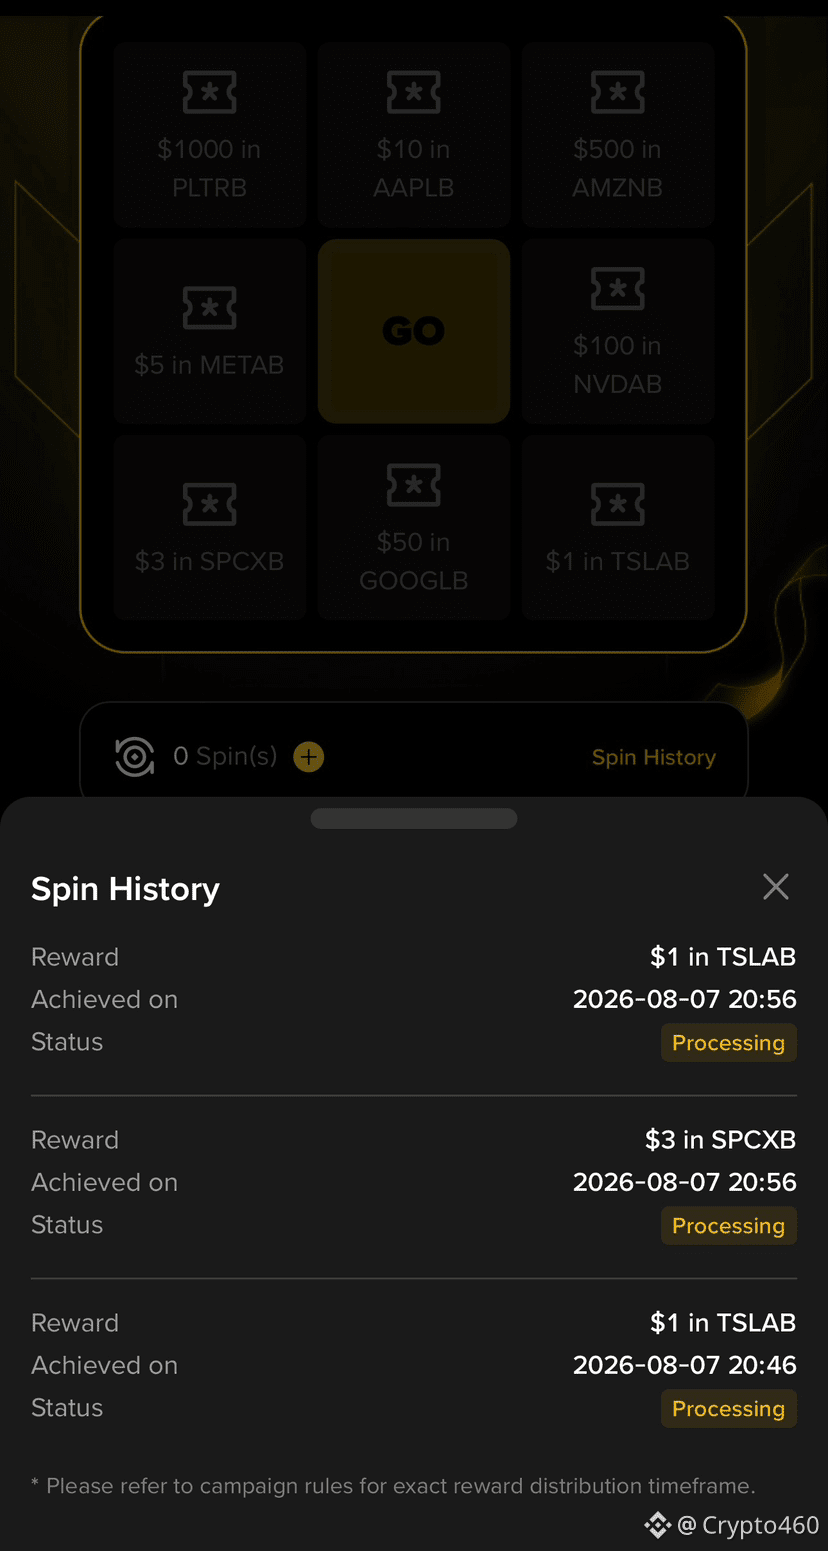
Here is what I won from the campaign today:
$1 in $TSLAB
$3 in $SPCXB
$1 in $TSLAB
Status is currently Processing, but every little reward adds up! 💰
Did anyone manage to hit the bigger prizes like the $1,000 PLTRB or $500 AMZNB?
Drop your spin results below! 👇
#Binance #CryptoRewards #SpinToWin #TradingRewards
Here is what I won from the campaign today:
$1 in $TSLAB
$3 in $SPCXB
$1 in $TSLAB
Status is currently Processing, but every little reward adds up! 💰
Did anyone manage to hit the bigger prizes like the $1,000 PLTRB or $500 AMZNB?
Drop your spin results below! 👇
#Binance #CryptoRewards #SpinToWin #TradingRewards
@BabylonLabs_io I have been watching the TBV timeline closely. The latest founders call made the progress feel real. Public testnet has already created more than 2,000 vaults since late May. Vault creation time dropped from about three hours to around 90 minutes after a research breakthrough. Aave’s Temp Check passed with strong support. The ARFC is expected in mid-August. The team is aiming for October mainnet once audits and readiness are complete.
Partners like Bedrock, GoMining and 84 Labs have shown interest at the scale of up to 1,000 BTC each. Hardware and MPC wallets including Ledger, Keystone and Utila are adding the extra signatures TBV needs. Live usage data, infrastructure partners and governance progress together turn a research idea into something usable.
For me the signal is clear. Native Bitcoin collateral without wrapping or custody is moving from testnet experiment to something institutions can actually plan around.
$BABY #baby
What gives you the most confidence in TBV?
A. Speed
B. Aave
C. Partners
D. Native BTC
Partners like Bedrock, GoMining and 84 Labs have shown interest at the scale of up to 1,000 BTC each. Hardware and MPC wallets including Ledger, Keystone and Utila are adding the extra signatures TBV needs. Live usage data, infrastructure partners and governance progress together turn a research idea into something usable.
For me the signal is clear. Native Bitcoin collateral without wrapping or custody is moving from testnet experiment to something institutions can actually plan around.
$BABY #baby
What gives you the most confidence in TBV?
A. Speed
B. Aave
C. Partners
D. Native BTC
#baby $BABY @BabylonLabs_io
I noticed something in Babylon’s governance setup. It seems worth sitting with instead of glossing over. BTC stakers provide the economic security. Their bitcoin backs the finality providers. Their capital is at risk if something gets slashed. But governance is done only by $BABY holders. They vote on fee changes, inflation parameters, and protocol upgrades. BTC stakers do not get a vote. On one level that makes sense. BABY is the native governance token. That is how the system was designed from the start. But it creates a specific gap. The group taking the security risk and the group setting the economic parameters are not necessarily the same people. You could be deeply exposed as a BTC staker. You could have zero say in a vote that changes the terms you are staked under. Maybe that is fine in practice. The two groups might overlap heavily. Plenty of BTC stakers probably hold BABY too. But “probably overlap” and “structurally guaranteed to overlap” are different things. I have not seen anything that requires the second one. I am not saying this is a flaw exactly. It is just a design choice worth naming. We should not assume governance and security automatically point the same direction.
I noticed something in Babylon’s governance setup. It seems worth sitting with instead of glossing over. BTC stakers provide the economic security. Their bitcoin backs the finality providers. Their capital is at risk if something gets slashed. But governance is done only by $BABY holders. They vote on fee changes, inflation parameters, and protocol upgrades. BTC stakers do not get a vote. On one level that makes sense. BABY is the native governance token. That is how the system was designed from the start. But it creates a specific gap. The group taking the security risk and the group setting the economic parameters are not necessarily the same people. You could be deeply exposed as a BTC staker. You could have zero say in a vote that changes the terms you are staked under. Maybe that is fine in practice. The two groups might overlap heavily. Plenty of BTC stakers probably hold BABY too. But “probably overlap” and “structurally guaranteed to overlap” are different things. I have not seen anything that requires the second one. I am not saying this is a flaw exactly. It is just a design choice worth naming. We should not assume governance and security automatically point the same direction.
BULLISH???
50%
BEARISH???
50%
2 votes • Voting closed
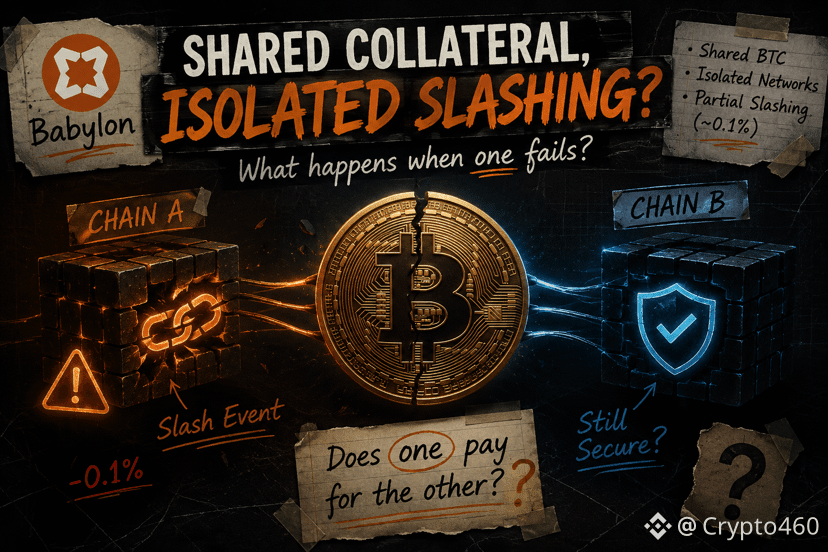
at first I thought the most interesting part of Babylon’s design was capital efficiency.
One Bitcoin UTXO helping secure multiple Bitcoin Secured Networks sounds like an obvious improvement. The same BTC can contribute security across different chains instead of being locked separately for each one.
the relationship between shared collateral and isolated slashing was caught my attention.
the documentation explains that slashing is partial, around 0.1% of stake for misbehavior, and that each BSN has isolation boundaries so issues on one network don’t spill over into another.
that makes sense on its own.
but then I started wondering what happens when the same UTXO is securing more than one chain at the same time.
if Chain A experiences a slashing event because its Finality Providers misbehave, does only the portion of stake allocated to Chain A get burned?
or does the underlying UTXO itself take the loss, reducing the collateral that’s still securing Chain B as well?
to me, that’s where the interesting question begins.
“Isolated” and “shared collateral” seem perfectly compatible at a high level, but once you think through the mechanics, it’s less obvious how they fit together.
there may be a straightforward answer. The accounting under the hood could be much more granular than I’m imagining.
I just haven’t come across documentation that walks through that specific scenario yet.
has anyone found a detailed explanation of how that case is handled?
@BabylonLabs_io $BABY #baby
One Bitcoin UTXO helping secure multiple Bitcoin Secured Networks sounds like an obvious improvement. The same BTC can contribute security across different chains instead of being locked separately for each one.
the relationship between shared collateral and isolated slashing was caught my attention.
the documentation explains that slashing is partial, around 0.1% of stake for misbehavior, and that each BSN has isolation boundaries so issues on one network don’t spill over into another.
that makes sense on its own.
but then I started wondering what happens when the same UTXO is securing more than one chain at the same time.
if Chain A experiences a slashing event because its Finality Providers misbehave, does only the portion of stake allocated to Chain A get burned?
or does the underlying UTXO itself take the loss, reducing the collateral that’s still securing Chain B as well?
to me, that’s where the interesting question begins.
“Isolated” and “shared collateral” seem perfectly compatible at a high level, but once you think through the mechanics, it’s less obvious how they fit together.
there may be a straightforward answer. The accounting under the hood could be much more granular than I’m imagining.
I just haven’t come across documentation that walks through that specific scenario yet.
has anyone found a detailed explanation of how that case is handled?
@BabylonLabs_io $BABY #baby
Log in to explore more content