
Sizhen
58 Posts

Sizhen
Zen
Trader & Analyst
0 Following
4 Followers
11 Liked
Posts
All
Quotes
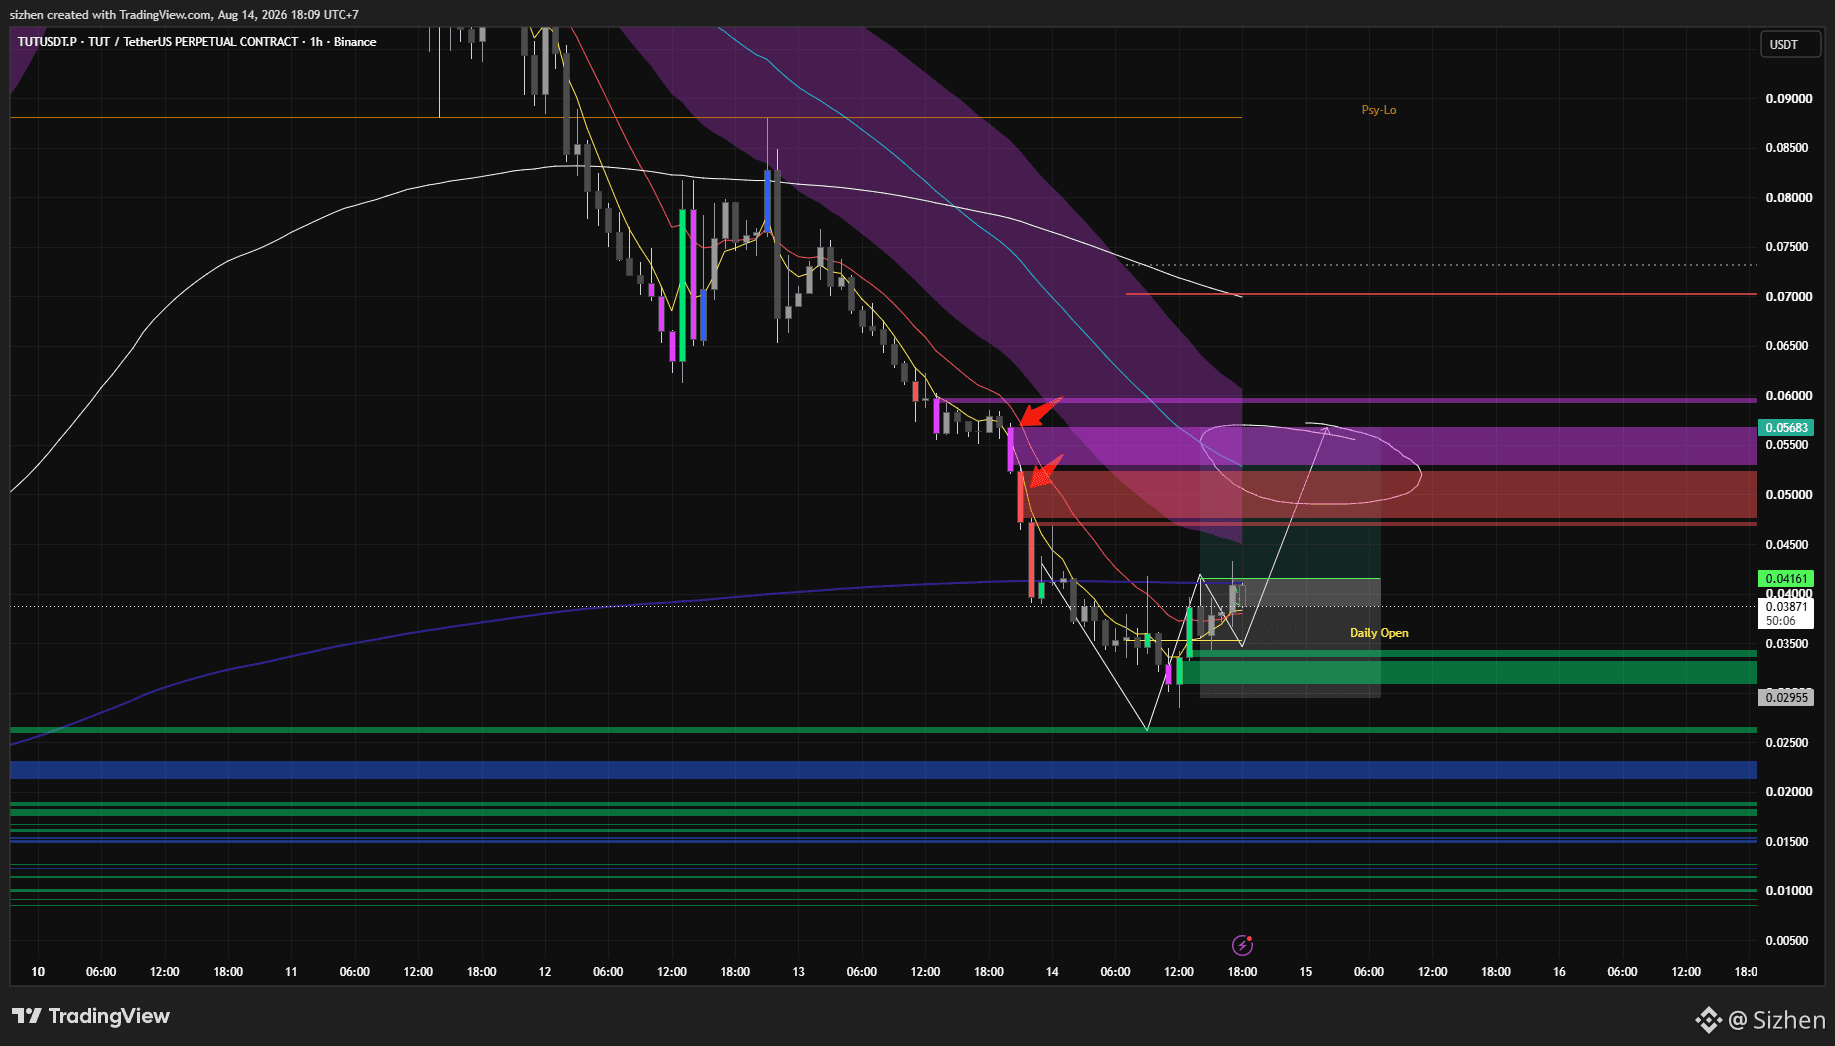
This $TUT setup is quite tricky, as it targets the price touching the 50 EMA or rebounding from several levels above as the target
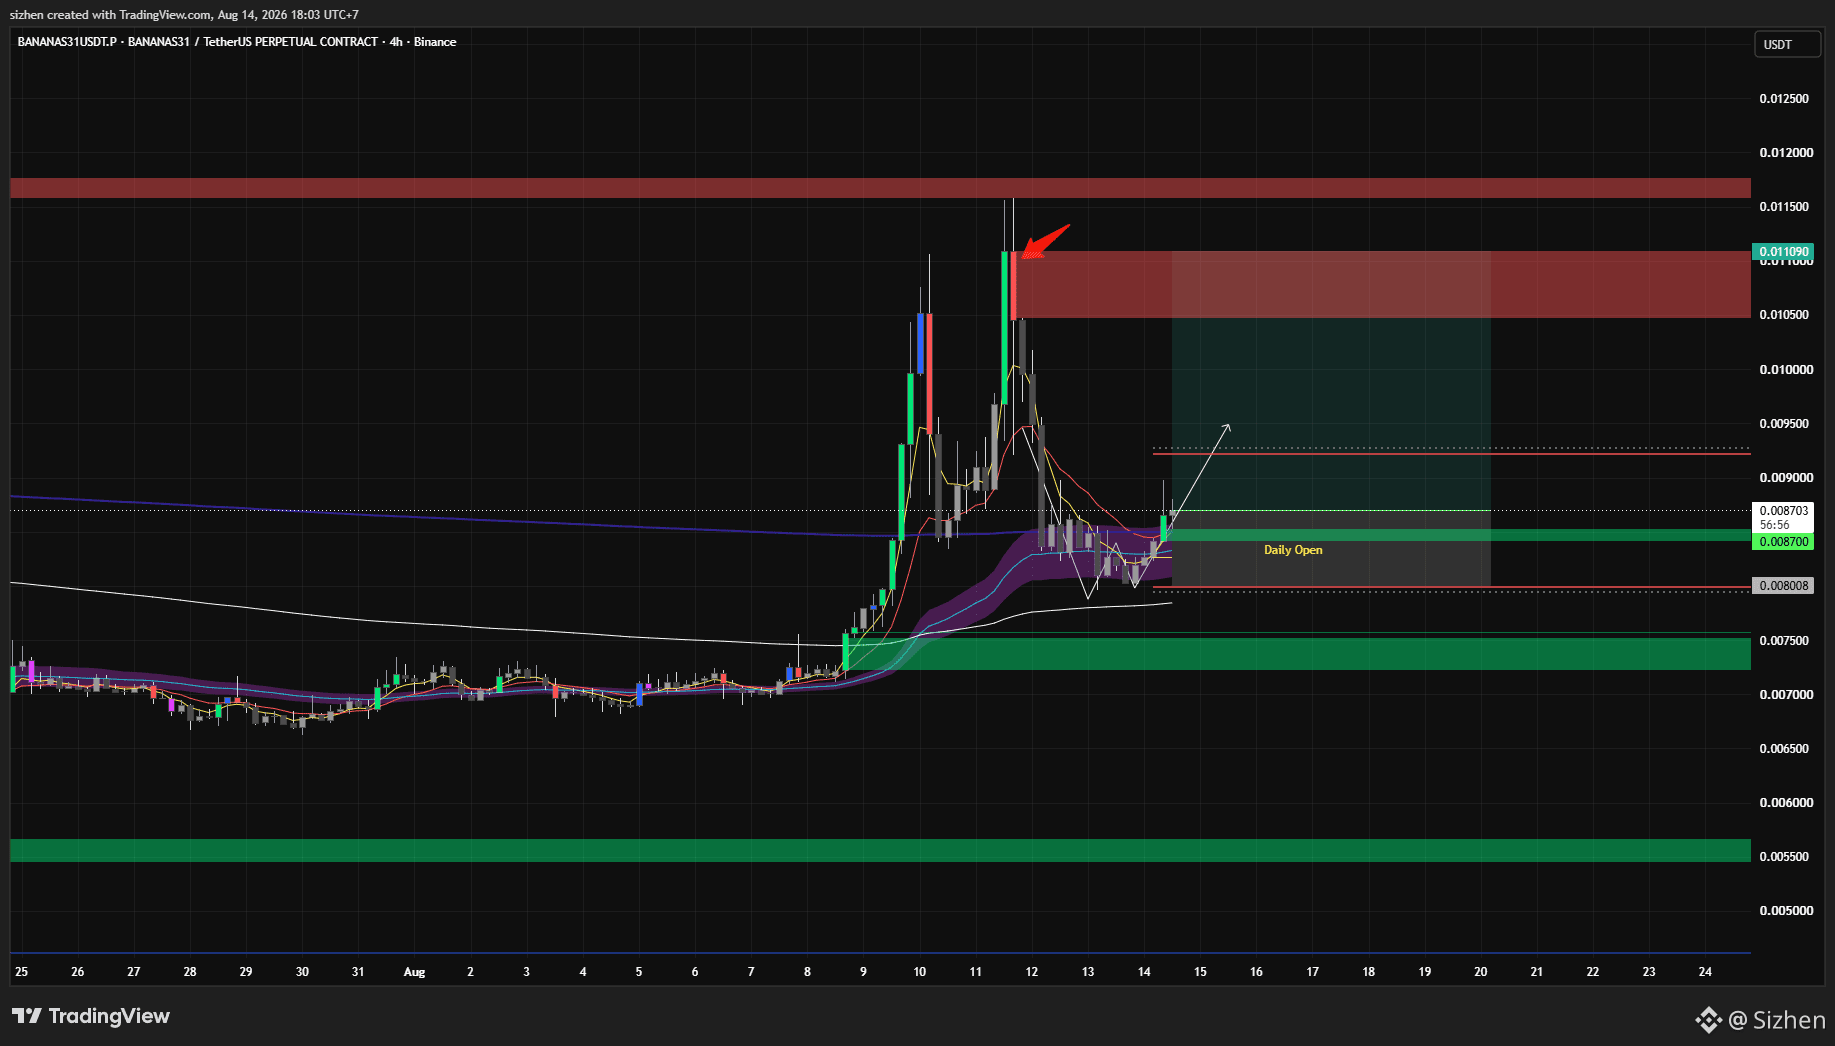
$BANANAS31 As the price has not broken through the daily open or the 50 EMA, we might be able to target the red vector candle above as our target.
As long as the price remains above the EMA, this setup remains valid
As long as the price remains above the EMA, this setup remains valid
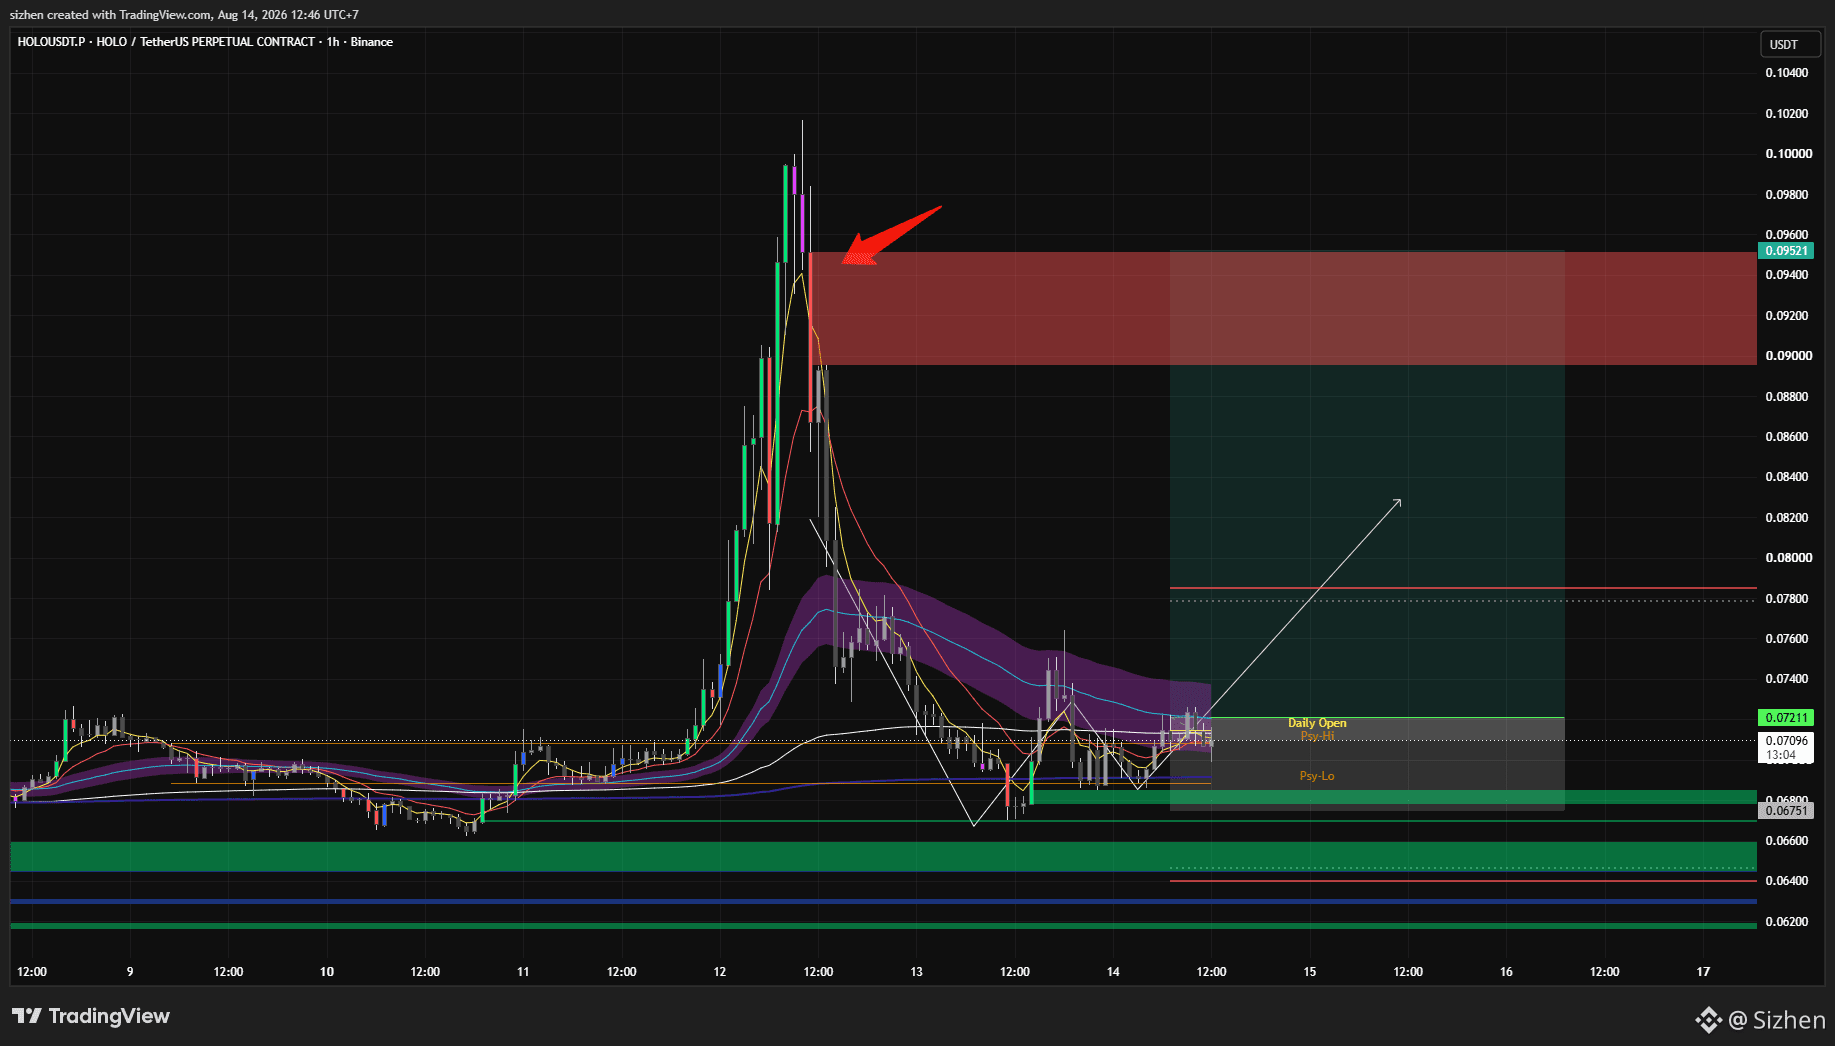
Closing the $HOLO long position temporarily and waiting for further price action
Sizhen
·
--
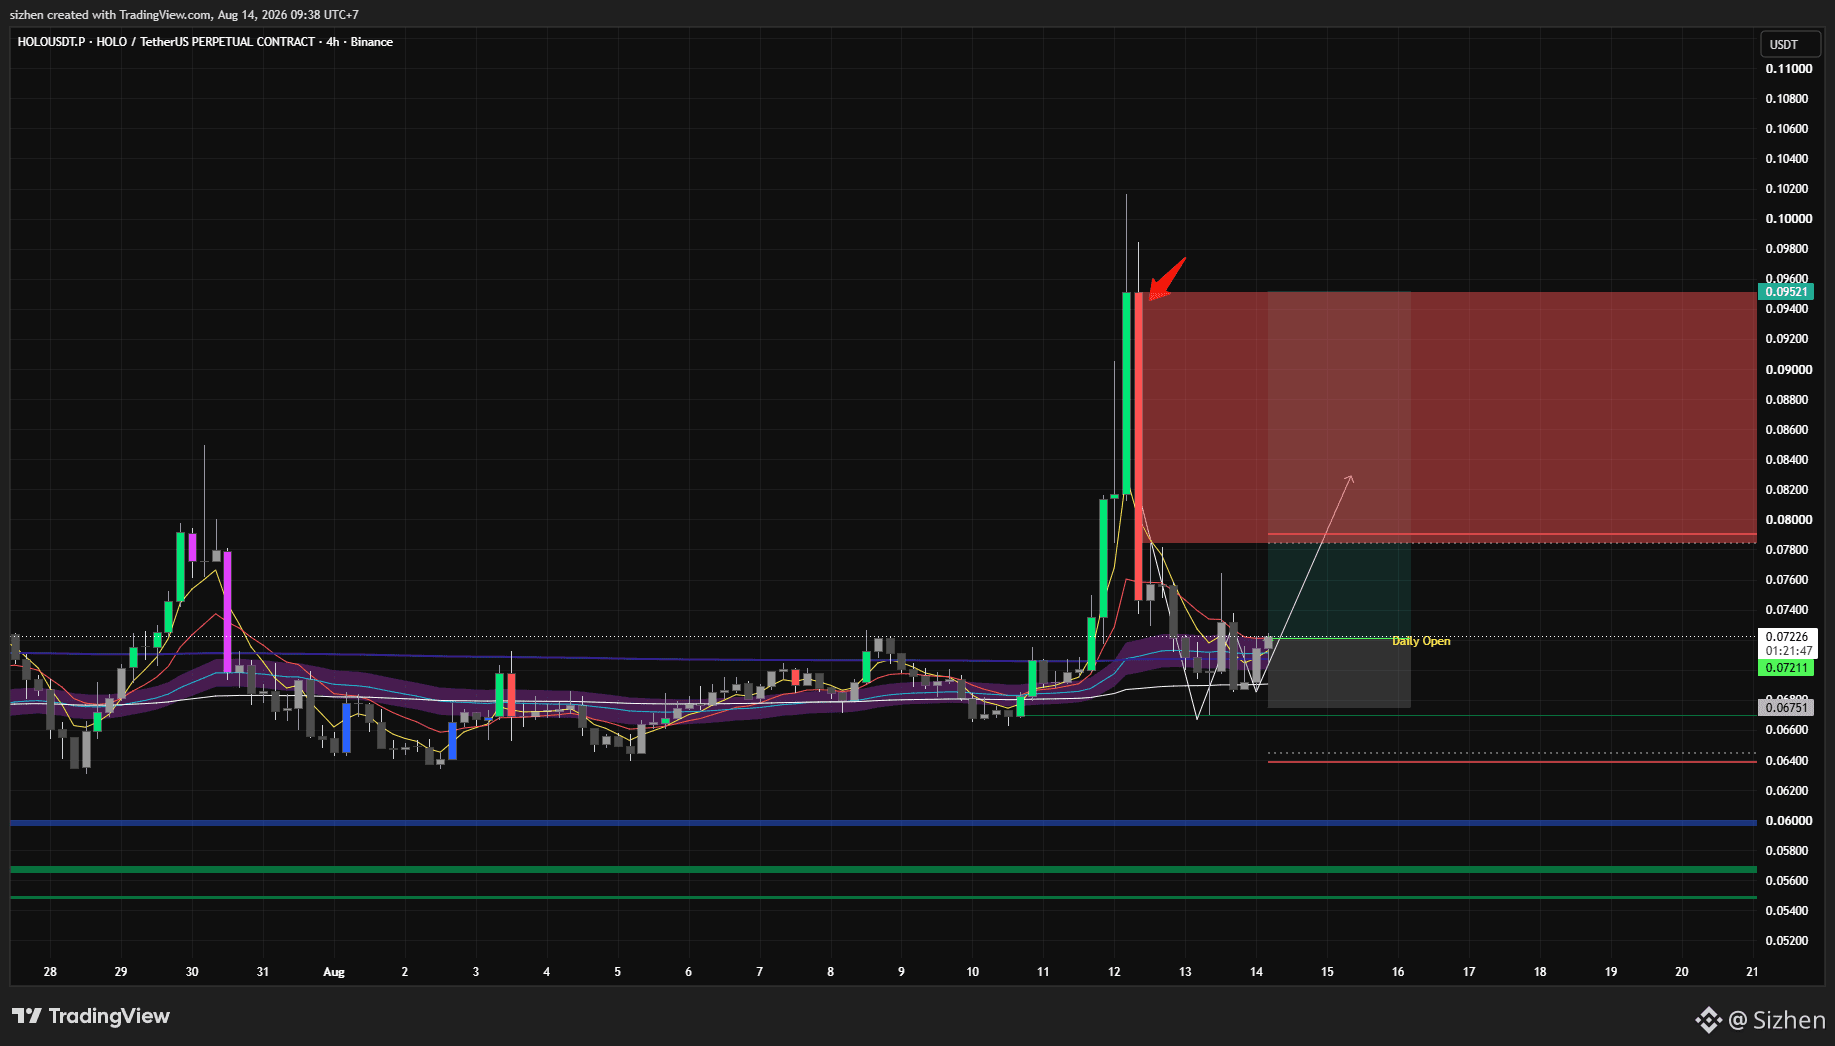
BullishOpen a long position on $HOLO again, on the 4-hour chart, if the price does not fall any further than it did yesterday, it is possible that the price will rise by at least half the length of the red vector candle, or even rise all the way to the high.
The setup is active: the entry point, stop-loss and take-profit levels are shown on the chart I have shared.
The setup is active: the entry point, stop-loss and take-profit levels are shown on the chart I have shared.
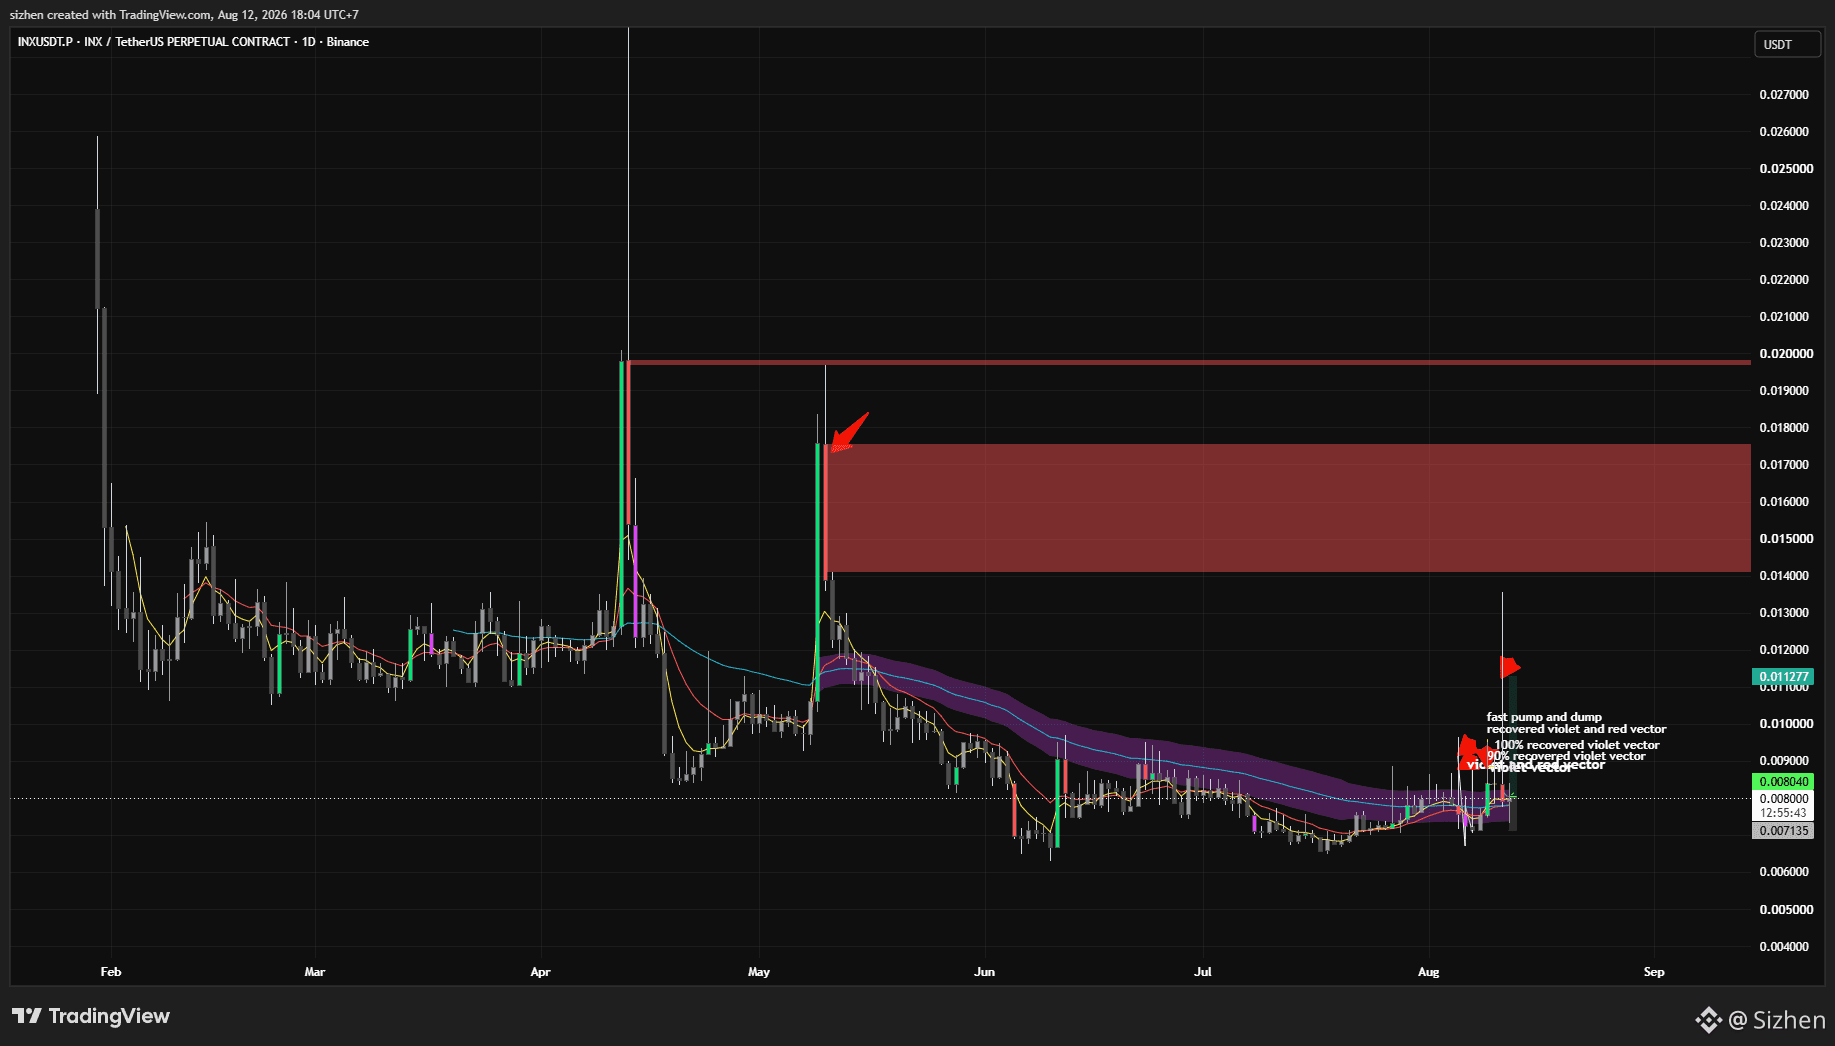
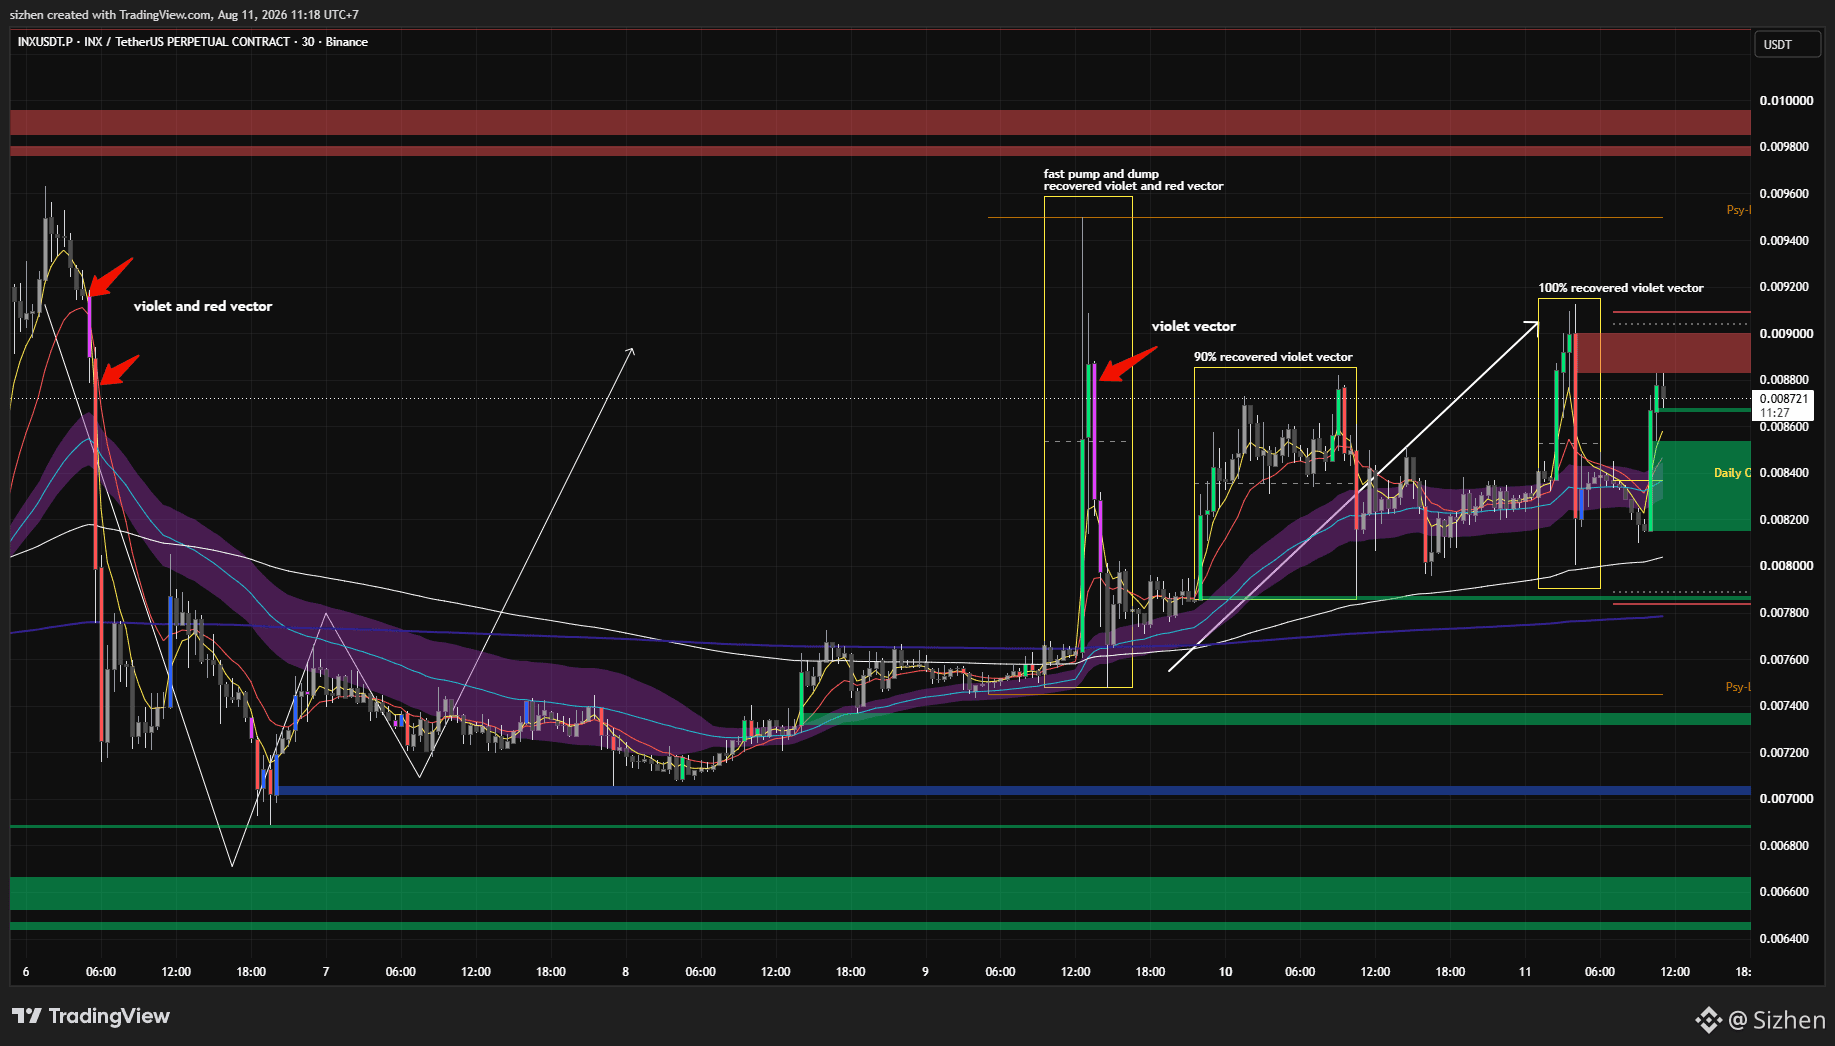
I’ve also been holding a long position in the INX for the past few days, and it’s still running
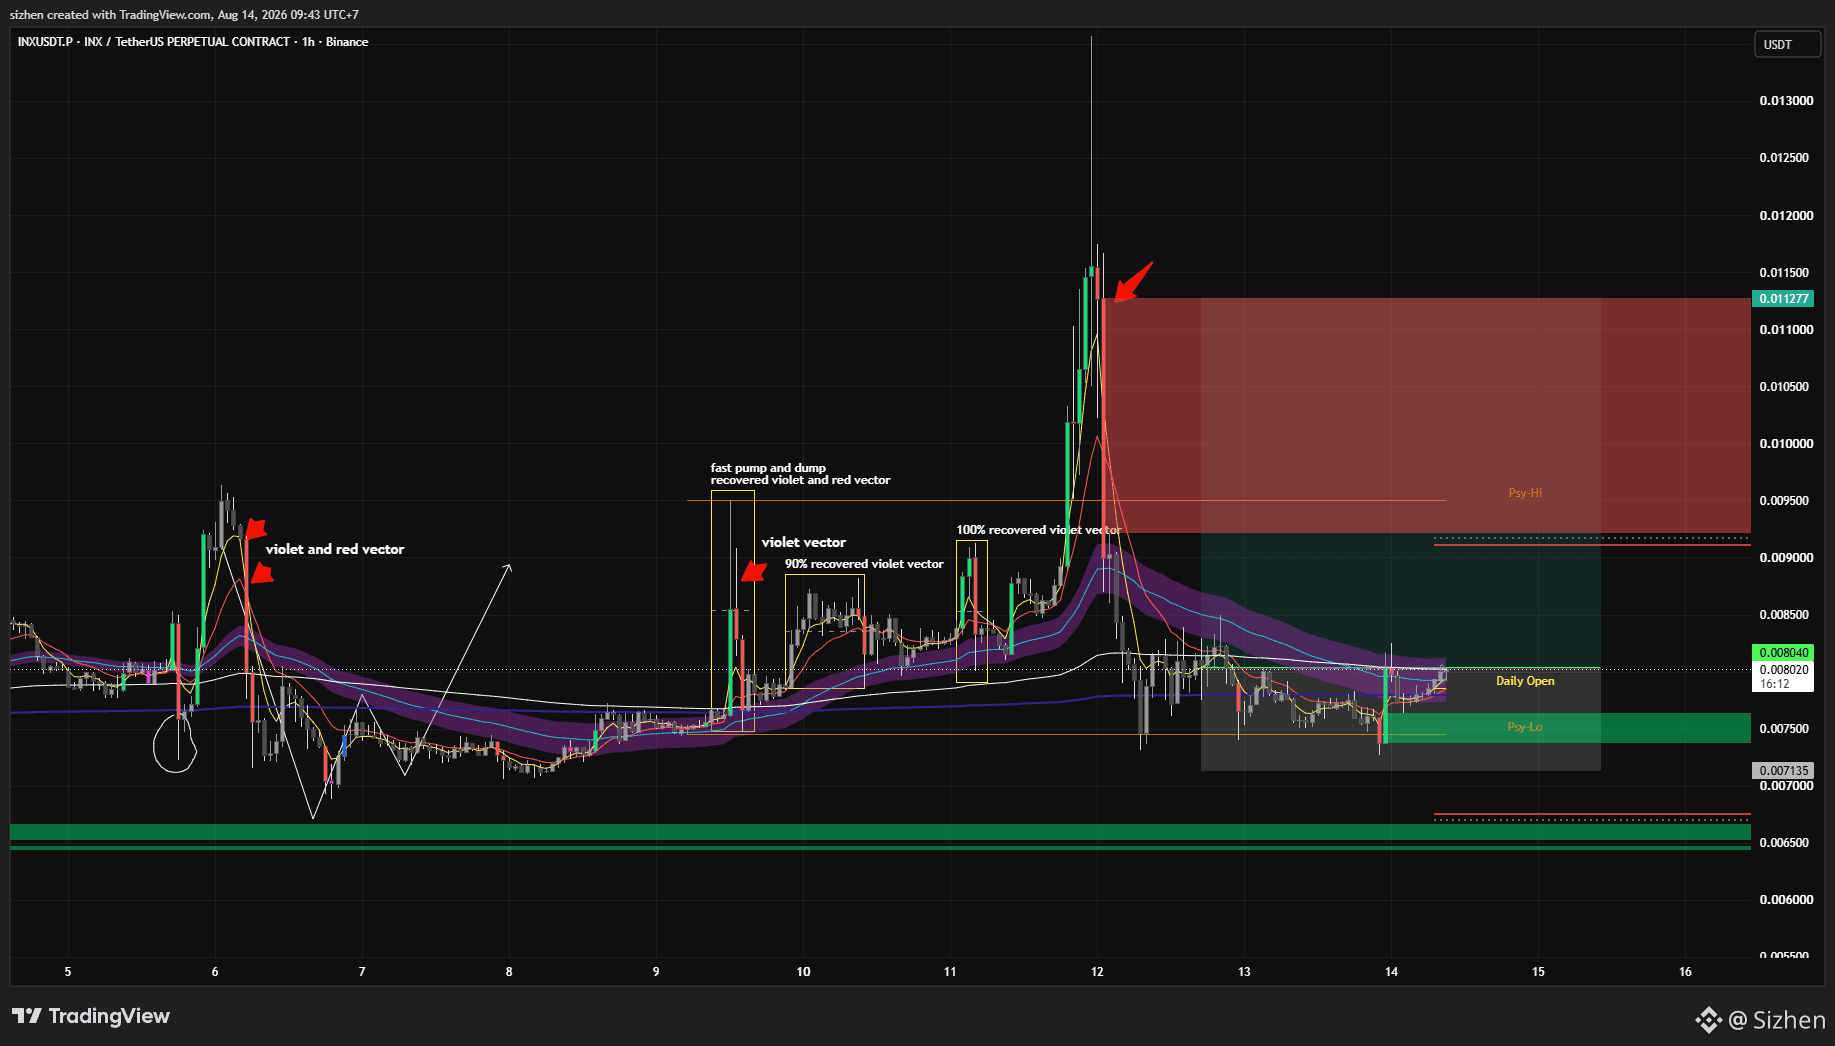
Open a long position on $HOLO again, on the 4-hour chart, if the price does not fall any further than it did yesterday, it is possible that the price will rise by at least half the length of the red vector candle, or even rise all the way to the high.
The setup is active: the entry point, stop-loss and take-profit levels are shown on the chart I have shared.
The setup is active: the entry point, stop-loss and take-profit levels are shown on the chart I have shared.
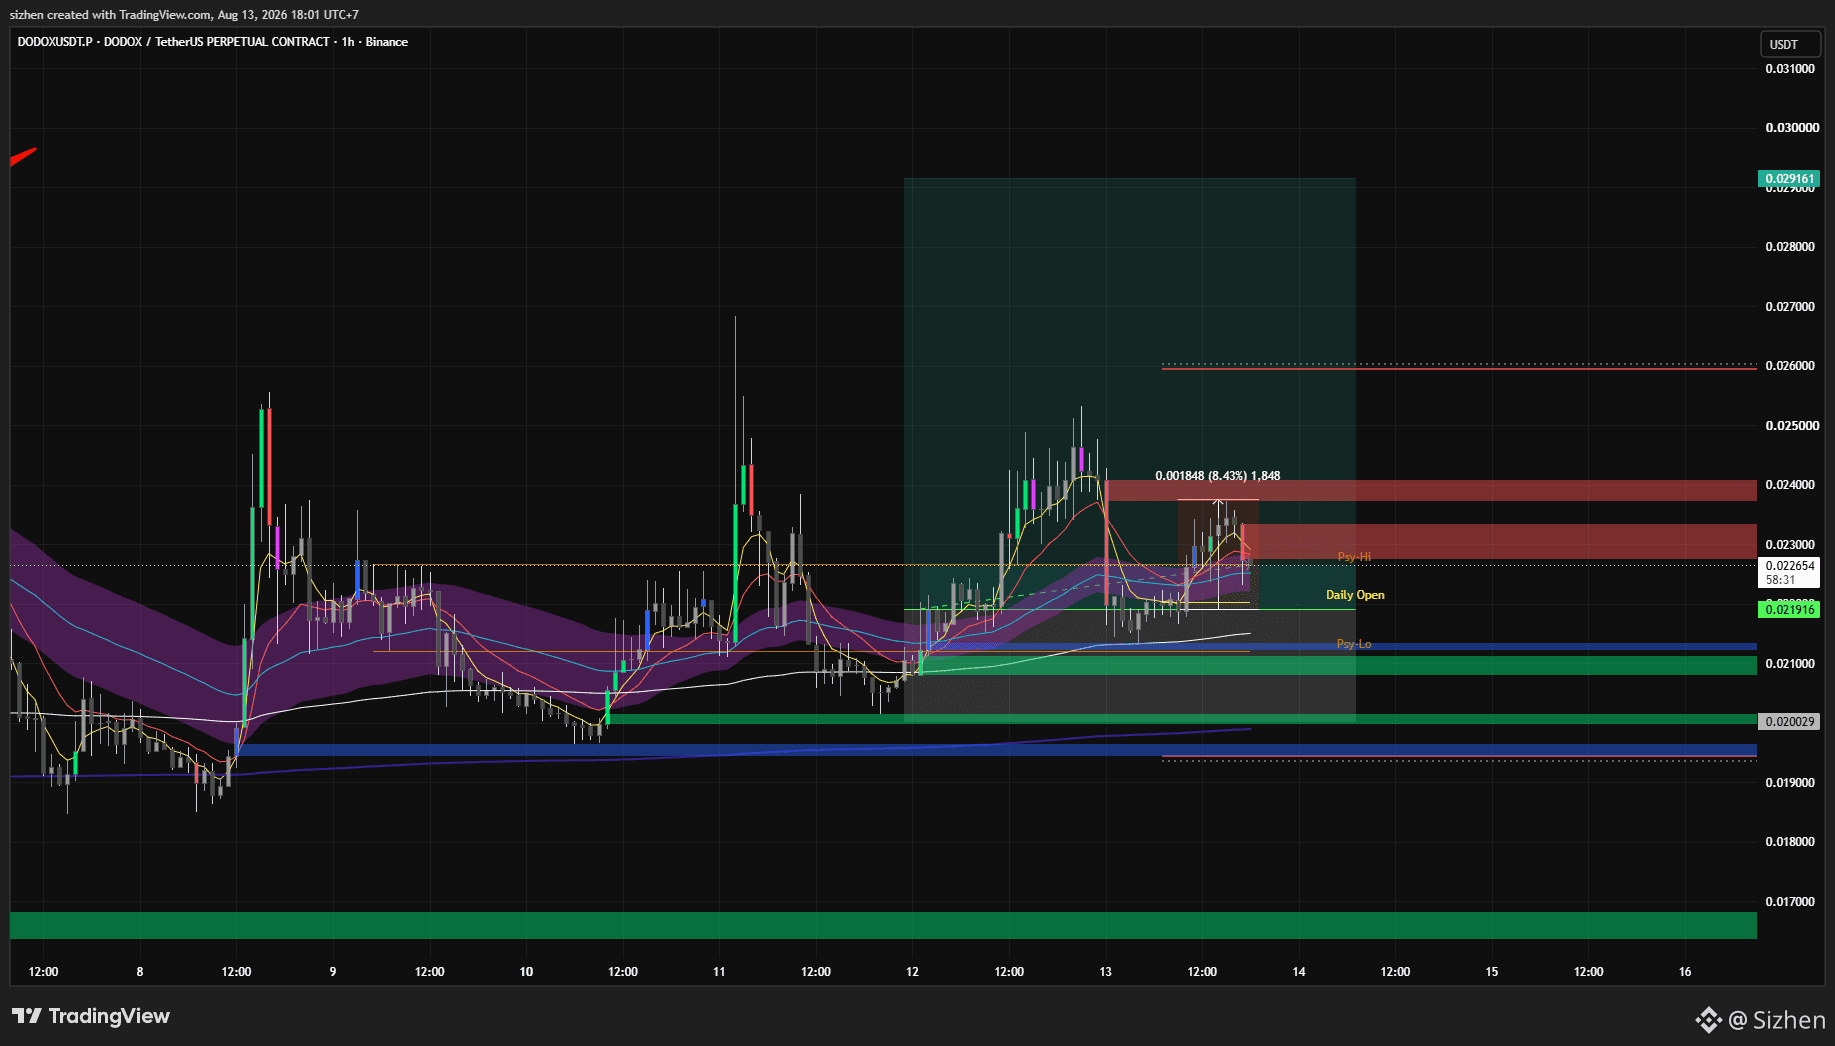
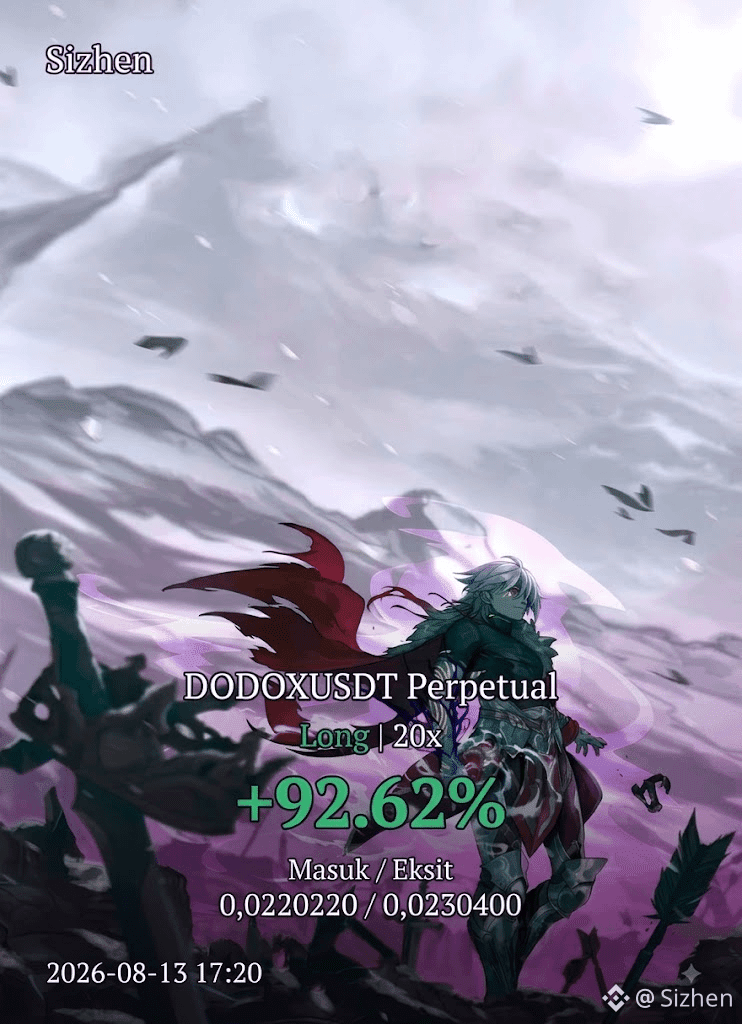
$DODOX rise by 8% and I’ve already closed my long position, making a small profit
Sizhen
·
--
BullishI’ve re-entered a long position on $DODOX and am targeting the same violet vector candle, yesterday I closed the position and made a bit of profit on $DODOX . I hope those of you following this setup have done the same
I’ve re-entered a long position on $DODOX and am targeting the same violet vector candle, yesterday I closed the position and made a bit of profit on $DODOX . I hope those of you following this setup have done the same
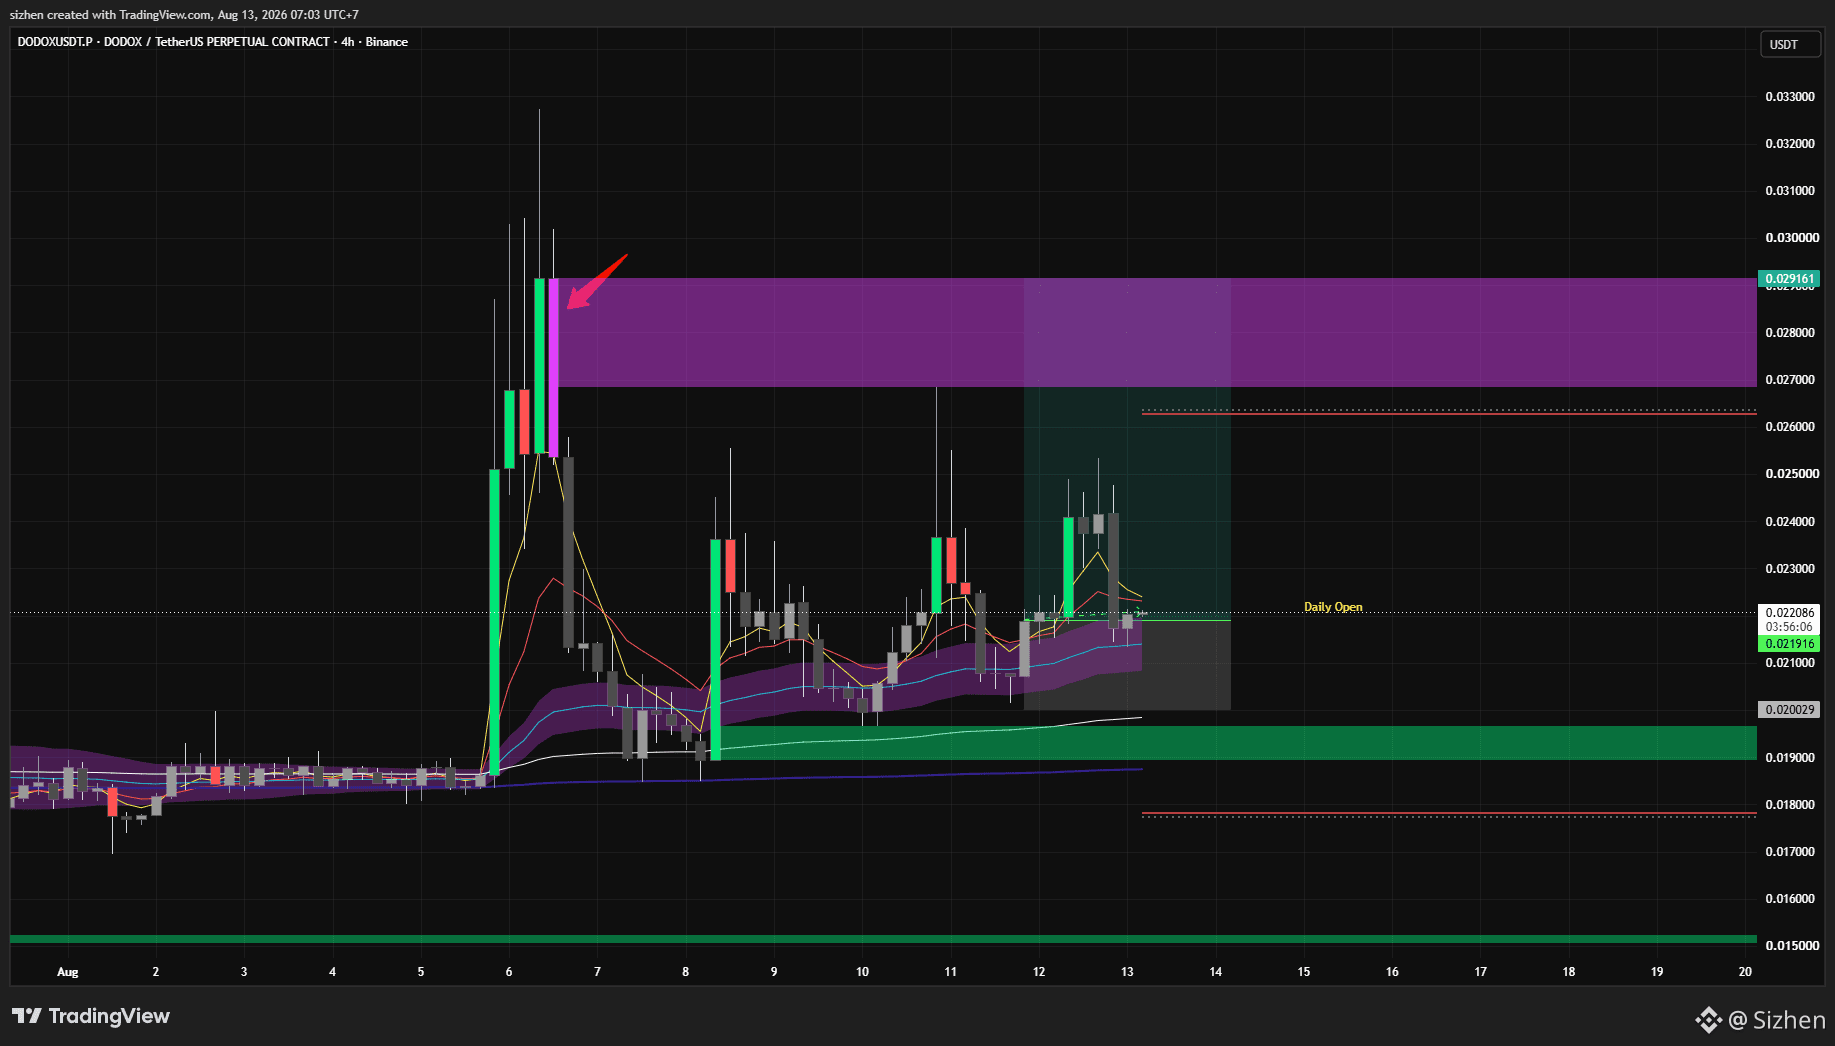

Close this position, wait a little longer, and enter a long position again
Sizhen
·
--
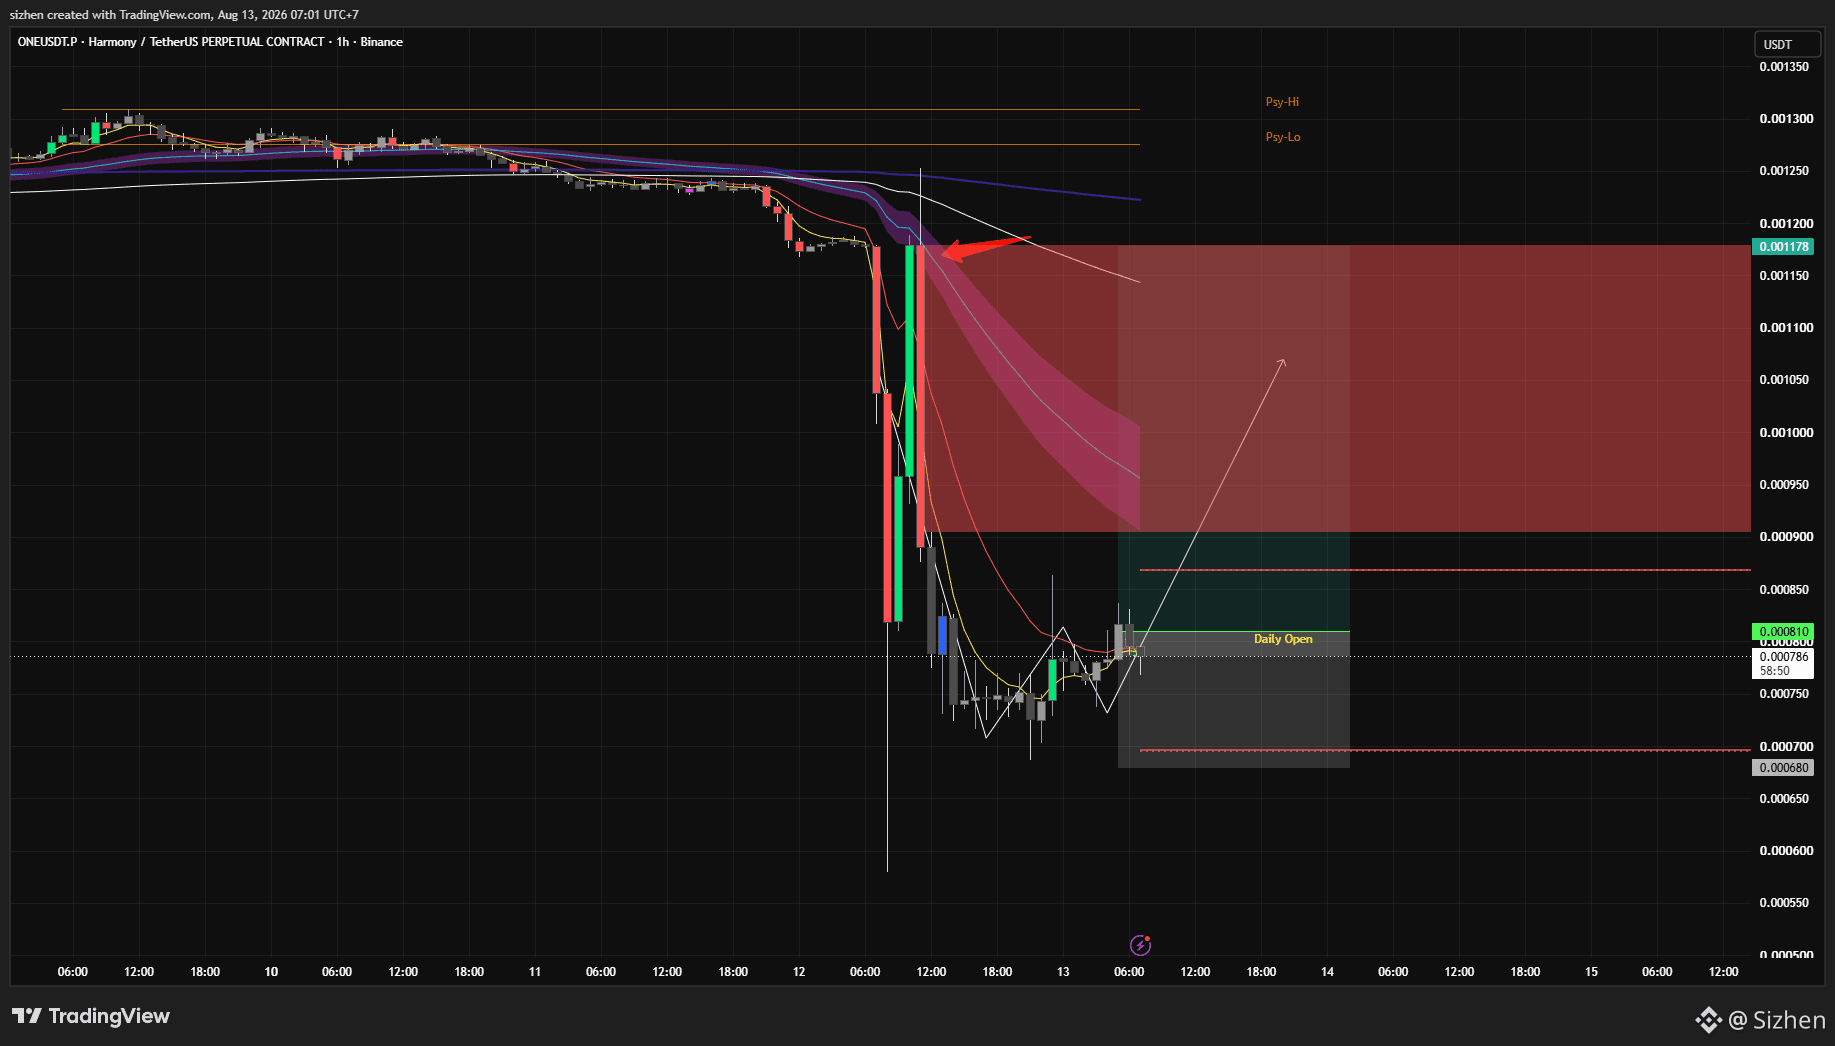
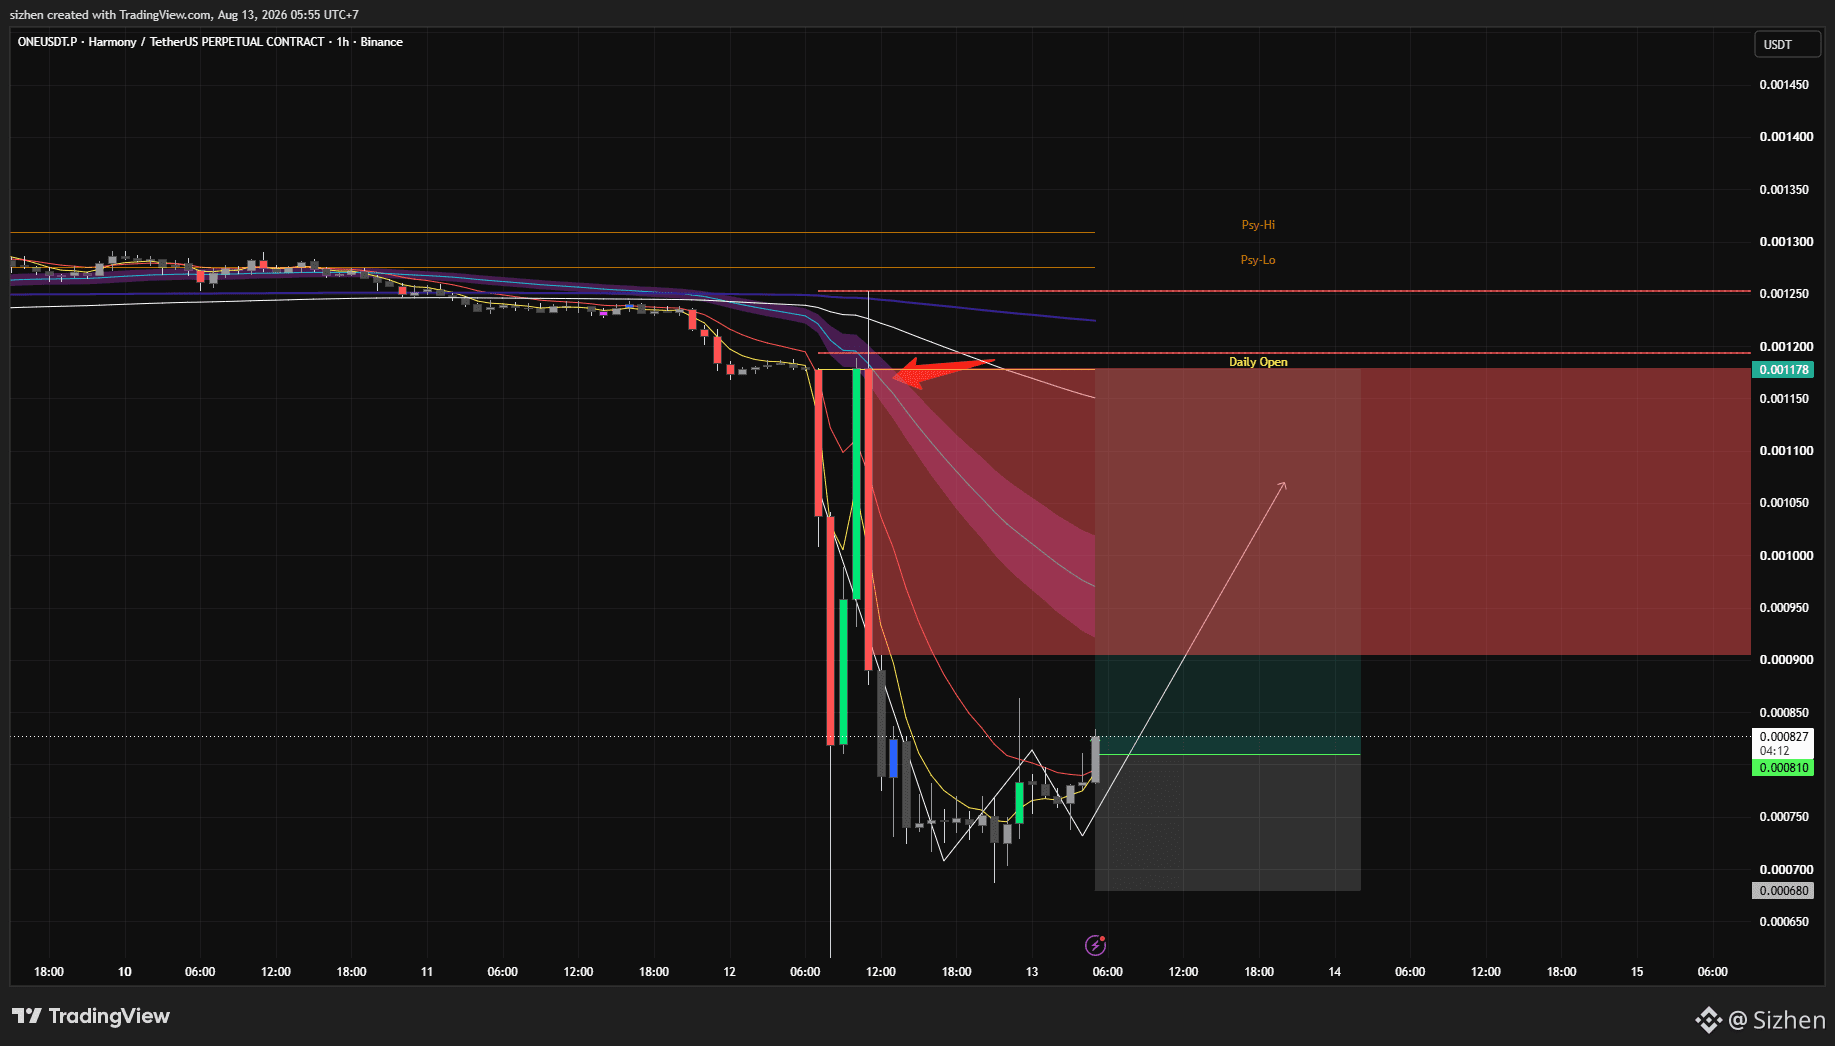
Bullish$ONE looks promising if the price can still rise quickly from here without consolidating first; this would result in a flash pump towards the red vector.
$ONE looks promising if the price can still rise quickly from here without consolidating first; this would result in a flash pump towards the red vector.
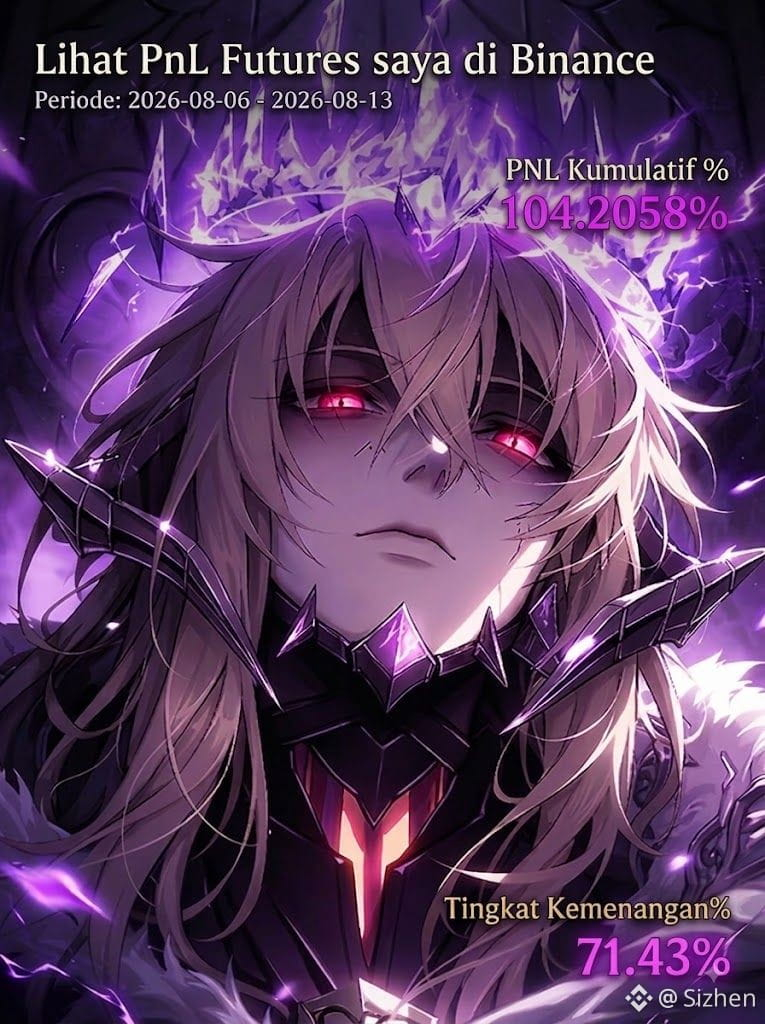
My trading performance over the last 7 days
I’ll try to keep it up like this, but as this is a world of probabilities, it won’t be quite that smooth; still, I’ll try to remain as consistent as I have been over the past 7 days
I’ve got quite a lot from $BLESS , $INX , $DODOX and more
I’ll try to keep it up like this, but as this is a world of probabilities, it won’t be quite that smooth; still, I’ll try to remain as consistent as I have been over the past 7 days
I’ve got quite a lot from $BLESS , $INX , $DODOX and more
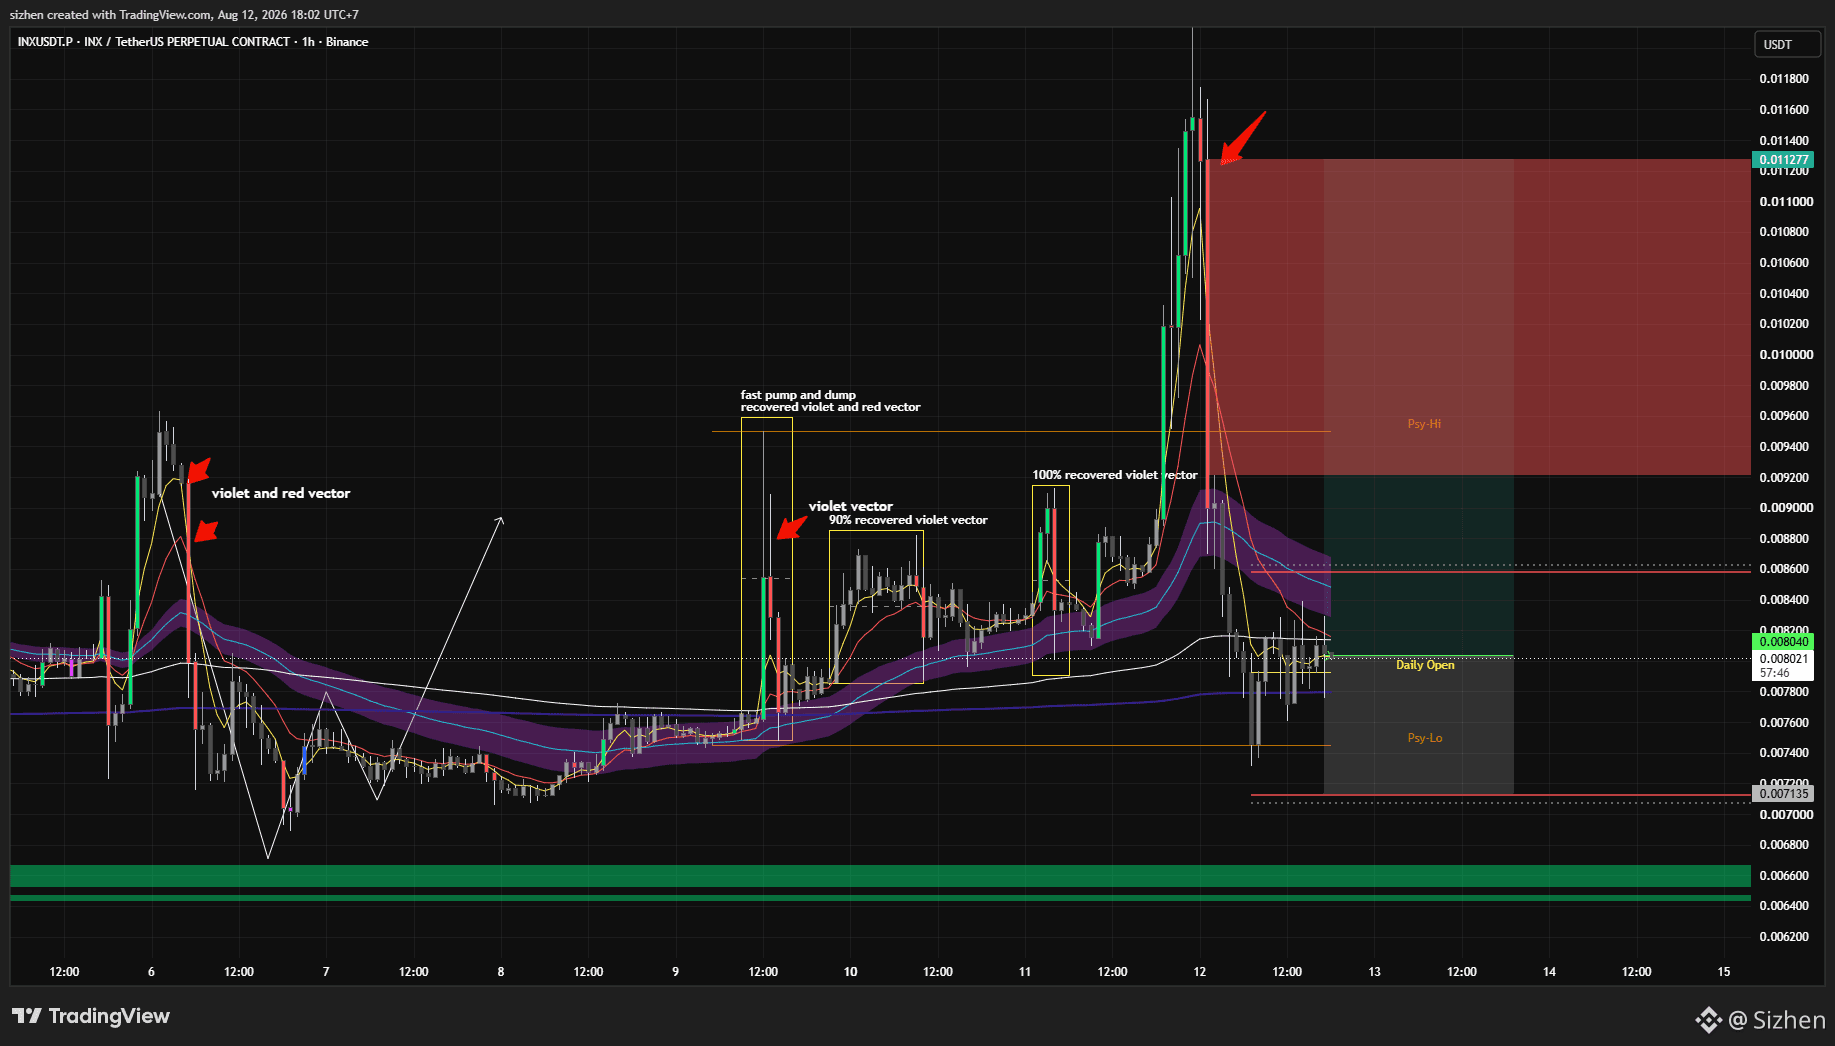
Once again, the $INX setup may move sideways for a few days before the price rises, or perhaps even longer than that
and $INX has some unresolved issues up there – be careful
and $INX has some unresolved issues up there – be careful
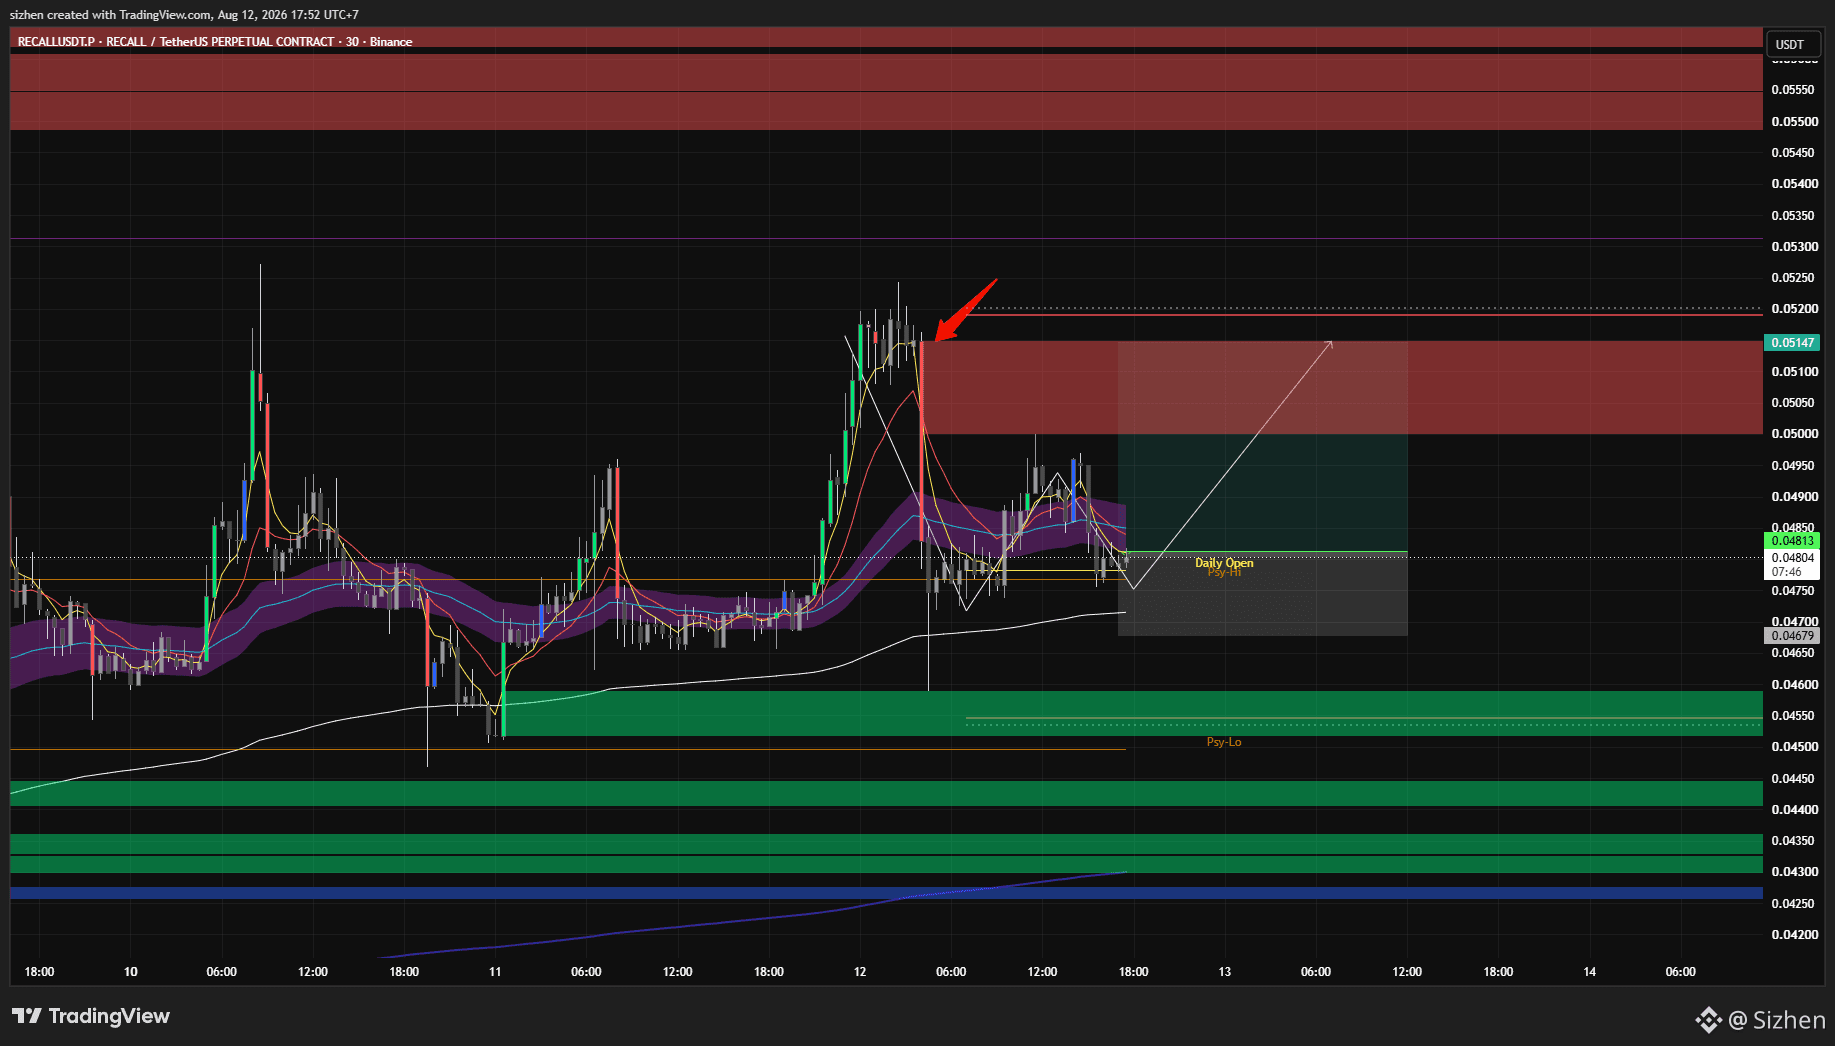
$RECALL is forming a W pattern and holding at the daily open if the price continues to hold, it should rise, targeting the red vector candle, that would be good
if you wish to follow the entry, the stop-loss and take-profit levels are already marked on the chart
if you wish to follow the entry, the stop-loss and take-profit levels are already marked on the chart
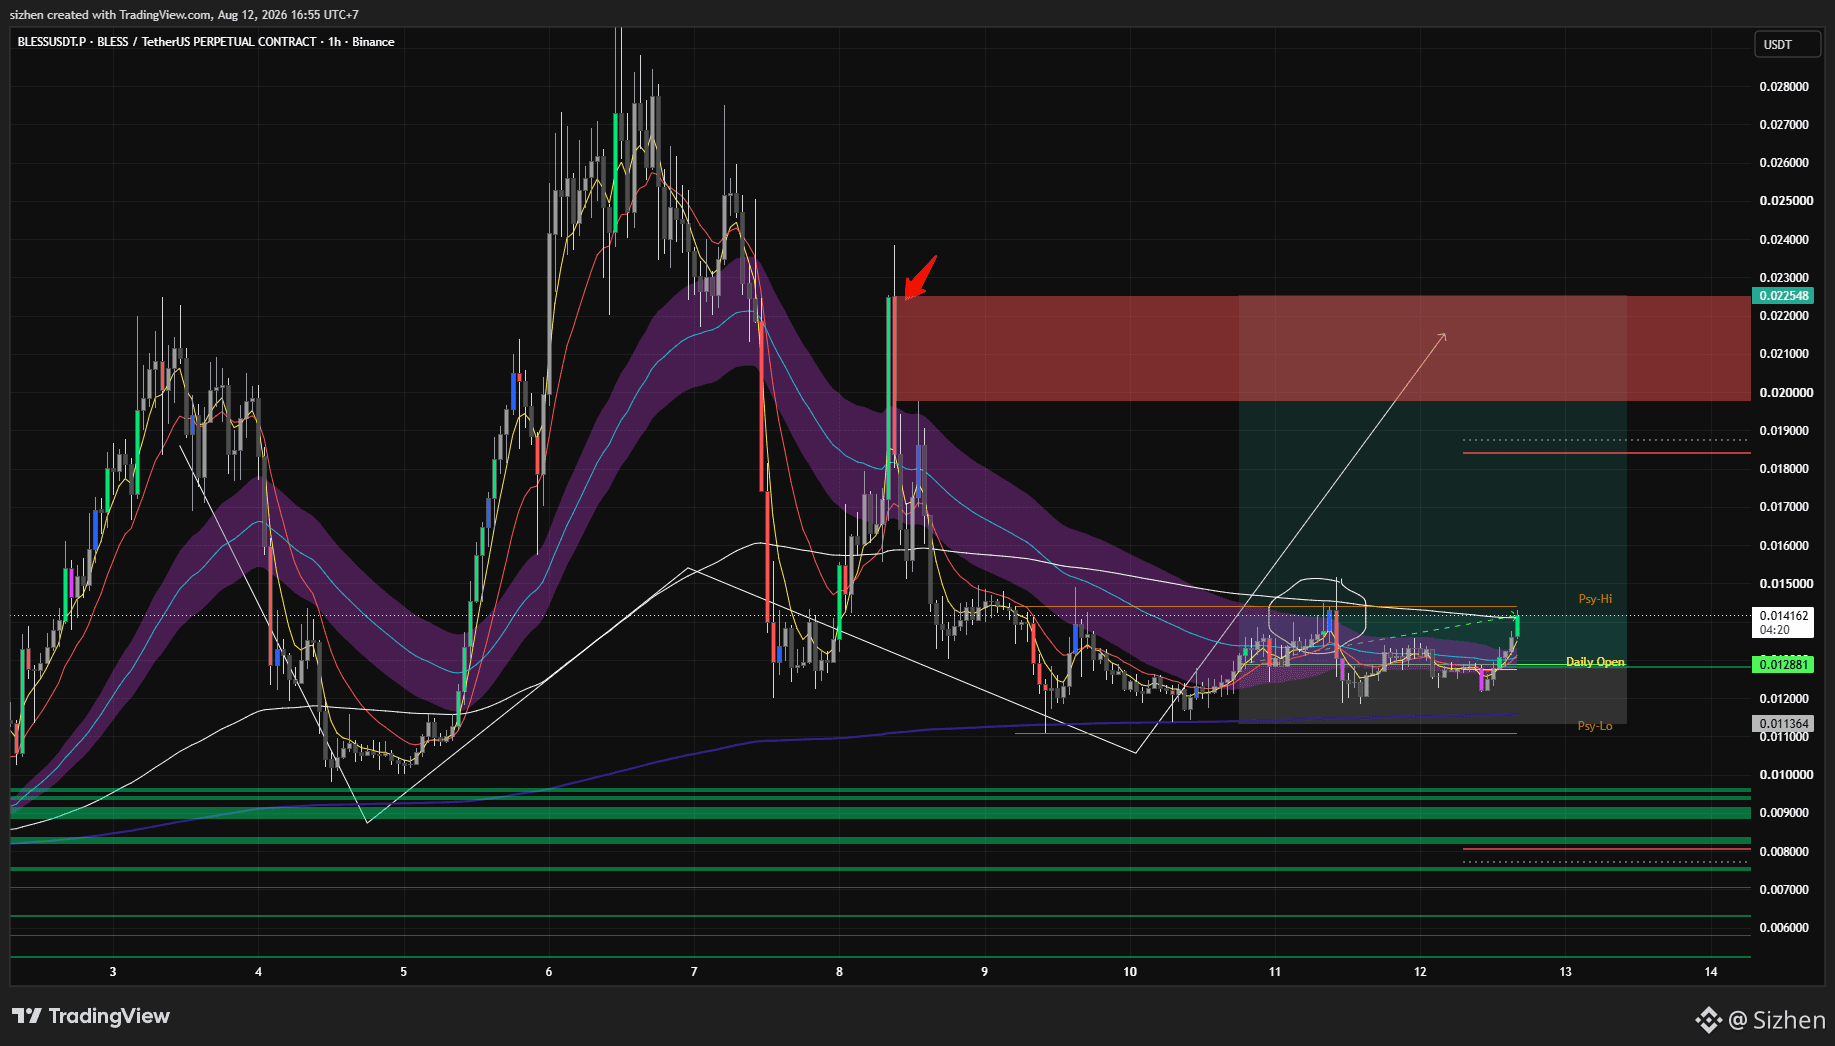
$BLESS has finally made a move if the price sees a significant move from here, we might see the red vector close very soon
Sizhen
·
--
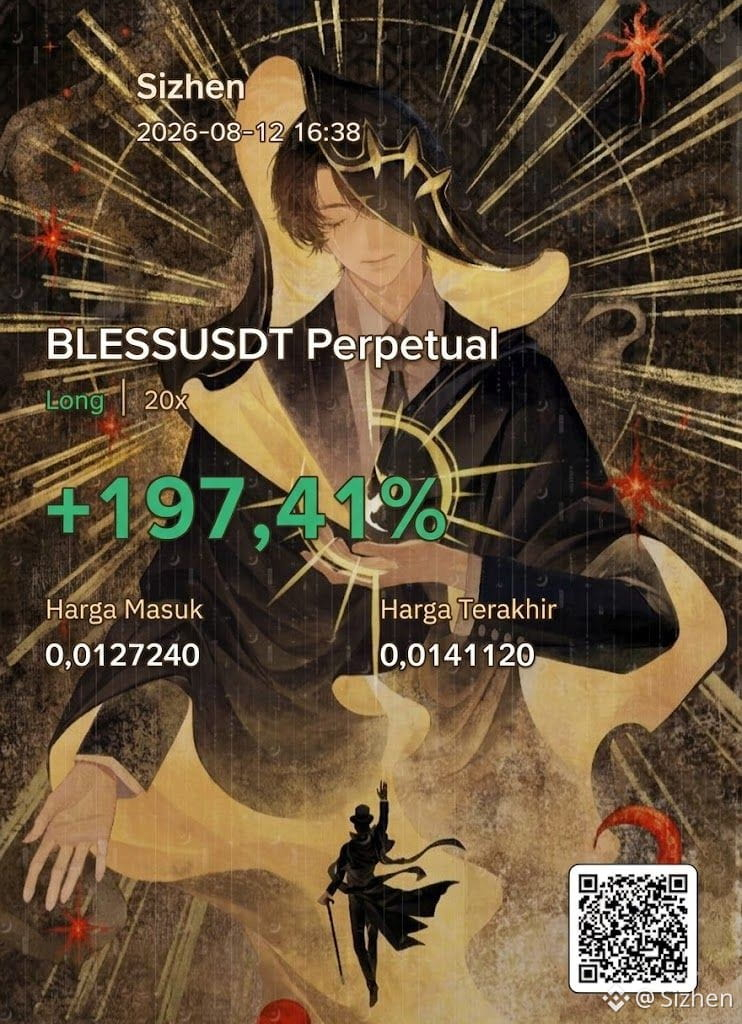
BullishI’ve opened another long position on $BLESS . Let’s see how the market reacts next
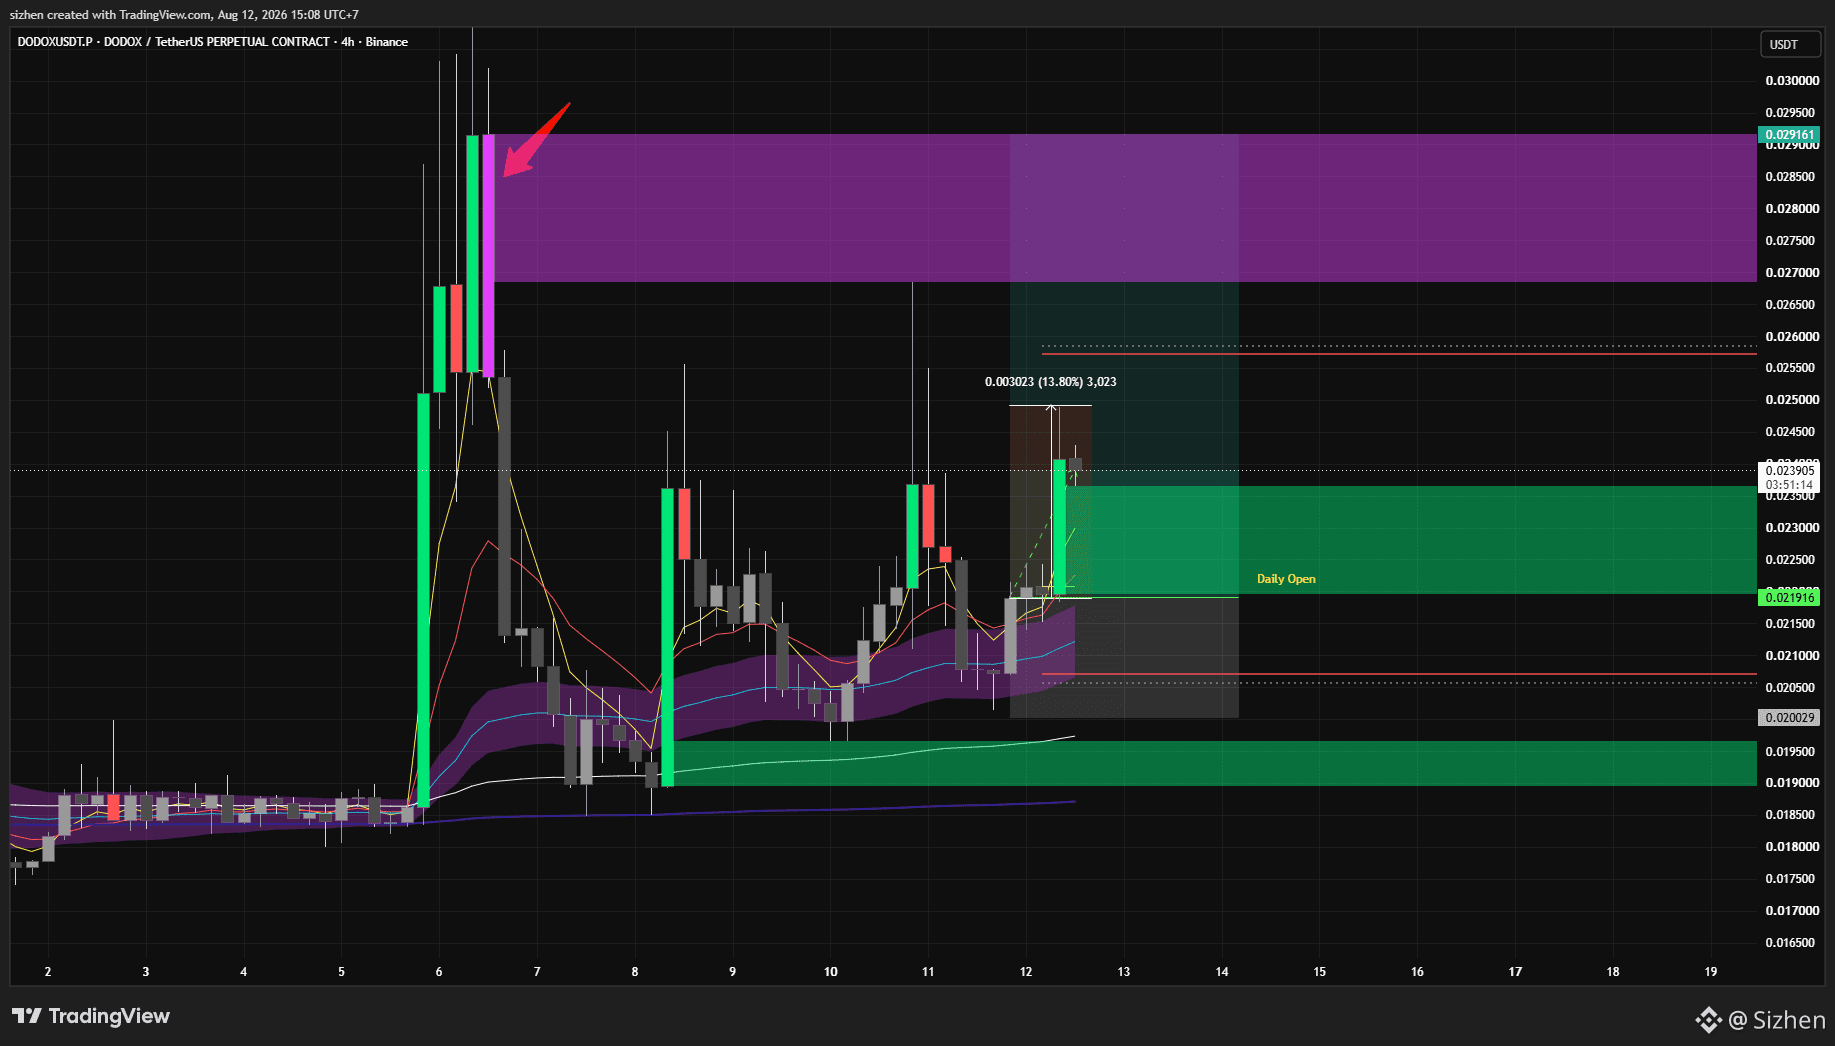
$DODOX has risen by 13% from the entry point in the setup congratulations to those who followed this setup and made a profit
Sizhen
·
--
Bullish$DODOX some of the price action here is quite interesting from here, I’ll reopen my long position, targeting the violet vector candle as my take profit, with the stoploss below the 50 EMA
$DODOX some of the price action here is quite interesting from here, I’ll reopen my long position, targeting the violet vector candle as my take profit, with the stoploss below the 50 EMA
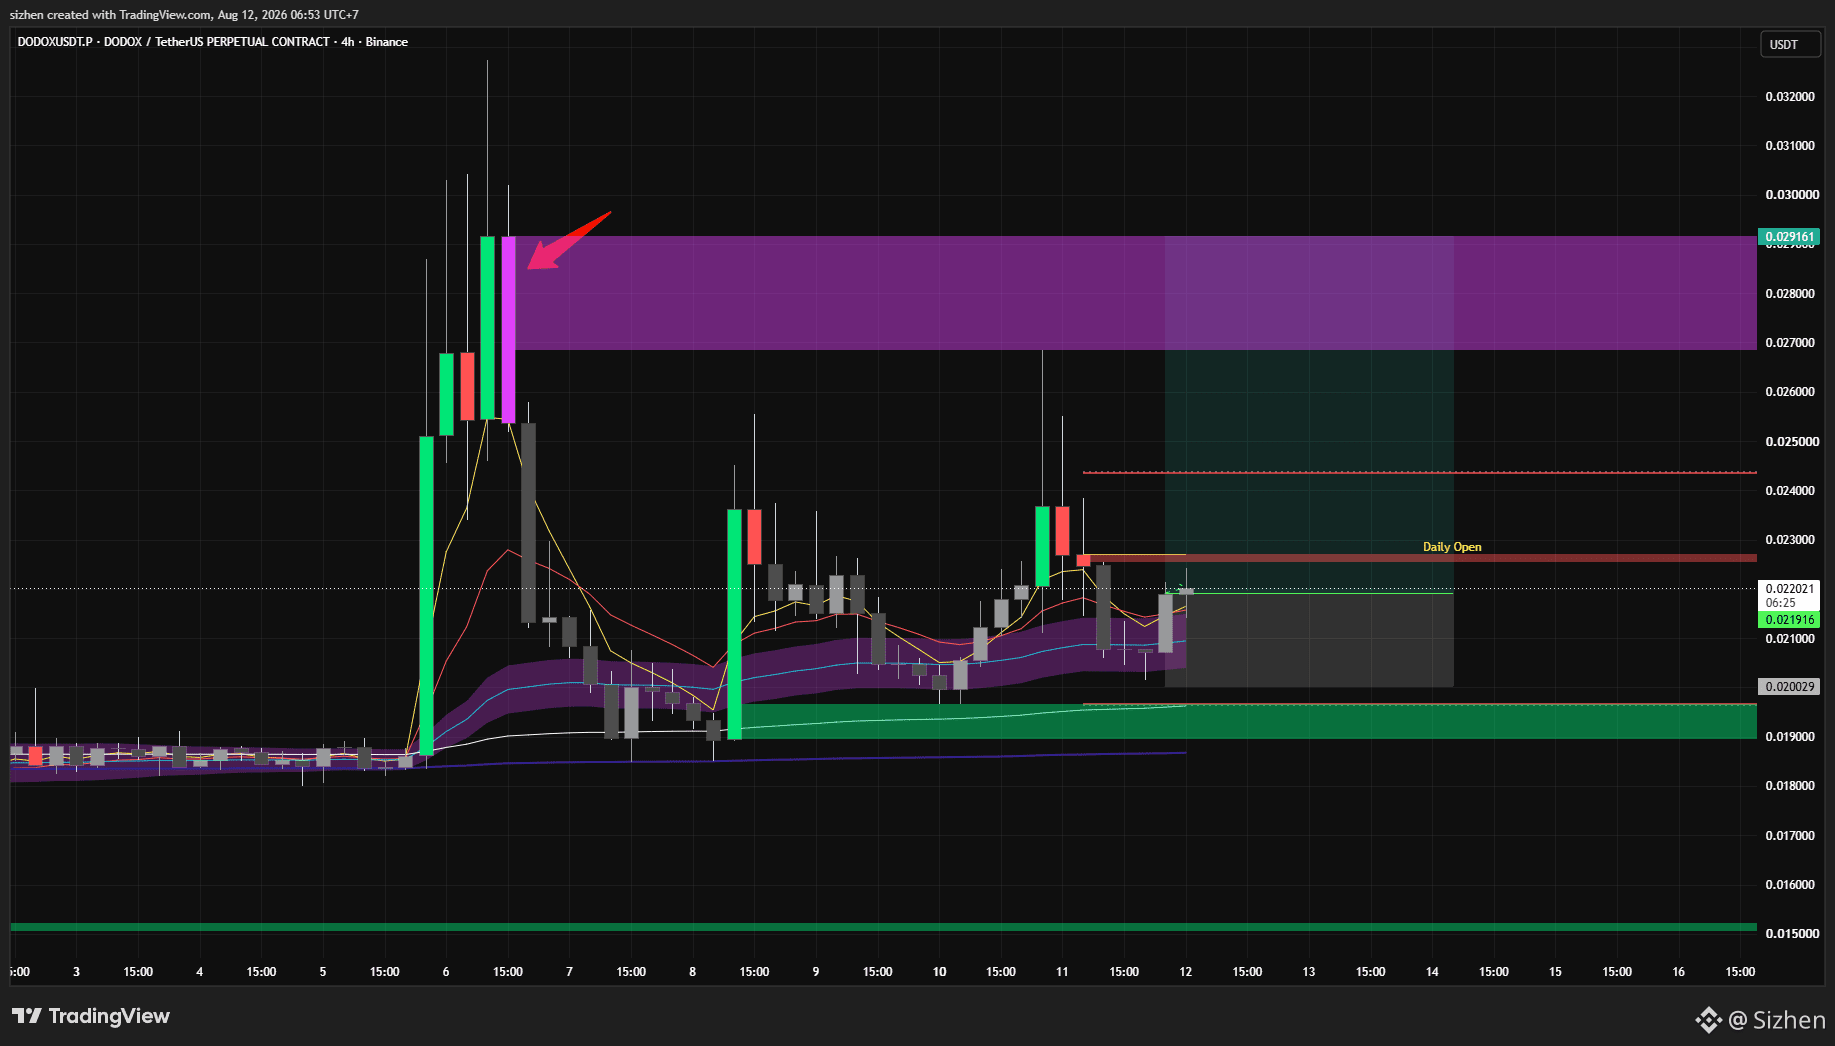
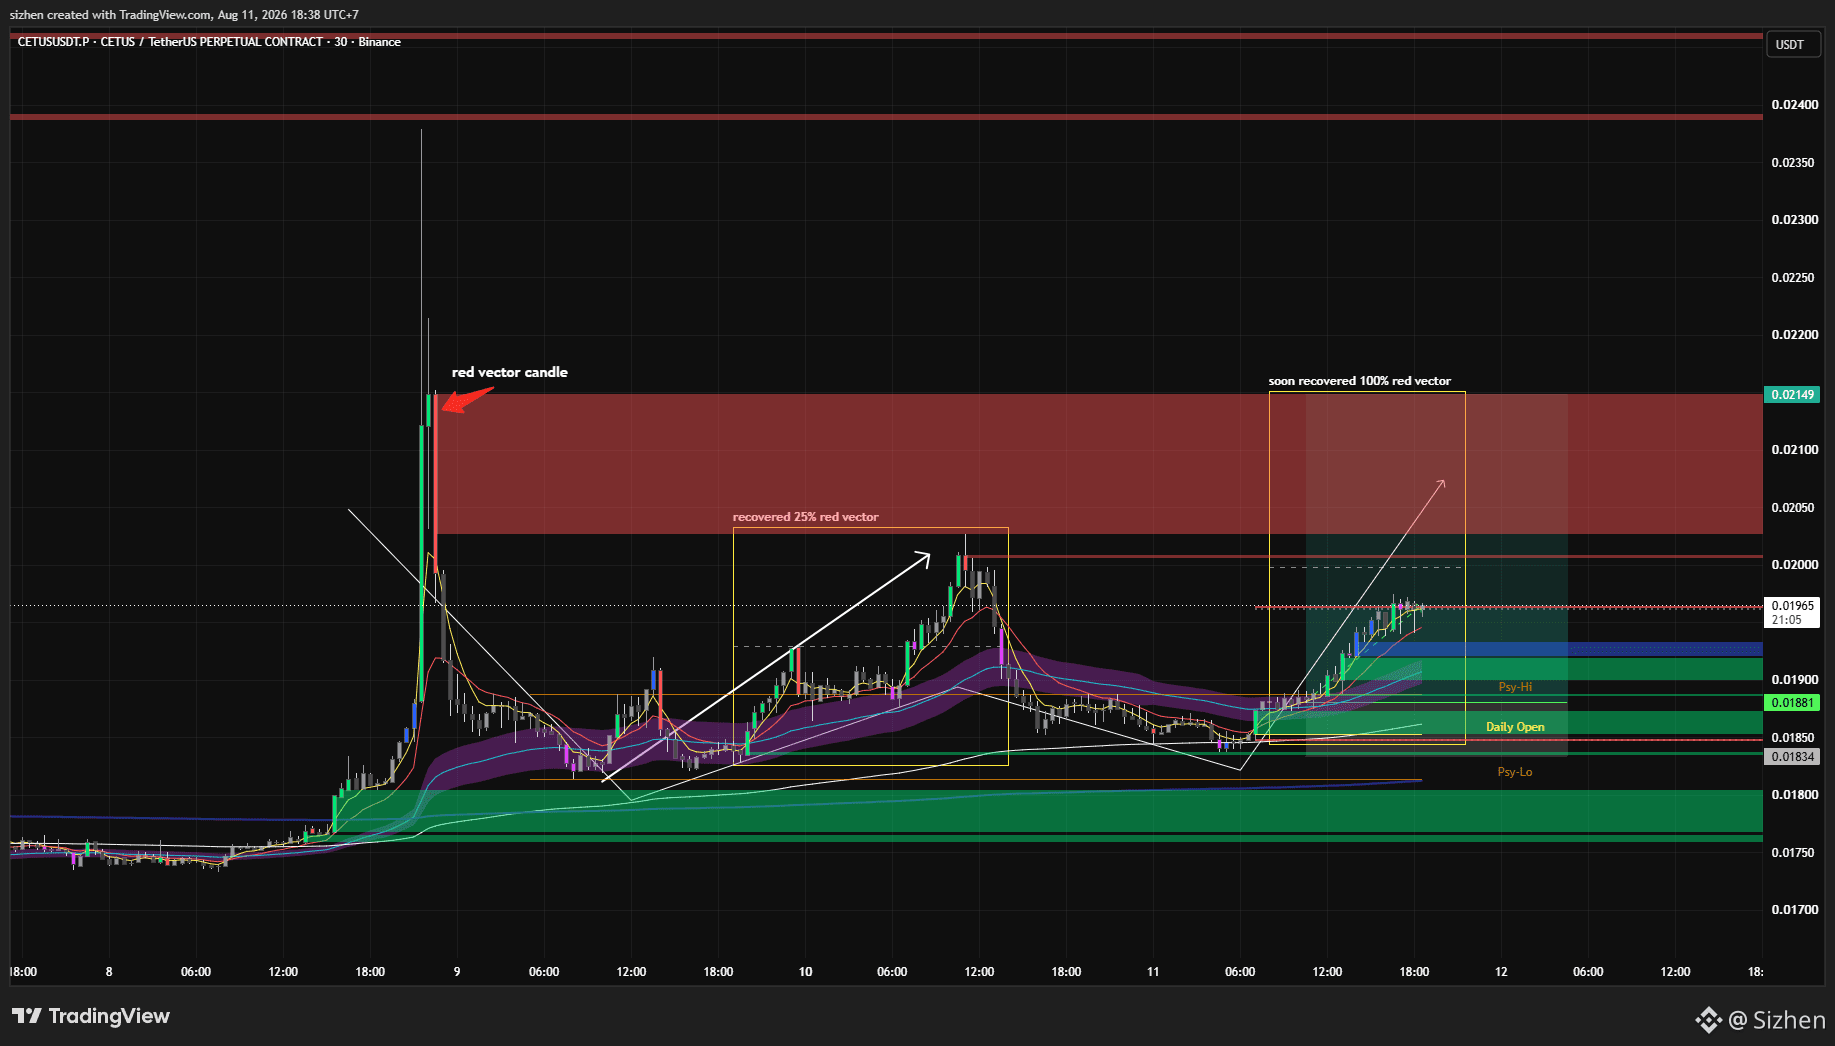
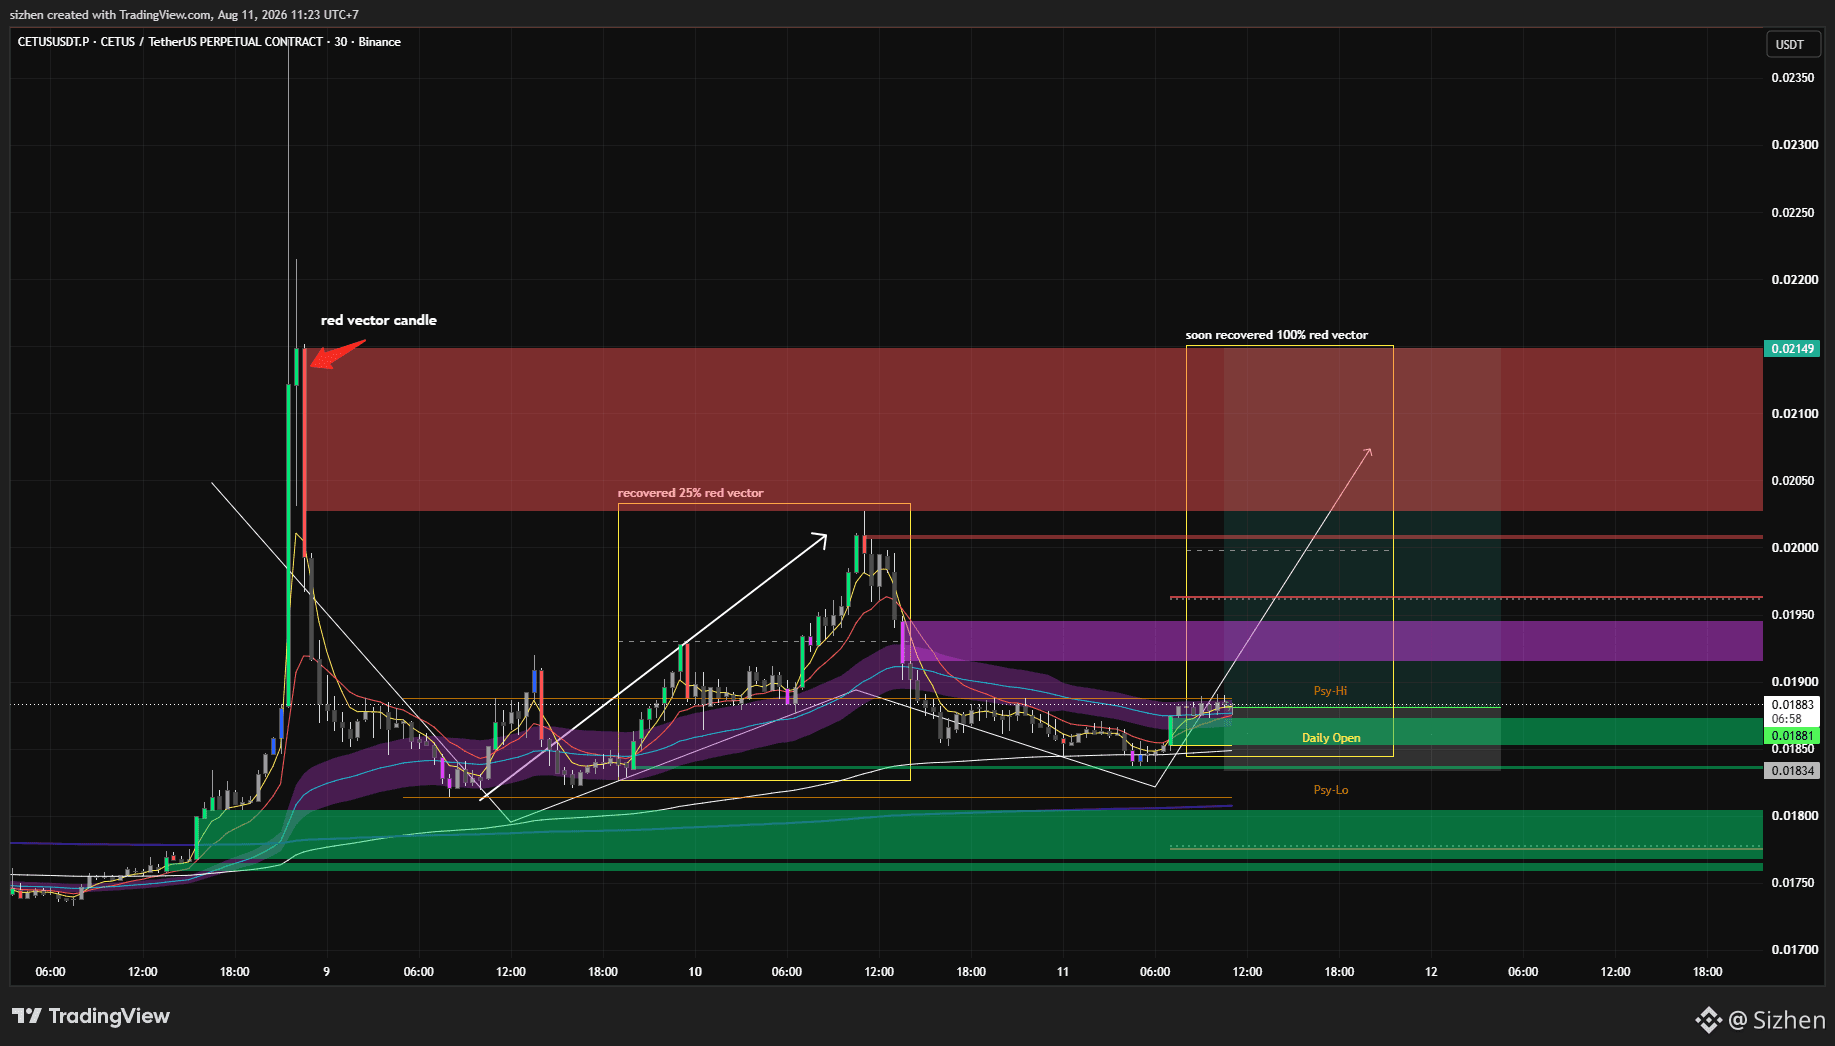
$CETUS has risen by 5% from the entry point of the setup, the price may well continue to rise, albeit not rapidly, but the red vector candle should recover fully
Sizhen
·
--
Bullish$CETUS It reminds me of the previous $INX flash pump and dump, after which it slowly climbed back up to the recovery vector above
$CETUS It reminds me of the previous $INX flash pump and dump, after which it slowly climbed back up to the recovery vector above
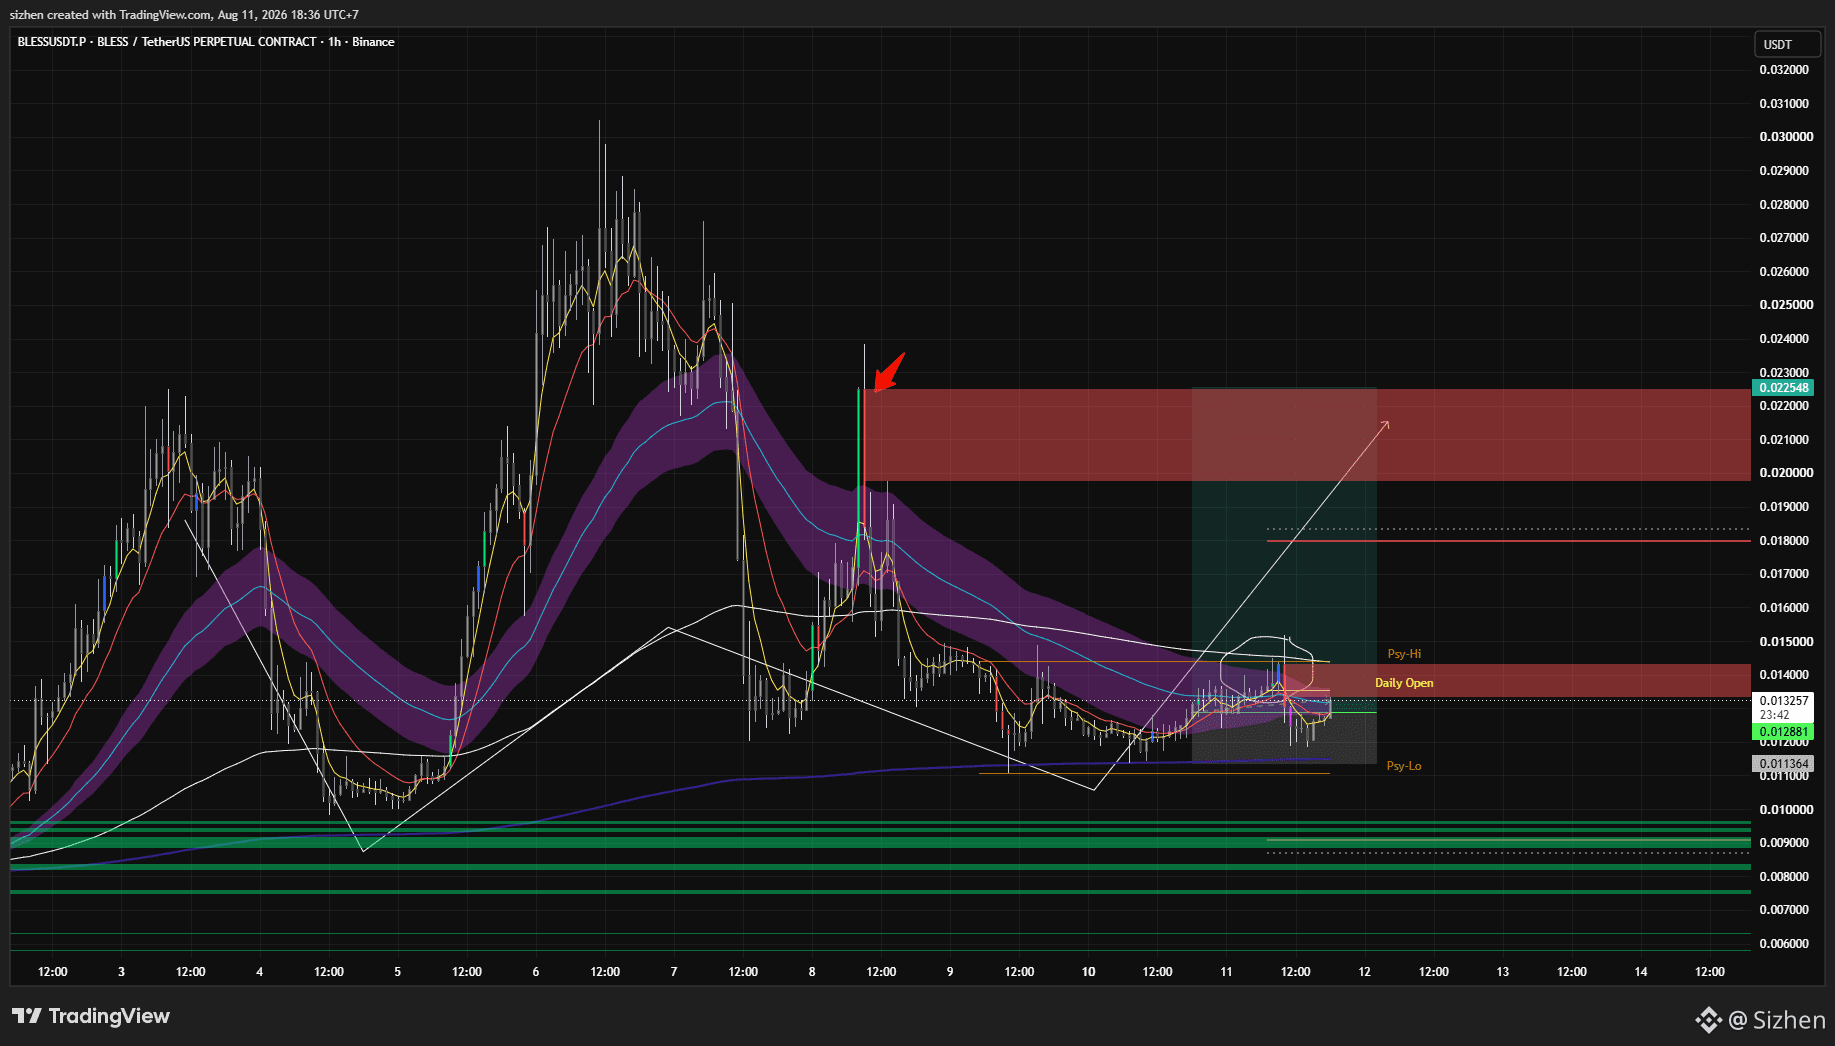
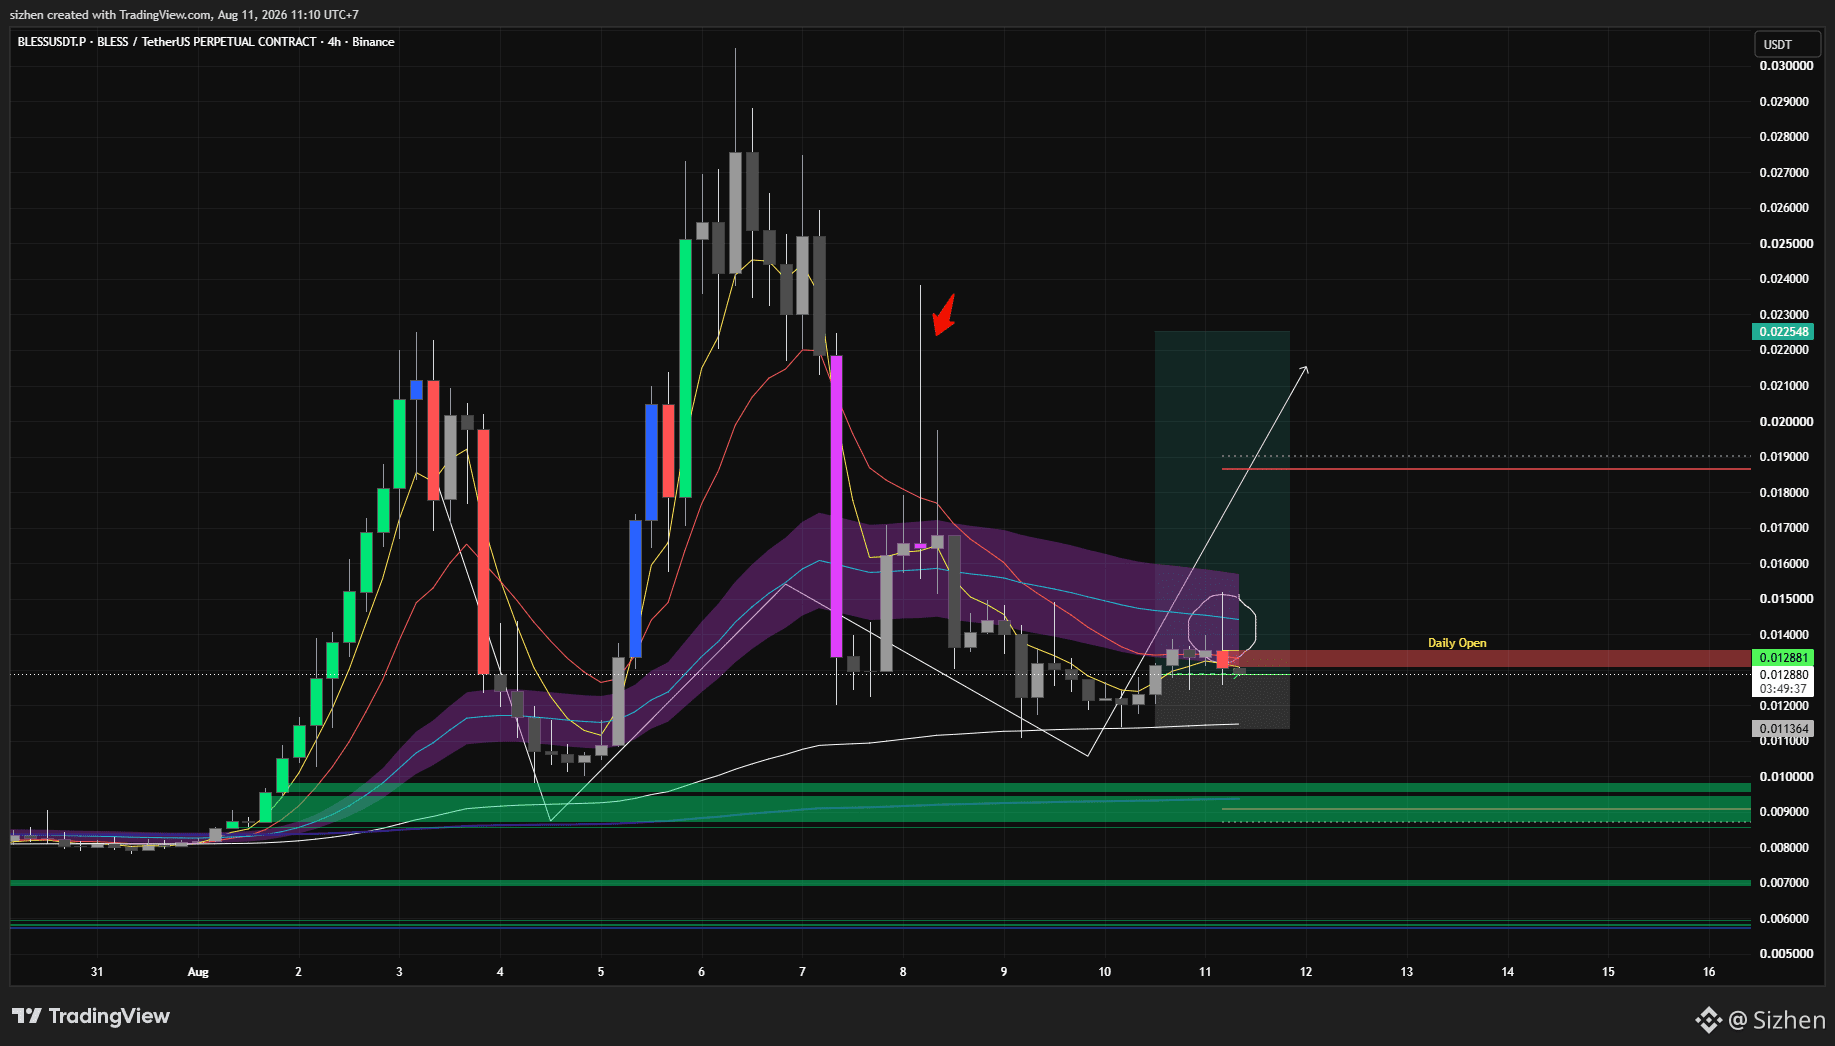
Update: $BLESS I will close my long position for the time being and wait for the next price action before going long again, as the price has rejected the 50 EMA and a red vector candle has formed
Sizhen
·
--
Bullish$BLESS on the 1-hour chart is currently just above the 50 EMA and below the 200 EMA it appears to be under some pressure here, but on the 4-hour chart, the price of $BLESS has touched the 50 EMA if the price can break through that resistance, we may see $BLESS rise once again
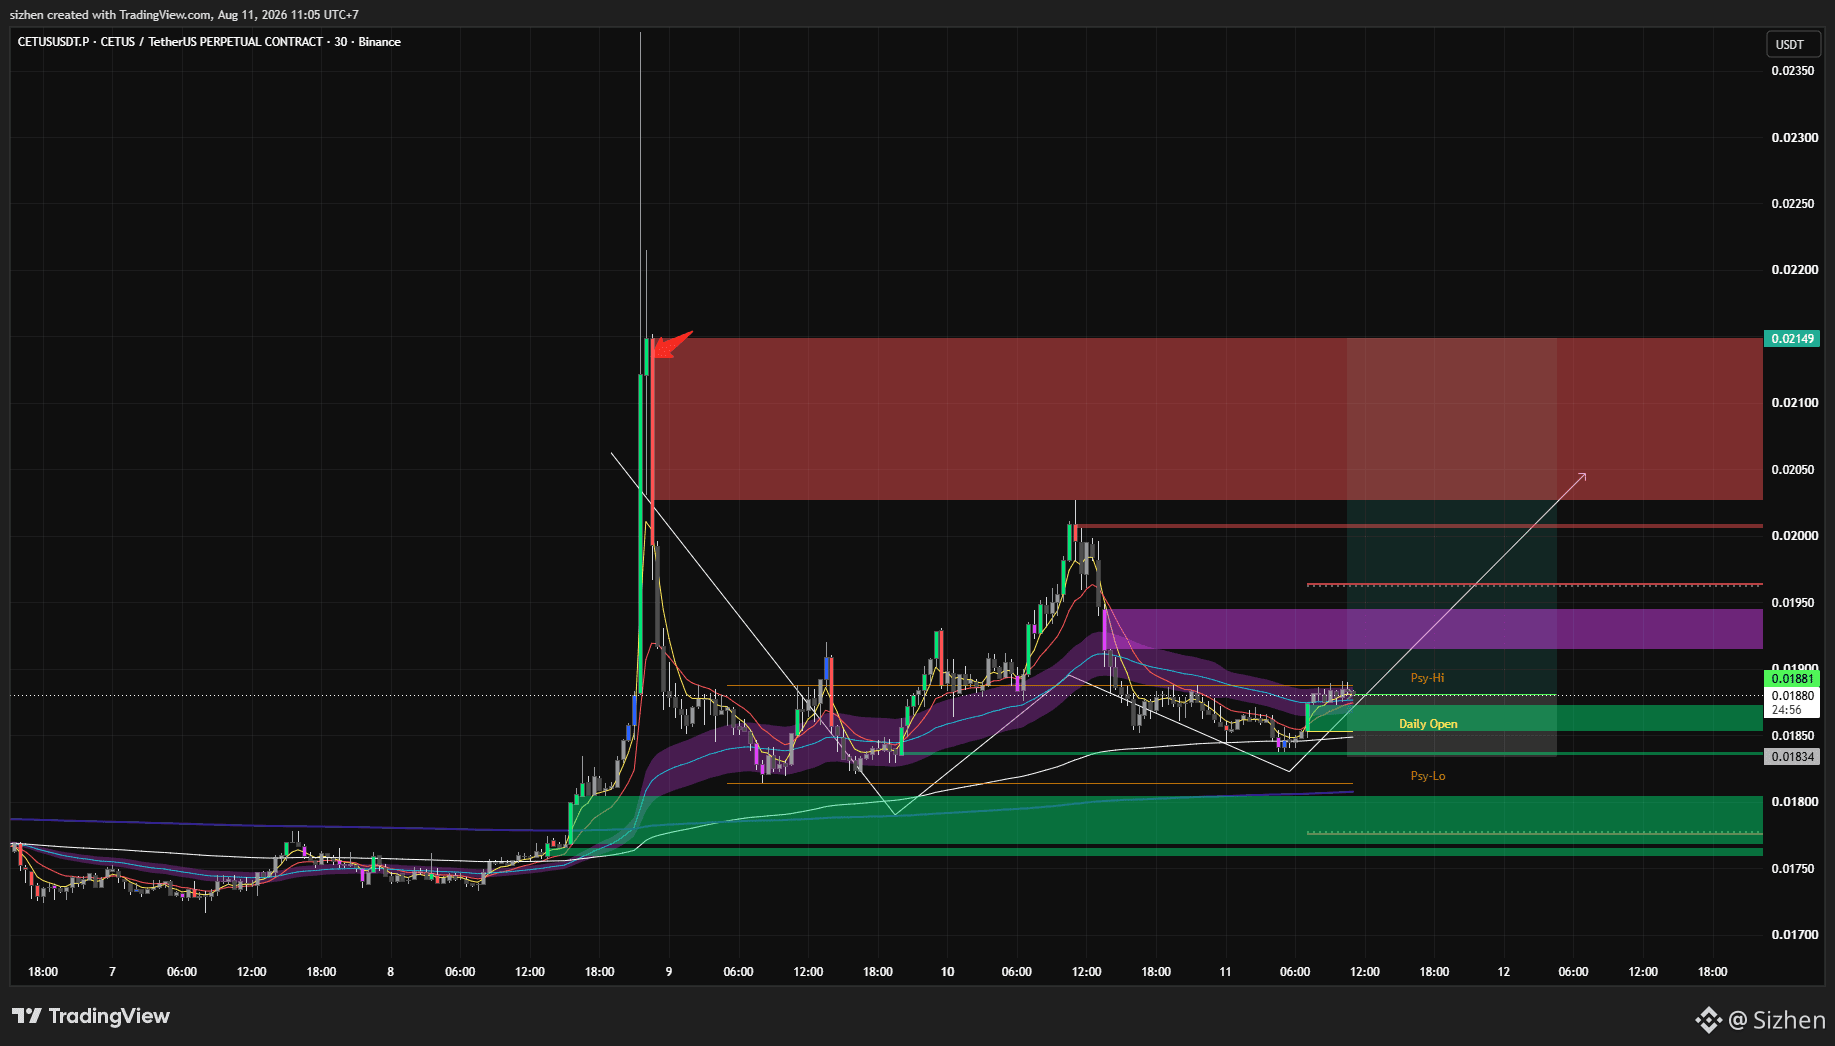
$CETUS if the price does not fall below the EMA or below the daily open, it may experience a rapid rise towards the red vector candle
Entry: 0.01881
Stop-loss: 0.0183
Take-profit: 0.02149
Entry: 0.01881
Stop-loss: 0.0183
Take-profit: 0.02149
Log in to explore more content