

RJ 45
234 Posts

RJ 45
Report
Block User
Market Analyzer and close eyes on whales move | Learner
High-Frequency Trader
4 Years
86 Following
70 Followers
243 Liked
Posts
·
--
Bearish
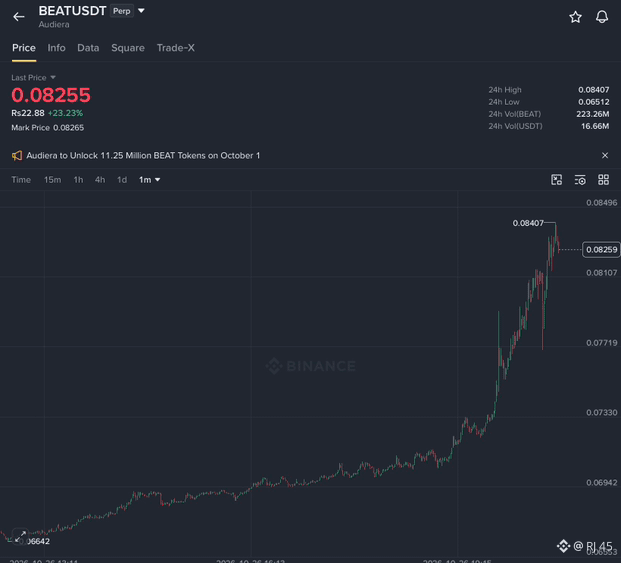
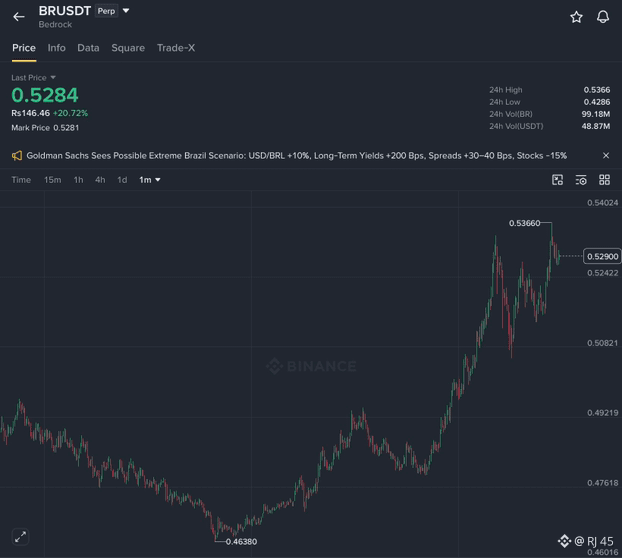
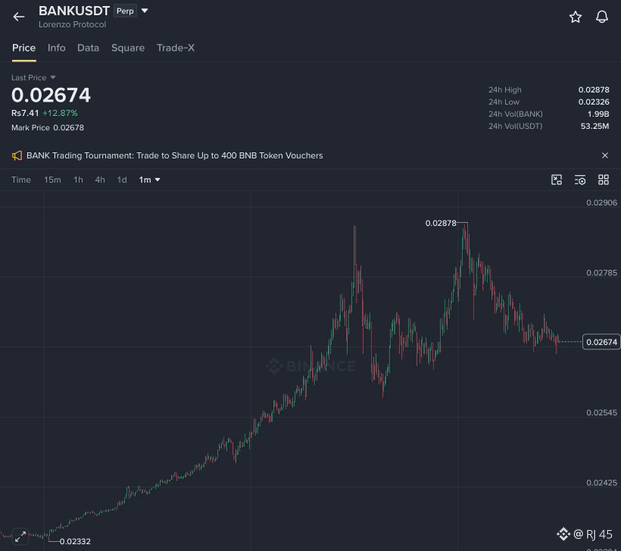
$BEAT $BR $BANK shows breakout these all three breakout are fake soon these BBB will be dump even more wait for right time for short
{future}(BANKUSDT)
{future}(BRUSDT)
{future}(BEATUSDT)
$BEAT $BR $BANK shows breakout these all three breakout are fake soon these BBB will be dump even more wait for right time for short
1
2
730
·
--
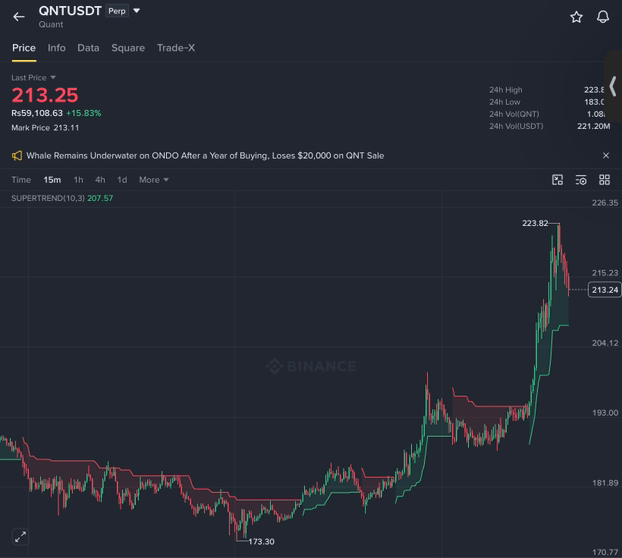
$QNT is trading at $216.02, with mixed market signals as concerns over AI stocks, credit risks, and potential oil supply disruptions increase market uncertainty. Open interest has dropped by 4.84% despite a 6.13% price increase, showing mixed positioning between buyers and sellers. The upper resistance is around $252.04, while support is near $180.00. If QNT closes below $209.86, it could signal a bearish trend shift and further downside risk.
{future}(QNTUSDT)
$QNT is trading at $216.02, with mixed market signals as concerns over AI stocks, credit risks, and potential oil supply disruptions increase market uncertainty. Open interest has dropped by 4.84% despite a 6.13% price increase, showing mixed positioning between buyers and sellers. The upper resistance is around $252.04, while support is near $180.00. If QNT closes below $209.86, it could signal a bearish trend shift and further downside risk.
1
154
·
--
Bullish
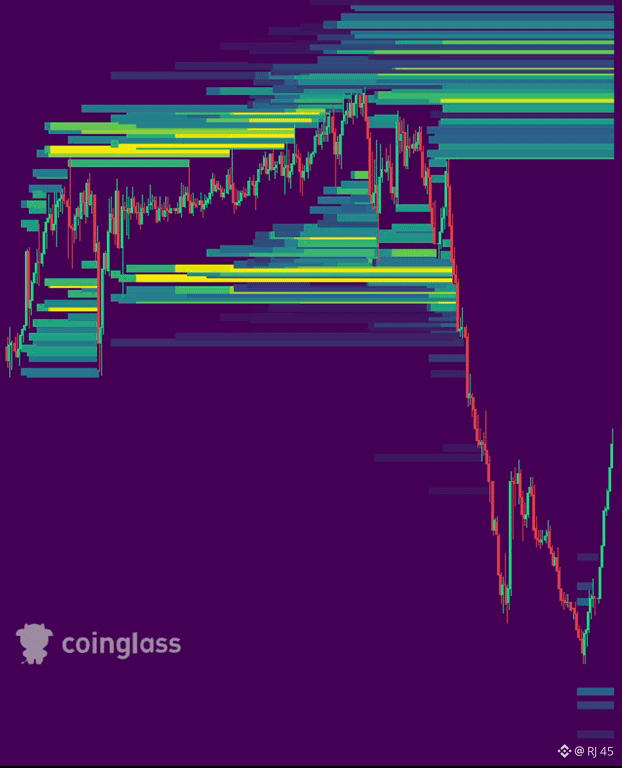
$CAP already sweep all the down side liquidity now moving upwards
{future}(CAPUSDT)
$CAP already sweep all the down side liquidity now moving upwards
4
2
582
·
--
Bullish
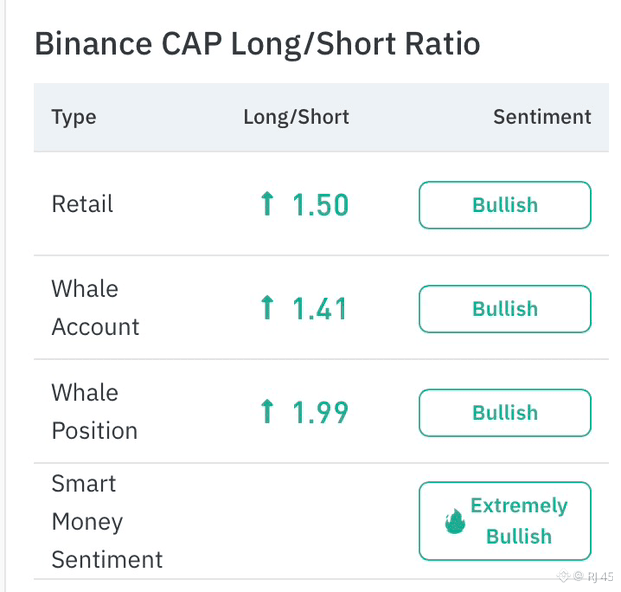
$CAP long short ratio has been change dramatically!
{future}(CAPUSDT)
$CAP long short ratio has been change dramatically!
1
328
·
--
Bullish
1
201
·
--
Bearish
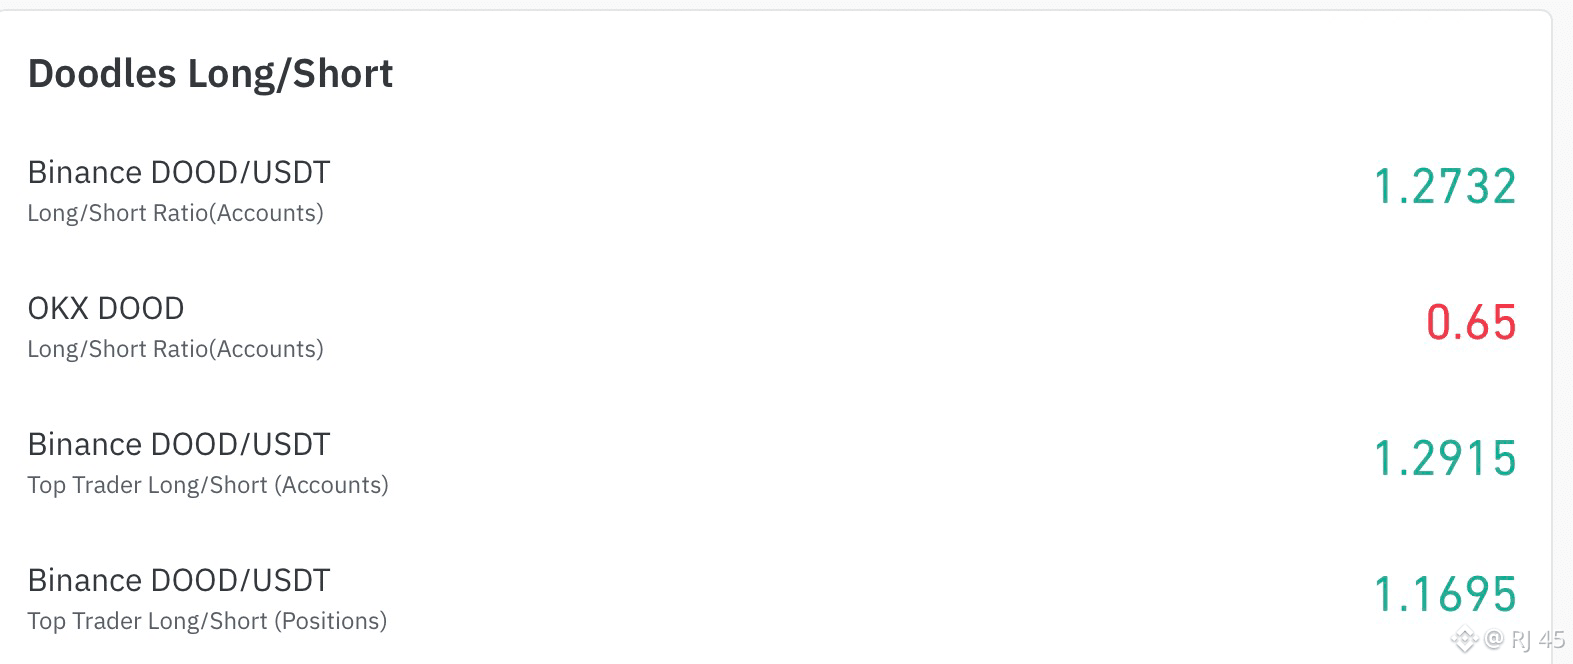
$DOOD long short ratio shows some interesting data as we know market always goes against the crowd as you can see there alot of traders are sitting in long position for my point of view after market correction it will come back near to near high to get rejected again and generate a sharp drop
{future}(DOODUSDT)
$DOOD long short ratio shows some interesting data as we know market always goes against the crowd as you can see there alot of traders are sitting in long position for my point of view after market correction it will come back near to near high to get rejected again and generate a sharp drop
1
153
·
--
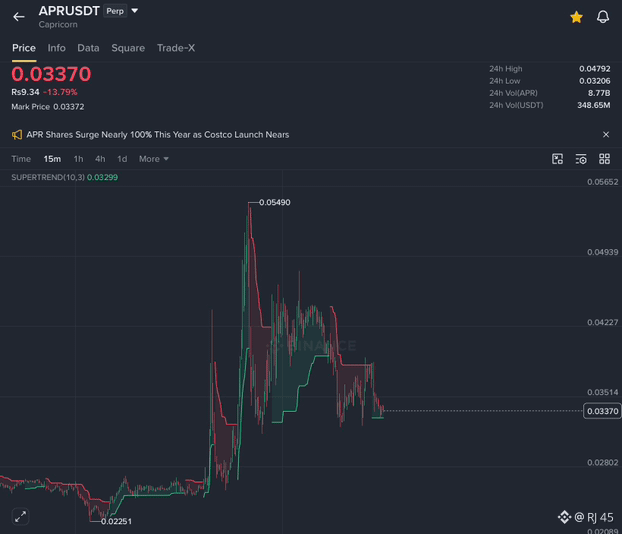
As i warn you guys about $APR
{future}(APRUSDT)
Bull trap i hope you follow that post for more updates kindly follow me .
For next it will go further down.
As i warn you guys about $APR
Bull trap i hope you follow that post for more updates kindly follow me .
For next it will go further down.
Bull trap i hope you follow that post for more updates kindly follow me .
For next it will go further down.
2
239
·
--
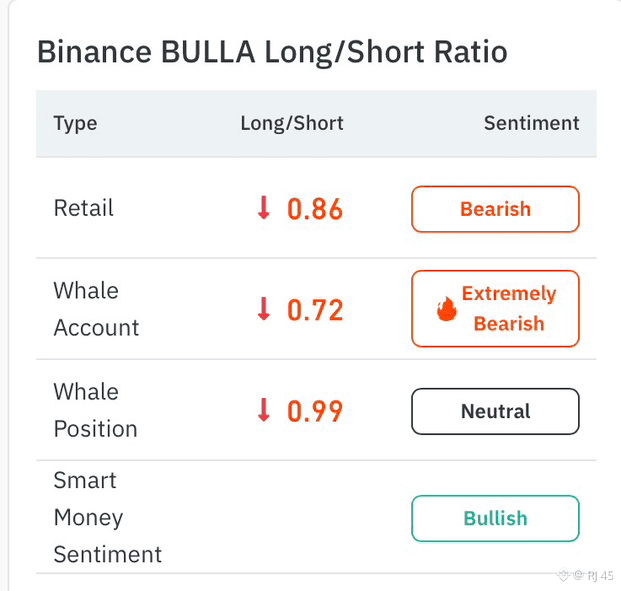
$BULLA long/short ratio shows bearish sentiment, with retail traders at 0.86 and whale accounts at 0.72, indicating more short positioning. Whale positions remain nearly neutral at 0.99, while smart money sentiment is bullish. Overall, the data suggests strong bearish pressure, but the mixed signals mean a sudden reversal is still possible. Smart money always plays important role.
{future}(BULLAUSDT)
$BULLA long/short ratio shows bearish sentiment, with retail traders at 0.86 and whale accounts at 0.72, indicating more short positioning. Whale positions remain nearly neutral at 0.99, while smart money sentiment is bullish. Overall, the data suggests strong bearish pressure, but the mixed signals mean a sudden reversal is still possible. Smart money always plays important role.
3
460
·
--
Bearish
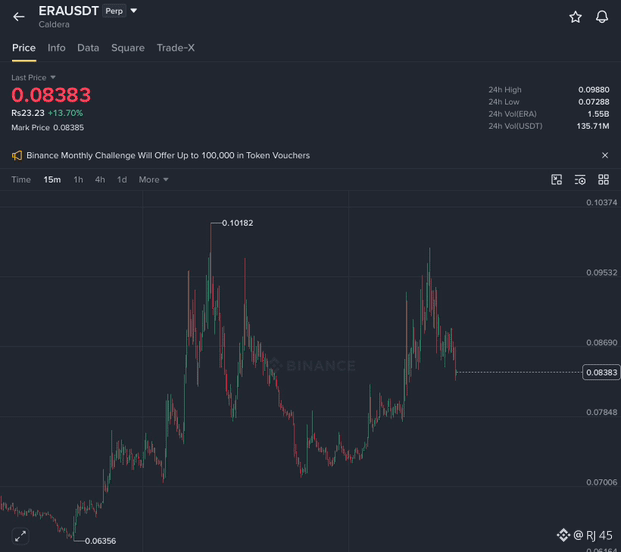
$ERA faced strong rejection near its previous high of $0.10182, as sellers took control and pushed the price down. The failure to break resistance signals weakening bullish momentum. If support at $0.083 breaks, the price could drop toward $0.0785 or $0.0729.
{future}(ERAUSDT)
$ERA faced strong rejection near its previous high of $0.10182, as sellers took control and pushed the price down. The failure to break resistance signals weakening bullish momentum. If support at $0.083 breaks, the price could drop toward $0.0785 or $0.0729.
1
4
·
--
Bearish
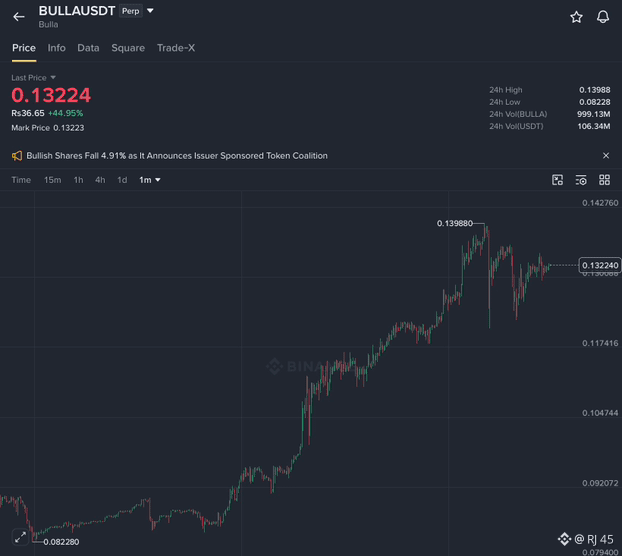
$BULLA
{future}(BULLAUSDT)
Is ready for market correction
$BULLA
Is ready for market correction
Is ready for market correction
1
267
·
--
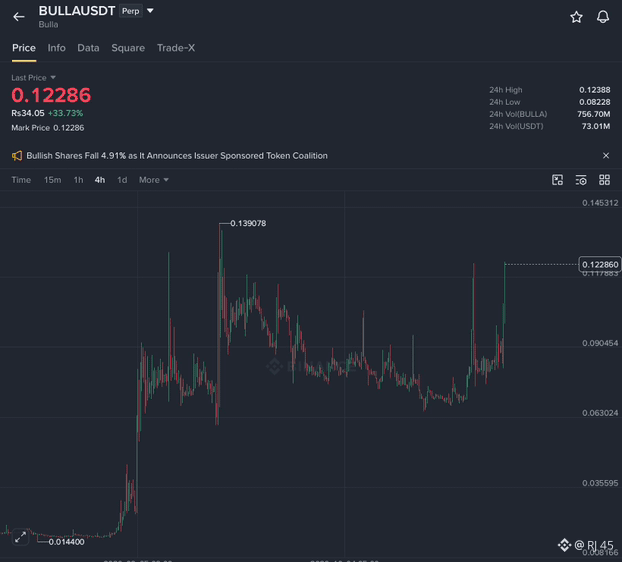
$BULLA
{future}(BULLAUSDT)
Is going to break the previous high get ready NFA DYOR
$BULLA
Is going to break the previous high get ready NFA DYOR
Is going to break the previous high get ready NFA DYOR
1
328
·
--
Bullish
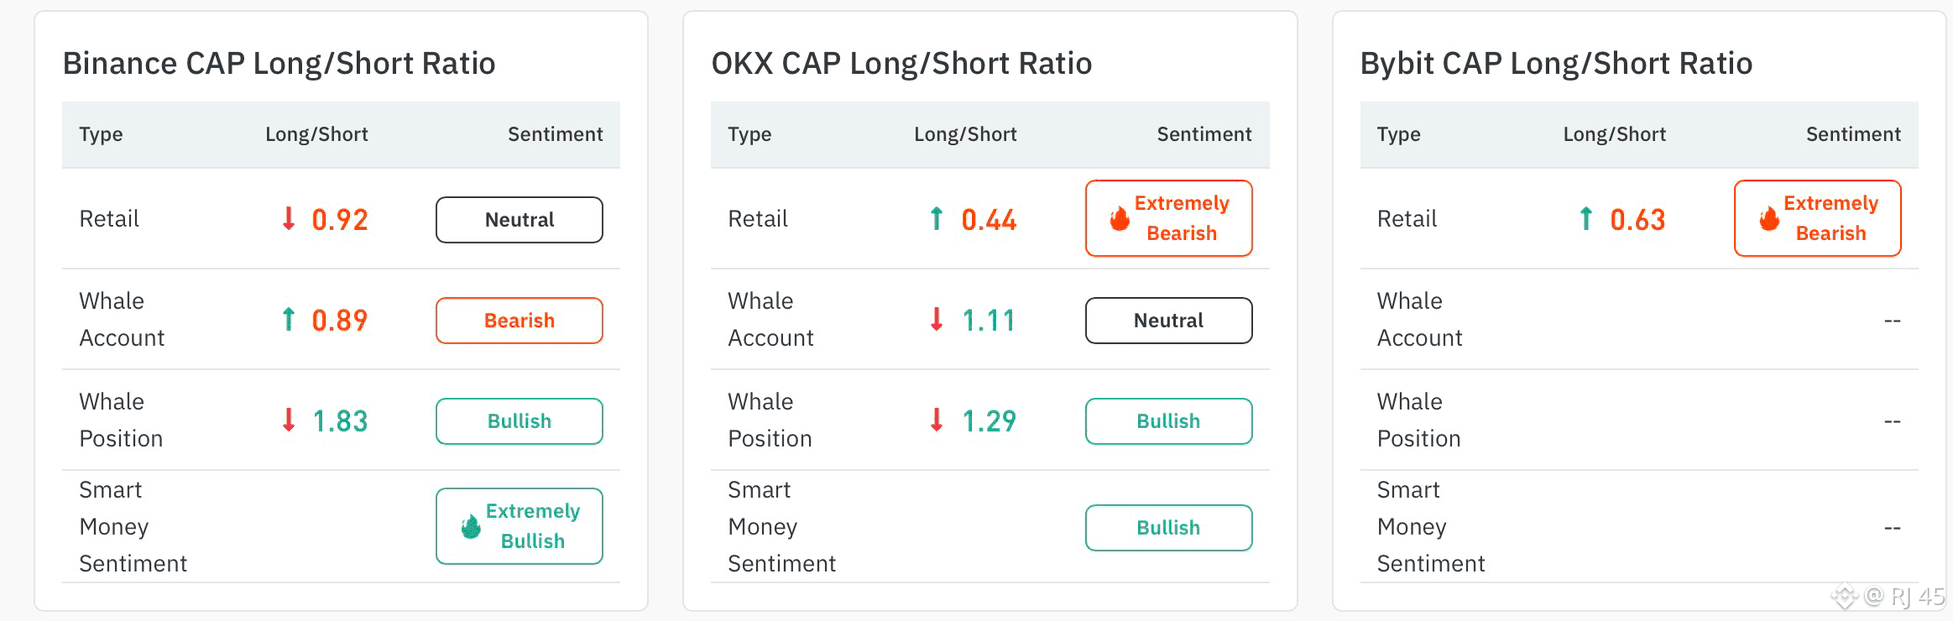
$CAP showing some interesting data in long short ratio
{future}(CAPUSDT)
$CAP showing some interesting data in long short ratio
1
452
·
--
Bullish
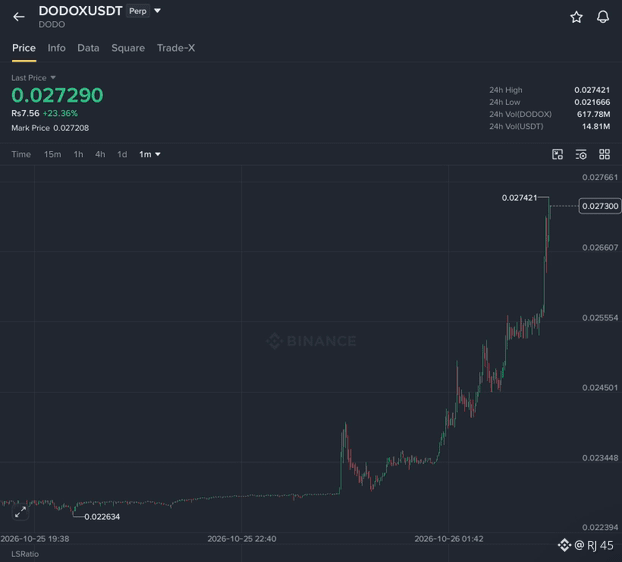
$DODOX showing aggressive bullish momentum this will be the next big thing
{future}(DODOXUSDT)
$DODOX showing aggressive bullish momentum this will be the next big thing
2
606
·
--
Bearish
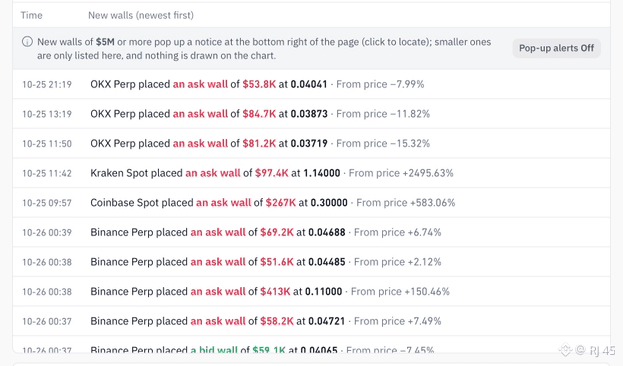
Whales are building selling walls across $APR
{future}(APRUSDT)
So maybe it will go against expectation
Whales are building selling walls across $APR
So maybe it will go against expectation
So maybe it will go against expectation
1
384
·
--
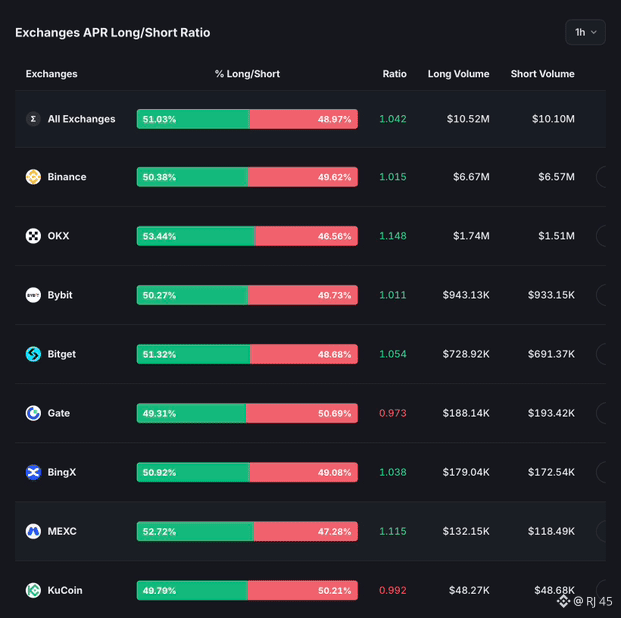
$APR data is getting interesting across all exchanges wait for the confirmation NFA DYOR
{future}(APRUSDT)
$APR data is getting interesting across all exchanges wait for the confirmation NFA DYOR
2
295
·
--
Bullish
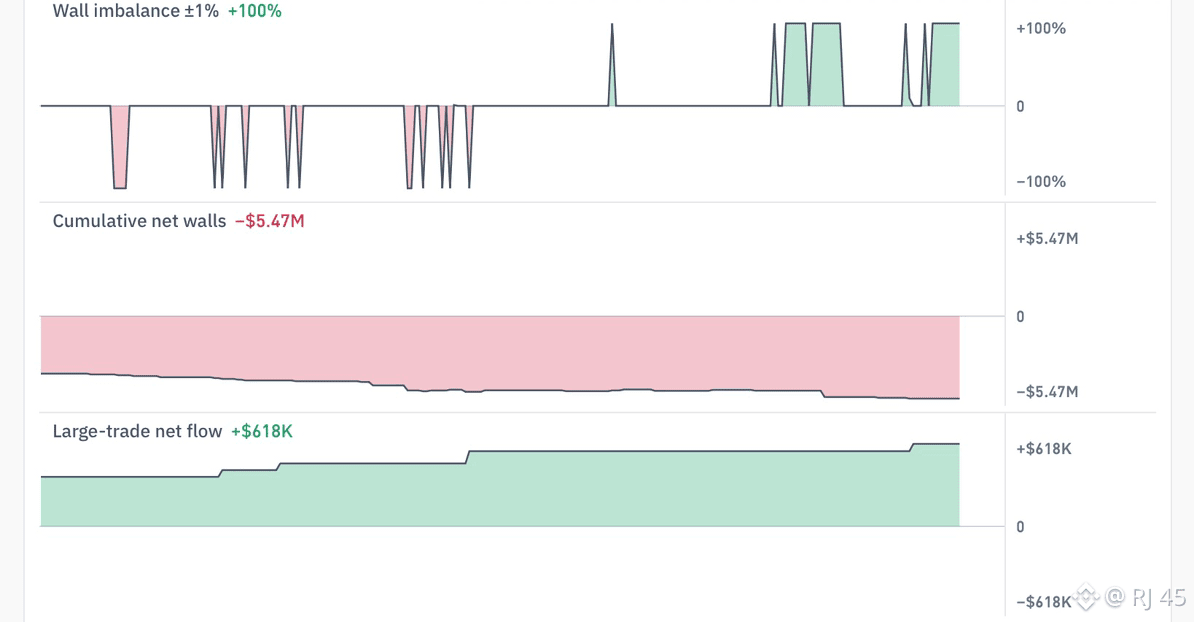
More and more buying position are getting set in $JCT
{future}(JCTUSDT)
NFA DYOR
More and more buying position are getting set in $JCT
NFA DYOR
NFA DYOR
1
287
·
--
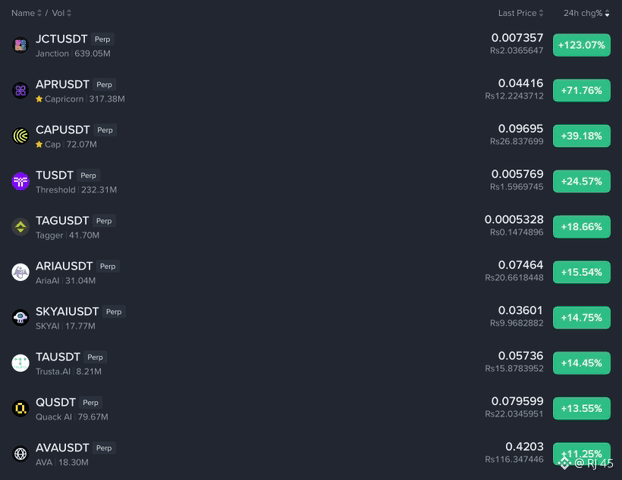
The only two strong coins i can see in top gainer are $JCT and $Q
NFA DYOR.
{future}(QUSDT)
{future}(JCTUSDT)
The only two strong coins i can see in top gainer are $JCT and $Q
NFA DYOR.
NFA DYOR.
1
637
·
--
Bullish
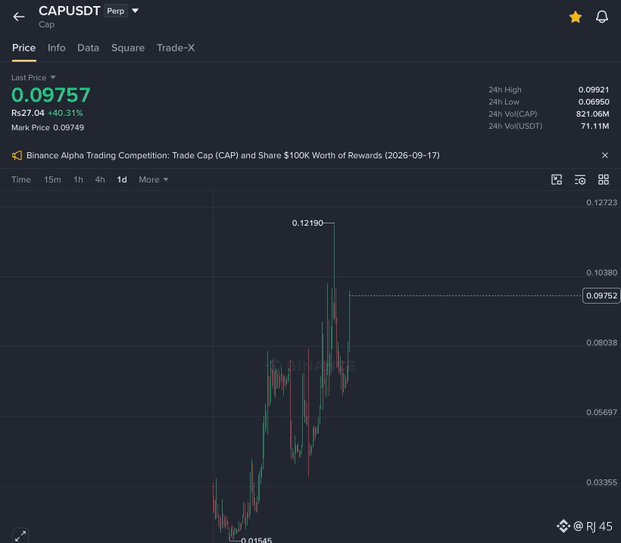
Is $CAP is the next $BTW .?
{future}(BTWUSDT)
{future}(CAPUSDT)
Is $CAP is the next $BTW .?
1
2
894
·
--
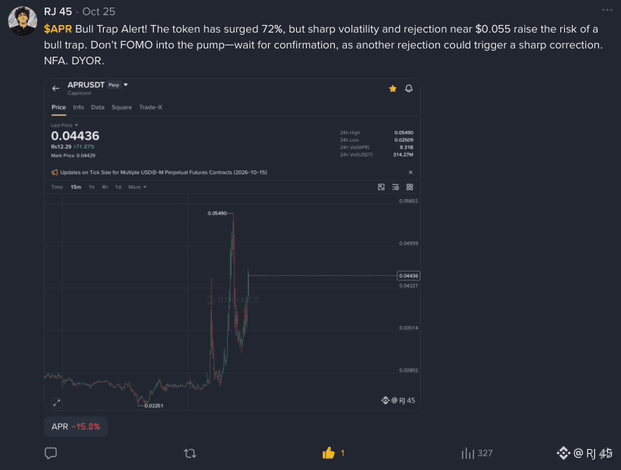
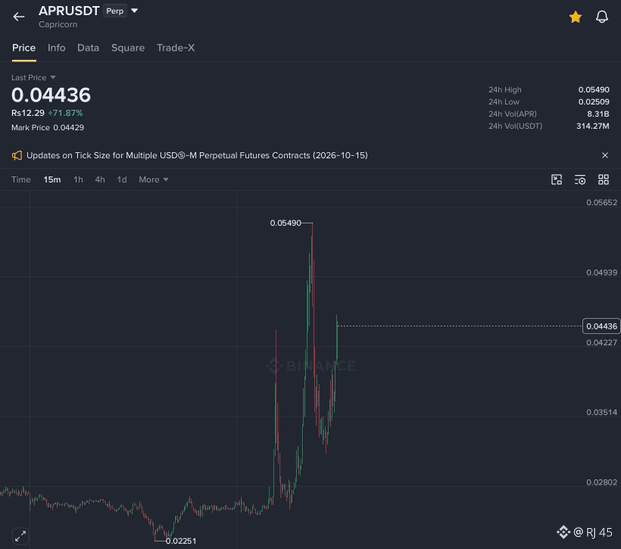
$APR Bull Trap Alert! The token has surged 72%, but sharp volatility and rejection near $0.055 raise the risk of a bull trap. Don’t FOMO into the pump—wait for confirmation, as another rejection could trigger a sharp correction.
NFA. DYOR.
{future}(APRUSDT)
$APR Bull Trap Alert! The token has surged 72%, but sharp volatility and rejection near $0.055 raise the risk of a bull trap. Don’t FOMO into the pump—wait for confirmation, as another rejection could trigger a sharp correction.
NFA. DYOR.
NFA. DYOR.
1
327
·
--
Bullish
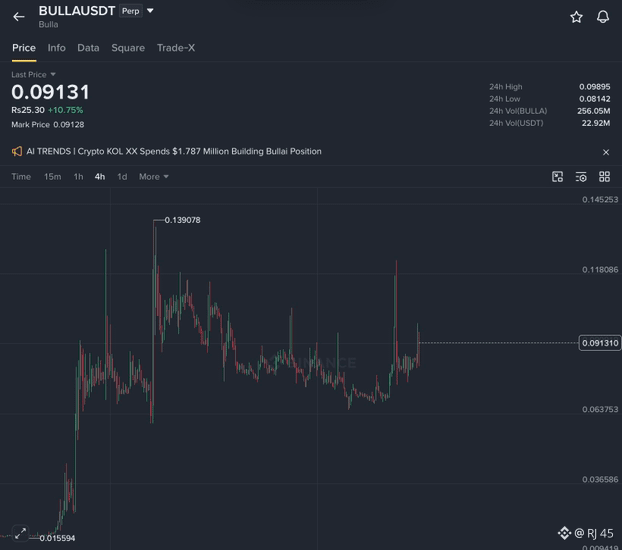
$BULLA Shows Strong Bullish Momentum After a Major Price Surge
$BULLA is trading around $0.09131, up approximately 10.75% in 24 hours. The 4-hour chart shows a strong historical rally from around $0.01559 to a peak of $0.13908, followed by a prolonged correction and recent renewed buying pressure. The price has rebounded sharply from its recent lows, but resistance around $0.098–$0.10 will be important to watch. A breakout above this zone could open the door to further upside, while rejection may trigger profit-taking and a short-term pullback. Given the token’s sharp price swings and long upper wicks, volatility remains high, so confirmation is important before entering a trade.
NFA. DYOR.
{future}(BULLAUSDT)
$BULLA Shows Strong Bullish Momentum After a Major Price Surge
$BULLA is trading around $0.09131, up approximately 10.75% in 24 hours. The 4-hour chart shows a strong historical rally from around $0.01559 to a peak of $0.13908, followed by a prolonged correction and recent renewed buying pressure. The price has rebounded sharply from its recent lows, but resistance around $0.098–$0.10 will be important to watch. A breakout above this zone could open the door to further upside, while rejection may trigger profit-taking and a short-term pullback. Given the token’s sharp price swings and long upper wicks, volatility remains high, so confirmation is important before entering a trade.
NFA. DYOR.
2
178
Log in to explore more content
Join global crypto users on Binance Square
⚡️ Get latest and useful information about crypto.
💬 Trusted by the world’s largest crypto exchange.
👍 Discover real insights from verified creators.
Email / Phone number