
RizkyMauladi
11.6k Posts

RizkyMauladi
Report
Block User
Menavigasi pasar crypto dengan strategi, disiplin, dan data | Crypto Trader sejak 2021
Open Trade
High-Frequency Trader
5.4 Years
2.6K+ Following
3.0K+ Followers
1.3K+ Liked
Posts
Portfolio
All
Quotes
·
--
Bullish
Verified
$IDOL — New Listing, Momentum Still Needs to Be Tested
IDOL is priced at $0.021571, based on the live price provided. After a sharp rally to around $0.0314, the price underwent a fairly deep correction. The market is now testing whether the Fibonacci areas can provide a foothold for a recovery.
Support Areas:
- $0.0220 — Weekly 38.2% and Daily 38.2% Fibonacci area (resistance if it has not been reclaimed)
- $0.0207–$0.0201 — 4H 61.8% and Daily 50% Fibonacci area
- $0.0191–$0.0183 — Weekly 50% and Daily 61.8% Fibonacci area
- $0.0163–$0.0176 — support zone based on the latest 4H structure
Resistance Areas:
- $0.0220–$0.0234 — initial resistance from 4H Fibonacci levels
- $0.0241–$0.0251 — next resistance from Daily and 4H Fibonacci levels
- $0.0278 — recent price-action peak
- $0.0314 — previous rally peak
Multi-Timeframe Analysis:
The Daily chart is testing the $0.0201–$0.0219 retracement area. Holding this zone would help preserve the chance of a recovery.
On the 4H chart, the price needs to reclaim $0.0220 and break through $0.0234 to improve momentum.
On the 1H chart, the focus is on the price reaction around $0.0207–$0.0220. There is no confirmation of a strong recovery until that resistance is broken.
Latest MEET48 News:
- KuCoin officially announced the listing of IDOL on the Spot market on November 3, 2026, with the IDOL/USDT trading pair. This is a positive catalyst in terms of access and market reach.
- IDOL trading was also moved from KuCoin Alpha to KuCoin Spot on the same day.
- On the other hand, IDOL came under selling pressure after a very sharp weekly gain. CoinMarketCap recorded a decline of around 29.5% over 24 hours in its November 3 update.
A new listing can increase market attention, but it does not automatically guarantee a price increase. IDOL needs to prove that buying demand can absorb selling pressure following its previous rally.
IDOL still has a chance to recover, but the $0.0220–$0.0234 area will be the first test. Watch the price response after the KuCoin listing; don't chase momentum without waiting for confirmation.
{future}(IDOLUSDT)
$IDOL — New Listing, Momentum Still Needs to Be Tested
IDOL is priced at $0.021571, based on the live price provided. After a sharp rally to around $0.0314, the price underwent a fairly deep correction. The market is now testing whether the Fibonacci areas can provide a foothold for a recovery.
Support Areas:
- $0.0220 — Weekly 38.2% and Daily 38.2% Fibonacci area (resistance if it has not been reclaimed)
- $0.0207–$0.0201 — 4H 61.8% and Daily 50% Fibonacci area
- $0.0191–$0.0183 — Weekly 50% and Daily 61.8% Fibonacci area
- $0.0163–$0.0176 — support zone based on the latest 4H structure
Resistance Areas:
- $0.0220–$0.0234 — initial resistance from 4H Fibonacci levels
- $0.0241–$0.0251 — next resistance from Daily and 4H Fibonacci levels
- $0.0278 — recent price-action peak
- $0.0314 — previous rally peak
Multi-Timeframe Analysis:
The Daily chart is testing the $0.0201–$0.0219 retracement area. Holding this zone would help preserve the chance of a recovery.
On the 4H chart, the price needs to reclaim $0.0220 and break through $0.0234 to improve momentum.
On the 1H chart, the focus is on the price reaction around $0.0207–$0.0220. There is no confirmation of a strong recovery until that resistance is broken.
Latest MEET48 News:
- KuCoin officially announced the listing of IDOL on the Spot market on November 3, 2026, with the IDOL/USDT trading pair. This is a positive catalyst in terms of access and market reach.
- IDOL trading was also moved from KuCoin Alpha to KuCoin Spot on the same day.
- On the other hand, IDOL came under selling pressure after a very sharp weekly gain. CoinMarketCap recorded a decline of around 29.5% over 24 hours in its November 3 update.
A new listing can increase market attention, but it does not automatically guarantee a price increase. IDOL needs to prove that buying demand can absorb selling pressure following its previous rally.
IDOL still has a chance to recover, but the $0.0220–$0.0234 area will be the first test. Watch the price response after the KuCoin listing; don't chase momentum without waiting for confirmation.
IDOL is priced at $0.021571, based on the live price provided. After a sharp rally to around $0.0314, the price underwent a fairly deep correction. The market is now testing whether the Fibonacci areas can provide a foothold for a recovery.
Support Areas:
- $0.0220 — Weekly 38.2% and Daily 38.2% Fibonacci area (resistance if it has not been reclaimed)
- $0.0207–$0.0201 — 4H 61.8% and Daily 50% Fibonacci area
- $0.0191–$0.0183 — Weekly 50% and Daily 61.8% Fibonacci area
- $0.0163–$0.0176 — support zone based on the latest 4H structure
Resistance Areas:
- $0.0220–$0.0234 — initial resistance from 4H Fibonacci levels
- $0.0241–$0.0251 — next resistance from Daily and 4H Fibonacci levels
- $0.0278 — recent price-action peak
- $0.0314 — previous rally peak
Multi-Timeframe Analysis:
The Daily chart is testing the $0.0201–$0.0219 retracement area. Holding this zone would help preserve the chance of a recovery.
On the 4H chart, the price needs to reclaim $0.0220 and break through $0.0234 to improve momentum.
On the 1H chart, the focus is on the price reaction around $0.0207–$0.0220. There is no confirmation of a strong recovery until that resistance is broken.
Latest MEET48 News:
- KuCoin officially announced the listing of IDOL on the Spot market on November 3, 2026, with the IDOL/USDT trading pair. This is a positive catalyst in terms of access and market reach.
- IDOL trading was also moved from KuCoin Alpha to KuCoin Spot on the same day.
- On the other hand, IDOL came under selling pressure after a very sharp weekly gain. CoinMarketCap recorded a decline of around 29.5% over 24 hours in its November 3 update.
A new listing can increase market attention, but it does not automatically guarantee a price increase. IDOL needs to prove that buying demand can absorb selling pressure following its previous rally.
IDOL still has a chance to recover, but the $0.0220–$0.0234 area will be the first test. Watch the price response after the KuCoin listing; don't chase momentum without waiting for confirmation.
1
150
·
--
Bullish
Verified
$HYPE — Correction Continues, $85 Area Is Decisive
HYPE is trading around $85.287, after previously reaching a high of around $97.74 on October 29. The price remains in a corrective phase and is testing an important area that could determine its next direction.
Support Areas:
- $85.02–$85.66
- $83.40–$82.60
- $80.00–$78.20
Resistance Areas:
- $86.16
- $87.45–$88.37
- $90.17–$91.95
- $97.74
Multi-Timeframe Analysis:
On the 1H timeframe, the focus is on whether price can hold around $85. If it fails, the $83.40–$82.60 support area becomes the next test.
Bullish Scenario:
If HYPE can hold the $85 area and reclaim $86.16, a recovery toward $88.37 and then $90.17 could open up. Momentum would strengthen if the price can hold above $91.95.
Bearish Scenario:
If $85 fails to hold and the price breaks below $83.40, selling pressure could push HYPE to test $82.60 and then $80.00. Losing that area would make the corrective structure more severe.
There have been several important developments:
- Intercontinental Exchange (NYSE’s parent company) and Trade[XYZ] agreed to develop a Hyperliquid technology-based perpetual futures market in the US, but are still awaiting regulatory approval.
- Paradigm reportedly unstaked around 2.55 million HYPE over two days. This has increased market attention to potential selling pressure.
- Around 180,000 HYPE is scheduled to be unlocked for core contributors on November 6.
- Hyperliquid’s USDC reserve yield mechanism is also scheduled to distribute around $15.3 million on November 3 to support the HYPE buyback mechanism.
HYPE still has a chance to recover, but it has yet to show a truly strong rebound. The $85 area is an important line of defense, while $86.16 is the initial level it needs to reclaim. Also monitor large token movements and the unlock schedule before taking a position.
{future}(HYPEUSDT)
$HYPE — Correction Continues, $85 Area Is Decisive
HYPE is trading around $85.287, after previously reaching a high of around $97.74 on October 29. The price remains in a corrective phase and is testing an important area that could determine its next direction.
Support Areas:
- $85.02–$85.66
- $83.40–$82.60
- $80.00–$78.20
Resistance Areas:
- $86.16
- $87.45–$88.37
- $90.17–$91.95
- $97.74
Multi-Timeframe Analysis:
On the 1H timeframe, the focus is on whether price can hold around $85. If it fails, the $83.40–$82.60 support area becomes the next test.
Bullish Scenario:
If HYPE can hold the $85 area and reclaim $86.16, a recovery toward $88.37 and then $90.17 could open up. Momentum would strengthen if the price can hold above $91.95.
Bearish Scenario:
If $85 fails to hold and the price breaks below $83.40, selling pressure could push HYPE to test $82.60 and then $80.00. Losing that area would make the corrective structure more severe.
There have been several important developments:
- Intercontinental Exchange (NYSE’s parent company) and Trade[XYZ] agreed to develop a Hyperliquid technology-based perpetual futures market in the US, but are still awaiting regulatory approval.
- Paradigm reportedly unstaked around 2.55 million HYPE over two days. This has increased market attention to potential selling pressure.
- Around 180,000 HYPE is scheduled to be unlocked for core contributors on November 6.
- Hyperliquid’s USDC reserve yield mechanism is also scheduled to distribute around $15.3 million on November 3 to support the HYPE buyback mechanism.
HYPE still has a chance to recover, but it has yet to show a truly strong rebound. The $85 area is an important line of defense, while $86.16 is the initial level it needs to reclaim. Also monitor large token movements and the unlock schedule before taking a position.
HYPE is trading around $85.287, after previously reaching a high of around $97.74 on October 29. The price remains in a corrective phase and is testing an important area that could determine its next direction.
Support Areas:
- $85.02–$85.66
- $83.40–$82.60
- $80.00–$78.20
Resistance Areas:
- $86.16
- $87.45–$88.37
- $90.17–$91.95
- $97.74
Multi-Timeframe Analysis:
On the 1H timeframe, the focus is on whether price can hold around $85. If it fails, the $83.40–$82.60 support area becomes the next test.
Bullish Scenario:
If HYPE can hold the $85 area and reclaim $86.16, a recovery toward $88.37 and then $90.17 could open up. Momentum would strengthen if the price can hold above $91.95.
Bearish Scenario:
If $85 fails to hold and the price breaks below $83.40, selling pressure could push HYPE to test $82.60 and then $80.00. Losing that area would make the corrective structure more severe.
There have been several important developments:
- Intercontinental Exchange (NYSE’s parent company) and Trade[XYZ] agreed to develop a Hyperliquid technology-based perpetual futures market in the US, but are still awaiting regulatory approval.
- Paradigm reportedly unstaked around 2.55 million HYPE over two days. This has increased market attention to potential selling pressure.
- Around 180,000 HYPE is scheduled to be unlocked for core contributors on November 6.
- Hyperliquid’s USDC reserve yield mechanism is also scheduled to distribute around $15.3 million on November 3 to support the HYPE buyback mechanism.
HYPE still has a chance to recover, but it has yet to show a truly strong rebound. The $85 area is an important line of defense, while $86.16 is the initial level it needs to reclaim. Also monitor large token movements and the unlock schedule before taking a position.
LONG 🚀
SHORT ✊🏻
23 hr(s) left
1
262
·
--
Bullish
Verified
$SOXS — Correction After the Surge: Is the Pressure Still Continuing?
SOXS is currently at $53.07, after briefly reaching a high of $58.60. The price has started to pull back following a sharp surge, making the nearest support area a key focus ahead of the close.
Support Areas:
- $52.86 — Fibonacci 61.8% of the latest move
- $51.49 — Weekly Fibonacci 23.6%
- $51.24 — Daily Fibonacci 38.2%
- $49.31 — previous session low
Resistance Areas:
- $53.95 — Fibonacci 50% of the latest move
- $55.05 — Fibonacci 38.2%
- $56.41 — Fibonacci 23.6%
- $58.60 — recent high
Multi-Timeframe Analysis:
The weekly chart still shows a strong recovery from lower levels, but the price is starting to face pressure after an aggressive rise.
The daily chart remains in a rebound phase. As long as the $51.49–$51.24 area holds, the recovery potential has not completely disappeared.
On the 4H chart, the price is testing the $52.86 retracement area. If it holds, another test of $53.95–$55.05 remains possible.
On the 1H chart, attention is focused on whether the price can reclaim $53.95. If it fails, corrective pressure could continue.
Bullish Scenario:
If SOXS holds above $52.86 and moves back above $53.95, the path toward $55.05–$56.41 is open. A break above $58.60 would confirm further momentum.
Bearish Scenario:
If $52.86 is breached, the price risks testing $51.49–$51.24. Losing that area could open the way for a pullback toward $49.31.
Latest News:
The semiconductor sector remains under pressure after the Philadelphia Semiconductor Index fell about 21.9% from its October peak. Concerns about AI spending and the outlook for chip companies are also weighing on sentiment.
However, in trading on November 3, chip stocks began to strengthen in premarket trading. AMD's earnings report after the close is also an important catalyst to watch, as it could influence the direction of the semiconductor sector.
Conclusion:
SOXS still has a chance to extend its gains if pressure on chip stocks increases again. However, the $52.86 area is currently an important line of defense.
{future}(SOXSUSDT)
$SOXS — Correction After the Surge: Is the Pressure Still Continuing?
SOXS is currently at $53.07, after briefly reaching a high of $58.60. The price has started to pull back following a sharp surge, making the nearest support area a key focus ahead of the close.
Support Areas:
- $52.86 — Fibonacci 61.8% of the latest move
- $51.49 — Weekly Fibonacci 23.6%
- $51.24 — Daily Fibonacci 38.2%
- $49.31 — previous session low
Resistance Areas:
- $53.95 — Fibonacci 50% of the latest move
- $55.05 — Fibonacci 38.2%
- $56.41 — Fibonacci 23.6%
- $58.60 — recent high
Multi-Timeframe Analysis:
The weekly chart still shows a strong recovery from lower levels, but the price is starting to face pressure after an aggressive rise.
The daily chart remains in a rebound phase. As long as the $51.49–$51.24 area holds, the recovery potential has not completely disappeared.
On the 4H chart, the price is testing the $52.86 retracement area. If it holds, another test of $53.95–$55.05 remains possible.
On the 1H chart, attention is focused on whether the price can reclaim $53.95. If it fails, corrective pressure could continue.
Bullish Scenario:
If SOXS holds above $52.86 and moves back above $53.95, the path toward $55.05–$56.41 is open. A break above $58.60 would confirm further momentum.
Bearish Scenario:
If $52.86 is breached, the price risks testing $51.49–$51.24. Losing that area could open the way for a pullback toward $49.31.
Latest News:
The semiconductor sector remains under pressure after the Philadelphia Semiconductor Index fell about 21.9% from its October peak. Concerns about AI spending and the outlook for chip companies are also weighing on sentiment.
However, in trading on November 3, chip stocks began to strengthen in premarket trading. AMD's earnings report after the close is also an important catalyst to watch, as it could influence the direction of the semiconductor sector.
Conclusion:
SOXS still has a chance to extend its gains if pressure on chip stocks increases again. However, the $52.86 area is currently an important line of defense.
SOXS is currently at $53.07, after briefly reaching a high of $58.60. The price has started to pull back following a sharp surge, making the nearest support area a key focus ahead of the close.
Support Areas:
- $52.86 — Fibonacci 61.8% of the latest move
- $51.49 — Weekly Fibonacci 23.6%
- $51.24 — Daily Fibonacci 38.2%
- $49.31 — previous session low
Resistance Areas:
- $53.95 — Fibonacci 50% of the latest move
- $55.05 — Fibonacci 38.2%
- $56.41 — Fibonacci 23.6%
- $58.60 — recent high
Multi-Timeframe Analysis:
The weekly chart still shows a strong recovery from lower levels, but the price is starting to face pressure after an aggressive rise.
The daily chart remains in a rebound phase. As long as the $51.49–$51.24 area holds, the recovery potential has not completely disappeared.
On the 4H chart, the price is testing the $52.86 retracement area. If it holds, another test of $53.95–$55.05 remains possible.
On the 1H chart, attention is focused on whether the price can reclaim $53.95. If it fails, corrective pressure could continue.
Bullish Scenario:
If SOXS holds above $52.86 and moves back above $53.95, the path toward $55.05–$56.41 is open. A break above $58.60 would confirm further momentum.
Bearish Scenario:
If $52.86 is breached, the price risks testing $51.49–$51.24. Losing that area could open the way for a pullback toward $49.31.
Latest News:
The semiconductor sector remains under pressure after the Philadelphia Semiconductor Index fell about 21.9% from its October peak. Concerns about AI spending and the outlook for chip companies are also weighing on sentiment.
However, in trading on November 3, chip stocks began to strengthen in premarket trading. AMD's earnings report after the close is also an important catalyst to watch, as it could influence the direction of the semiconductor sector.
Conclusion:
SOXS still has a chance to extend its gains if pressure on chip stocks increases again. However, the $52.86 area is currently an important line of defense.
1
119
·
--
Bullish
Partly True
$AGT — Breakout at 0.06079, Is the Momentum Still Strong?
AGT briefly broke through the 0.06079 USDT area, but the live price is now at 0.05911 USDT. This means the market is testing whether it can reclaim the breakout area or whether it will instead turn into resistance.
Support Areas:
- 0.0582 — Fibonacci 23.6% of the latest rise
- 0.0566 — Fibonacci 38.2%
- 0.0553 — Fibonacci 50%
- 0.0528 — Daily Fibonacci support
- 0.0478 — Weekly Fibonacci area
Resistance Areas:
- 0.06079 — breakout level that needs to be reclaimed
- 0.0638 — next upside projection
- 0.0676 — further resistance
- 0.0700 — next extension area
Multi-Timeframe Analysis:
The weekly chart is beginning to show a recovery after significant pressure from the previous peak area. However, AGT still needs to build a stronger structure to ensure this rise is more than just a temporary rebound.
Bullish Scenario:
If AGT manages to reclaim 0.06079 and hold above it, the way toward 0.0638–0.0676 could open up. Volume confirmation remains important to ensure the rise is not a false breakout.
Bearish Scenario:
If AGT fails to move back above 0.06079 and drops below 0.0582, the price risks testing 0.0566–0.0553. Losing that area could open the door to a deeper correction toward 0.0528.
Latest News:
AGT futures activity continues to show a surge in trades and high volume. One observer recorded a transaction of around $976,000 in one minute on Binance Perpetual. Meanwhile, an unlock of approximately 26.67 million AGT is scheduled for November 13, 2026. This is worth watching, as the additional supply could add selling pressure if the market does not absorb it.
Conclusion:
AGT has shown strong momentum, but 0.06079 is now the decisive level. Until it is reclaimed, remain alert to the risk of a correction. It is better to wait for confirmation than to chase the price after a sharp rise.
{future}(AGTUSDT)
$AGT — Breakout at 0.06079, Is the Momentum Still Strong?
AGT briefly broke through the 0.06079 USDT area, but the live price is now at 0.05911 USDT. This means the market is testing whether it can reclaim the breakout area or whether it will instead turn into resistance.
Support Areas:
- 0.0582 — Fibonacci 23.6% of the latest rise
- 0.0566 — Fibonacci 38.2%
- 0.0553 — Fibonacci 50%
- 0.0528 — Daily Fibonacci support
- 0.0478 — Weekly Fibonacci area
Resistance Areas:
- 0.06079 — breakout level that needs to be reclaimed
- 0.0638 — next upside projection
- 0.0676 — further resistance
- 0.0700 — next extension area
Multi-Timeframe Analysis:
The weekly chart is beginning to show a recovery after significant pressure from the previous peak area. However, AGT still needs to build a stronger structure to ensure this rise is more than just a temporary rebound.
Bullish Scenario:
If AGT manages to reclaim 0.06079 and hold above it, the way toward 0.0638–0.0676 could open up. Volume confirmation remains important to ensure the rise is not a false breakout.
Bearish Scenario:
If AGT fails to move back above 0.06079 and drops below 0.0582, the price risks testing 0.0566–0.0553. Losing that area could open the door to a deeper correction toward 0.0528.
Latest News:
AGT futures activity continues to show a surge in trades and high volume. One observer recorded a transaction of around $976,000 in one minute on Binance Perpetual. Meanwhile, an unlock of approximately 26.67 million AGT is scheduled for November 13, 2026. This is worth watching, as the additional supply could add selling pressure if the market does not absorb it.
Conclusion:
AGT has shown strong momentum, but 0.06079 is now the decisive level. Until it is reclaimed, remain alert to the risk of a correction. It is better to wait for confirmation than to chase the price after a sharp rise.
AGT briefly broke through the 0.06079 USDT area, but the live price is now at 0.05911 USDT. This means the market is testing whether it can reclaim the breakout area or whether it will instead turn into resistance.
Support Areas:
- 0.0582 — Fibonacci 23.6% of the latest rise
- 0.0566 — Fibonacci 38.2%
- 0.0553 — Fibonacci 50%
- 0.0528 — Daily Fibonacci support
- 0.0478 — Weekly Fibonacci area
Resistance Areas:
- 0.06079 — breakout level that needs to be reclaimed
- 0.0638 — next upside projection
- 0.0676 — further resistance
- 0.0700 — next extension area
Multi-Timeframe Analysis:
The weekly chart is beginning to show a recovery after significant pressure from the previous peak area. However, AGT still needs to build a stronger structure to ensure this rise is more than just a temporary rebound.
Bullish Scenario:
If AGT manages to reclaim 0.06079 and hold above it, the way toward 0.0638–0.0676 could open up. Volume confirmation remains important to ensure the rise is not a false breakout.
Bearish Scenario:
If AGT fails to move back above 0.06079 and drops below 0.0582, the price risks testing 0.0566–0.0553. Losing that area could open the door to a deeper correction toward 0.0528.
Latest News:
AGT futures activity continues to show a surge in trades and high volume. One observer recorded a transaction of around $976,000 in one minute on Binance Perpetual. Meanwhile, an unlock of approximately 26.67 million AGT is scheduled for November 13, 2026. This is worth watching, as the additional supply could add selling pressure if the market does not absorb it.
Conclusion:
AGT has shown strong momentum, but 0.06079 is now the decisive level. Until it is reclaimed, remain alert to the risk of a correction. It is better to wait for confirmation than to chase the price after a sharp rise.
STAY LONG 🔥🔥
STAY SHORT ✊🏻✊🏻
23 hr(s) left
1
146
·
--
Bullish
$AGT — Strong Momentum, Can the Breakout Continue?
AGT is trading around 0.04811 USDT after reaching a daily high of 0.04974 USDT. This rise has brought the price back to test an important resistance area after rebounding from around 0.0269.
Support Areas:
- 0.0443 — Daily Fibonacci 23.6%
- 0.0425 — Weekly Fibonacci area and 4H support
- 0.0410 — Daily Fibonacci 38.2%
- 0.0383 — Daily Fibonacci 50%
Resistance Areas:
- 0.04974 — today's high
- 0.0519–0.0523 — Weekly Fibonacci resistance
- 0.0563 — next resistance
Multi-Timeframe Analysis:
The weekly chart shows a recovery from previous pressure. The price is testing an important retracement area, so this cannot yet be considered a full trend reversal.
The daily chart shows strong rebound momentum. As long as the price holds above 0.0443–0.0425, the possibility of further gains remains open.
On the 4H chart, the 0.0469–0.0482 area previously acted as resistance. Now that the price has moved above this area, it needs to hold as new support.
On the 1H chart, focus on whether the price can hold above 0.0482 and retest the 0.04974 high. A close on this timeframe is still needed for confirmation.
Bullish Scenario:
If AGT can hold above 0.0482 and break through 0.04974, a move toward 0.0519–0.0523 is possible, with 0.0563 as the next resistance area.
Bearish Scenario:
If the price fails to hold 0.0469–0.0482, it risks retesting 0.0443. If that area breaks to the downside, the next levels to watch are 0.0425 and then 0.0410.
Latest News:
AGT trading activity has increased sharply. Today's market data shows rising Futures open interest and a high funding rate, indicating growing speculative positioning. This could strengthen momentum, but it also increases the risk of liquidations and a rapid correction. I have not verified any new project announcements as a direct catalyst for today's rise.
Don't rush to chase the rally before the next direction becomes clear.
{future}(AGTUSDT)
$AGT — Strong Momentum, Can the Breakout Continue?
AGT is trading around 0.04811 USDT after reaching a daily high of 0.04974 USDT. This rise has brought the price back to test an important resistance area after rebounding from around 0.0269.
Support Areas:
- 0.0443 — Daily Fibonacci 23.6%
- 0.0425 — Weekly Fibonacci area and 4H support
- 0.0410 — Daily Fibonacci 38.2%
- 0.0383 — Daily Fibonacci 50%
Resistance Areas:
- 0.04974 — today's high
- 0.0519–0.0523 — Weekly Fibonacci resistance
- 0.0563 — next resistance
Multi-Timeframe Analysis:
The weekly chart shows a recovery from previous pressure. The price is testing an important retracement area, so this cannot yet be considered a full trend reversal.
The daily chart shows strong rebound momentum. As long as the price holds above 0.0443–0.0425, the possibility of further gains remains open.
On the 4H chart, the 0.0469–0.0482 area previously acted as resistance. Now that the price has moved above this area, it needs to hold as new support.
On the 1H chart, focus on whether the price can hold above 0.0482 and retest the 0.04974 high. A close on this timeframe is still needed for confirmation.
Bullish Scenario:
If AGT can hold above 0.0482 and break through 0.04974, a move toward 0.0519–0.0523 is possible, with 0.0563 as the next resistance area.
Bearish Scenario:
If the price fails to hold 0.0469–0.0482, it risks retesting 0.0443. If that area breaks to the downside, the next levels to watch are 0.0425 and then 0.0410.
Latest News:
AGT trading activity has increased sharply. Today's market data shows rising Futures open interest and a high funding rate, indicating growing speculative positioning. This could strengthen momentum, but it also increases the risk of liquidations and a rapid correction. I have not verified any new project announcements as a direct catalyst for today's rise.
Don't rush to chase the rally before the next direction becomes clear.
AGT is trading around 0.04811 USDT after reaching a daily high of 0.04974 USDT. This rise has brought the price back to test an important resistance area after rebounding from around 0.0269.
Support Areas:
- 0.0443 — Daily Fibonacci 23.6%
- 0.0425 — Weekly Fibonacci area and 4H support
- 0.0410 — Daily Fibonacci 38.2%
- 0.0383 — Daily Fibonacci 50%
Resistance Areas:
- 0.04974 — today's high
- 0.0519–0.0523 — Weekly Fibonacci resistance
- 0.0563 — next resistance
Multi-Timeframe Analysis:
The weekly chart shows a recovery from previous pressure. The price is testing an important retracement area, so this cannot yet be considered a full trend reversal.
The daily chart shows strong rebound momentum. As long as the price holds above 0.0443–0.0425, the possibility of further gains remains open.
On the 4H chart, the 0.0469–0.0482 area previously acted as resistance. Now that the price has moved above this area, it needs to hold as new support.
On the 1H chart, focus on whether the price can hold above 0.0482 and retest the 0.04974 high. A close on this timeframe is still needed for confirmation.
Bullish Scenario:
If AGT can hold above 0.0482 and break through 0.04974, a move toward 0.0519–0.0523 is possible, with 0.0563 as the next resistance area.
Bearish Scenario:
If the price fails to hold 0.0469–0.0482, it risks retesting 0.0443. If that area breaks to the downside, the next levels to watch are 0.0425 and then 0.0410.
Latest News:
AGT trading activity has increased sharply. Today's market data shows rising Futures open interest and a high funding rate, indicating growing speculative positioning. This could strengthen momentum, but it also increases the risk of liquidations and a rapid correction. I have not verified any new project announcements as a direct catalyst for today's rise.
Don't rush to chase the rally before the next direction becomes clear.
LONG 🔥🤔
SHORT 🔥✊🏻
22 hr(s) left
1
3.7k
·
--
Bullish
Partly True
$HOT — Momentum for HoloFuel: Is the Rally Continuing?
Live price: $0.0005761
Today's high: $0.0005925
HOT has seen a surge in momentum after previously trading in the $0.000368–$0.000482 range. The price is now approaching the recent high of $0.0005925, making this an important resistance area.
Support: $0.000540 / $0.000507 / $0.000480
Resistance: $0.0005925 / $0.000654 / $0.000731
Weekly, Daily, 4H & 1H Fibonacci Analysis
Based on Binance's swing low of $0.000368 and the recent high of $0.0005925, the 23.6% Fibonacci level is at $0.000540, the 38.2% level at $0.000507, and the 50% level at $0.000480.
The Weekly chart is still in recovery, the Daily chart shows strengthening momentum, while the 4H and 1H charts need to hold the breakout area to prevent the rally from turning into a correction.
Bullish Scenario:
If HOT can hold above $0.000540 and break out above $0.0005925, there is potential for a move toward $0.000654. The next extension is around $0.000731.
Bearish Scenario:
If HOT fails to hold $0.000540, the price could retrace to $0.000507–$0.000480. Selling pressure could increase if this area is also breached.
Latest Holo News:
HoloFuel officially began converting HOT on November 1, 2026, through the Unyt app. HoloFuel is designed as a payment system for decentralized hosting services, AI chatbots, and digital identity.
Market activity has also increased. Open interest was reported at around $9.41 million, and spot inflows are beginning to strengthen. However, rising open interest also means that volatility and liquidation risks should be considered.
HOT is showing interesting momentum, but $0.0005925 is the next test. Don't rush to chase the price before a breakout is truly confirmed.
{future}(HOTUSDT)
$HOT — Momentum for HoloFuel: Is the Rally Continuing?
Live price: $0.0005761
Today's high: $0.0005925
HOT has seen a surge in momentum after previously trading in the $0.000368–$0.000482 range. The price is now approaching the recent high of $0.0005925, making this an important resistance area.
Support: $0.000540 / $0.000507 / $0.000480
Resistance: $0.0005925 / $0.000654 / $0.000731
Weekly, Daily, 4H & 1H Fibonacci Analysis
Based on Binance's swing low of $0.000368 and the recent high of $0.0005925, the 23.6% Fibonacci level is at $0.000540, the 38.2% level at $0.000507, and the 50% level at $0.000480.
The Weekly chart is still in recovery, the Daily chart shows strengthening momentum, while the 4H and 1H charts need to hold the breakout area to prevent the rally from turning into a correction.
Bullish Scenario:
If HOT can hold above $0.000540 and break out above $0.0005925, there is potential for a move toward $0.000654. The next extension is around $0.000731.
Bearish Scenario:
If HOT fails to hold $0.000540, the price could retrace to $0.000507–$0.000480. Selling pressure could increase if this area is also breached.
Latest Holo News:
HoloFuel officially began converting HOT on November 1, 2026, through the Unyt app. HoloFuel is designed as a payment system for decentralized hosting services, AI chatbots, and digital identity.
Market activity has also increased. Open interest was reported at around $9.41 million, and spot inflows are beginning to strengthen. However, rising open interest also means that volatility and liquidation risks should be considered.
HOT is showing interesting momentum, but $0.0005925 is the next test. Don't rush to chase the price before a breakout is truly confirmed.
Live price: $0.0005761
Today's high: $0.0005925
HOT has seen a surge in momentum after previously trading in the $0.000368–$0.000482 range. The price is now approaching the recent high of $0.0005925, making this an important resistance area.
Support: $0.000540 / $0.000507 / $0.000480
Resistance: $0.0005925 / $0.000654 / $0.000731
Weekly, Daily, 4H & 1H Fibonacci Analysis
Based on Binance's swing low of $0.000368 and the recent high of $0.0005925, the 23.6% Fibonacci level is at $0.000540, the 38.2% level at $0.000507, and the 50% level at $0.000480.
The Weekly chart is still in recovery, the Daily chart shows strengthening momentum, while the 4H and 1H charts need to hold the breakout area to prevent the rally from turning into a correction.
Bullish Scenario:
If HOT can hold above $0.000540 and break out above $0.0005925, there is potential for a move toward $0.000654. The next extension is around $0.000731.
Bearish Scenario:
If HOT fails to hold $0.000540, the price could retrace to $0.000507–$0.000480. Selling pressure could increase if this area is also breached.
Latest Holo News:
HoloFuel officially began converting HOT on November 1, 2026, through the Unyt app. HoloFuel is designed as a payment system for decentralized hosting services, AI chatbots, and digital identity.
Market activity has also increased. Open interest was reported at around $9.41 million, and spot inflows are beginning to strengthen. However, rising open interest also means that volatility and liquidation risks should be considered.
HOT is showing interesting momentum, but $0.0005925 is the next test. Don't rush to chase the price before a breakout is truly confirmed.
STAY LONG ✊🏻
SHORT 🔥
22 hr(s) left
1
569
·
--
Bullish
October 31, 2026, marks a historic moment for Bitcoin. It is exactly 18 years since the Bitcoin whitepaper was introduced by the mysterious figure known as Satoshi Nakamoto.
But BTC’s journey isn’t a story of prices that only go up. It has gone through many phases—from being underestimated and experiencing market crashes to facing various crises, and finally attracting attention from major institutions and governments.
October 31, 2026, marks a historic moment for Bitcoin. It is exactly 18 years since the Bitcoin whitepaper was introduced by the mysterious figure known as Satoshi Nakamoto.
But BTC’s journey isn’t a story of prices that only go up. It has gone through many phases—from being underestimated and experiencing market crashes to facing various crises, and finally attracting attention from major institutions and governments.
But BTC’s journey isn’t a story of prices that only go up. It has gone through many phases—from being underestimated and experiencing market crashes to facing various crises, and finally attracting attention from major institutions and governments.
RizkyMauladi
·
--
BITCOIN AT 18: FROM A SMALL EXPERIMENT TO A GLOBAL ASSET
FROM A SMALL EXPERIMENT TO A GLOBAL ASSET
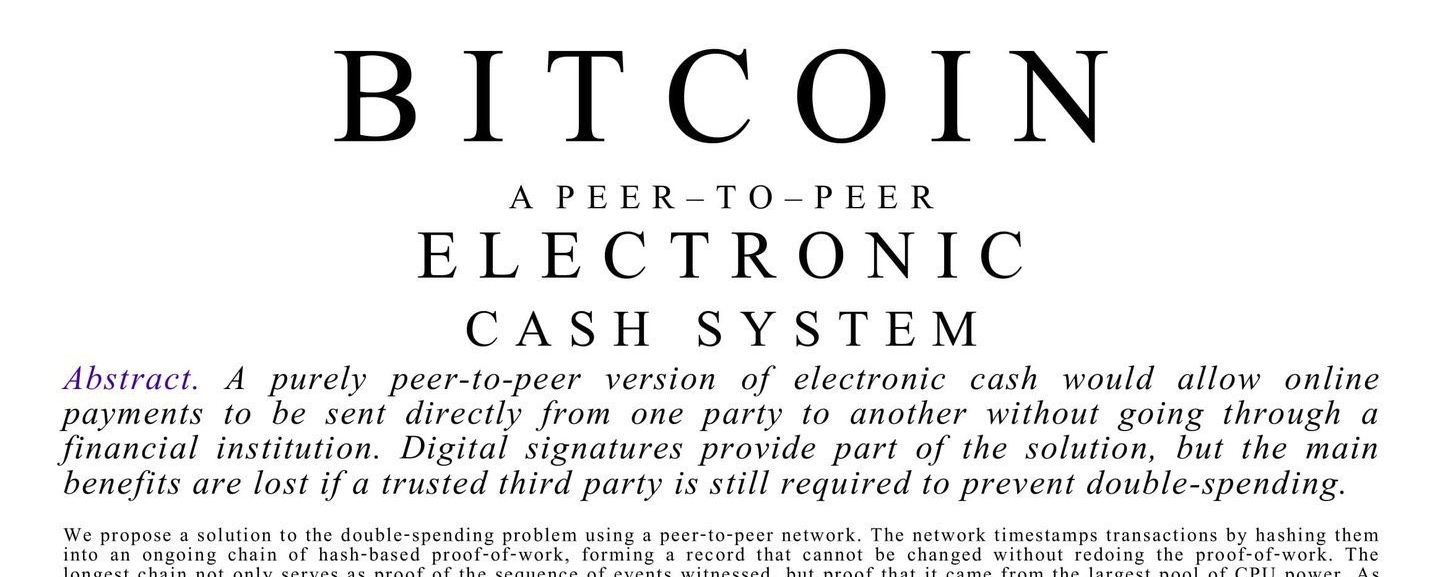
October 31, 2026, marks a historic moment for Bitcoin. It is exactly 18 years since the Bitcoin white paper was introduced by the mysterious figure known as Satoshi Nakamoto.
But BTC’s journey hasn’t been a story of prices rising steadily. It has gone through many phases, from being dismissed and enduring market crashes to weathering various crises, before finally attracting the attention of major institutions and governments.
Let’s look at Bitcoin’s journey over the past 18 years.
2008 — The beginning of an idea
October 31, 2026, marks a historic moment for Bitcoin. It is exactly 18 years since the Bitcoin white paper was introduced by the mysterious figure known as Satoshi Nakamoto.
But BTC’s journey hasn’t been a story of prices rising steadily. It has gone through many phases, from being dismissed and enduring market crashes to weathering various crises, before finally attracting the attention of major institutions and governments.
Let’s look at Bitcoin’s journey over the past 18 years.
2008 — The beginning of an idea
1
34
·
--
Article
BITCOIN AT 18: FROM A SMALL EXPERIMENT TO A GLOBAL ASSETFROM A SMALL EXPERIMENT TO A GLOBAL ASSET
October 31, 2026, marks a historic moment for Bitcoin. It is exactly 18 years since the Bitcoin white paper was introduced by the mysterious figure known as Satoshi Nakamoto.
But BTC’s journey hasn’t been a story of prices rising steadily. It has gone through many phases, from being dismissed and enduring market crashes to weathering various crises, before finally attracting the attention of major institutions and governments.
Let’s look at Bitcoin’s journey over the past 18 years.
2008 — The beginning of an idea
BITCOIN AT 18: FROM A SMALL EXPERIMENT TO A GLOBAL ASSET
FROM A SMALL EXPERIMENT TO A GLOBAL ASSET
October 31, 2026, marks a historic moment for Bitcoin. It is exactly 18 years since the Bitcoin white paper was introduced by the mysterious figure known as Satoshi Nakamoto.
But BTC’s journey hasn’t been a story of prices rising steadily. It has gone through many phases, from being dismissed and enduring market crashes to weathering various crises, before finally attracting the attention of major institutions and governments.
Let’s look at Bitcoin’s journey over the past 18 years.
2008 — The beginning of an idea
October 31, 2026, marks a historic moment for Bitcoin. It is exactly 18 years since the Bitcoin white paper was introduced by the mysterious figure known as Satoshi Nakamoto.
But BTC’s journey hasn’t been a story of prices rising steadily. It has gone through many phases, from being dismissed and enduring market crashes to weathering various crises, before finally attracting the attention of major institutions and governments.
Let’s look at Bitcoin’s journey over the past 18 years.
2008 — The beginning of an idea
1
3
52
·
--
Bullish
Verified
$SNDK — Sandisk Corporation | Rebound or Further Correction?
SNDK is still at $1,179.85, in a correction phase following fairly strong selling pressure. The support area will determine whether the price can hold and begin a rebound.
Support: $1,148 / $1,112 / $1,053
Resistance: $1,196 / $1,241 / $1,296
Daily Fibonacci Analysis
On the daily chart, the price is at the 78.6% Fibonacci retracement level of the $972.20–$1,909 swing. The short-term bias remains bearish as long as resistance has not been reclaimed.
Bullish Scenario:
If support at $1,148 holds and the price reclaims $1,196, a rebound toward $1,241 and then $1,296 could begin to take shape.
Bearish Scenario:
If $1,148 is breached, selling pressure could continue toward $1,112 and $1,053. Losing that area could increase the risk of a correction.
Latest Sandisk News:
Sandisk reported Q1 FY2027 revenue of $11.03 billion, up 23% quarter over quarter. The company also forecast Q2 revenue of $12.2–$12.6 billion and announced an 8:1 stock split scheduled to take effect on November 20, 2026.
On the other hand, Kioxia’s weaker outlook, linked to a slowdown in NAND price increases, poses a risk to sentiment in the memory sector.
Fundamentally, Sandisk’s outlook remains attractive, but technically, the price needs to confirm a recovery. Patience in waiting for key levels to be reclaimed remains an important part of risk management.
{future}(SNDKUSDT)
$SNDK — Sandisk Corporation | Rebound or Further Correction?
SNDK is still at $1,179.85, in a correction phase following fairly strong selling pressure. The support area will determine whether the price can hold and begin a rebound.
Support: $1,148 / $1,112 / $1,053
Resistance: $1,196 / $1,241 / $1,296
Daily Fibonacci Analysis
On the daily chart, the price is at the 78.6% Fibonacci retracement level of the $972.20–$1,909 swing. The short-term bias remains bearish as long as resistance has not been reclaimed.
Bullish Scenario:
If support at $1,148 holds and the price reclaims $1,196, a rebound toward $1,241 and then $1,296 could begin to take shape.
Bearish Scenario:
If $1,148 is breached, selling pressure could continue toward $1,112 and $1,053. Losing that area could increase the risk of a correction.
Latest Sandisk News:
Sandisk reported Q1 FY2027 revenue of $11.03 billion, up 23% quarter over quarter. The company also forecast Q2 revenue of $12.2–$12.6 billion and announced an 8:1 stock split scheduled to take effect on November 20, 2026.
On the other hand, Kioxia’s weaker outlook, linked to a slowdown in NAND price increases, poses a risk to sentiment in the memory sector.
Fundamentally, Sandisk’s outlook remains attractive, but technically, the price needs to confirm a recovery. Patience in waiting for key levels to be reclaimed remains an important part of risk management.
SNDK is still at $1,179.85, in a correction phase following fairly strong selling pressure. The support area will determine whether the price can hold and begin a rebound.
Support: $1,148 / $1,112 / $1,053
Resistance: $1,196 / $1,241 / $1,296
Daily Fibonacci Analysis
On the daily chart, the price is at the 78.6% Fibonacci retracement level of the $972.20–$1,909 swing. The short-term bias remains bearish as long as resistance has not been reclaimed.
Bullish Scenario:
If support at $1,148 holds and the price reclaims $1,196, a rebound toward $1,241 and then $1,296 could begin to take shape.
Bearish Scenario:
If $1,148 is breached, selling pressure could continue toward $1,112 and $1,053. Losing that area could increase the risk of a correction.
Latest Sandisk News:
Sandisk reported Q1 FY2027 revenue of $11.03 billion, up 23% quarter over quarter. The company also forecast Q2 revenue of $12.2–$12.6 billion and announced an 8:1 stock split scheduled to take effect on November 20, 2026.
On the other hand, Kioxia’s weaker outlook, linked to a slowdown in NAND price increases, poses a risk to sentiment in the memory sector.
Fundamentally, Sandisk’s outlook remains attractive, but technically, the price needs to confirm a recovery. Patience in waiting for key levels to be reclaimed remains an important part of risk management.
1
261
·
--
Bullish
$ARIA – Momentum Still Being Tested, Volume Increased Dramatically in 1 Hour?
ARIA is currently at 0.12135, after briefly touching a daily high of 0.12498.
The 0.12498 area is the nearest resistance that needs to be broken. On the support side, confirmation of demand is not strong enough based on the available chart data, so I don't want to set a price level without a valid basis.
Bullish Scenario:
If ARIA can break above 0.12498 and hold its price above that level, there is still a chance for its upward momentum to continue.
Bearish Scenario:
If it is rejected again at the resistance area and selling pressure increases, the risk of a correction should be watched. Look for the formation of new support before expecting a recovery.
Fundamentals & News:
No new official news catalysts from AriaAI have been confirmed today. The latest market analysis also highlights relatively thin liquidity and a lack of clear new fundamental drivers.
ARIA still needs breakout confirmation to demonstrate further strength. Don't rush to chase momentum; let price action and volume provide confirmation.
{future}(ARIAUSDT)
$ARIA – Momentum Still Being Tested, Volume Increased Dramatically in 1 Hour?
ARIA is currently at 0.12135, after briefly touching a daily high of 0.12498.
The 0.12498 area is the nearest resistance that needs to be broken. On the support side, confirmation of demand is not strong enough based on the available chart data, so I don't want to set a price level without a valid basis.
Bullish Scenario:
If ARIA can break above 0.12498 and hold its price above that level, there is still a chance for its upward momentum to continue.
Bearish Scenario:
If it is rejected again at the resistance area and selling pressure increases, the risk of a correction should be watched. Look for the formation of new support before expecting a recovery.
Fundamentals & News:
No new official news catalysts from AriaAI have been confirmed today. The latest market analysis also highlights relatively thin liquidity and a lack of clear new fundamental drivers.
ARIA still needs breakout confirmation to demonstrate further strength. Don't rush to chase momentum; let price action and volume provide confirmation.
ARIA is currently at 0.12135, after briefly touching a daily high of 0.12498.
The 0.12498 area is the nearest resistance that needs to be broken. On the support side, confirmation of demand is not strong enough based on the available chart data, so I don't want to set a price level without a valid basis.
Bullish Scenario:
If ARIA can break above 0.12498 and hold its price above that level, there is still a chance for its upward momentum to continue.
Bearish Scenario:
If it is rejected again at the resistance area and selling pressure increases, the risk of a correction should be watched. Look for the formation of new support before expecting a recovery.
Fundamentals & News:
No new official news catalysts from AriaAI have been confirmed today. The latest market analysis also highlights relatively thin liquidity and a lack of clear new fundamental drivers.
ARIA still needs breakout confirmation to demonstrate further strength. Don't rush to chase momentum; let price action and volume provide confirmation.
2
1
580
·
--
Bullish
Verified
$INTC – Selling Pressure Remains Dominant, Waiting for a Rebound
INTC is currently trading around $66.30. After facing significant selling pressure, Intel stock is approaching an important support area.
Technical Levels:
- Support 1: $64.80
- Support 2: $60.88
- Resistance 1: $67.30
- Resistance 2: $70.67
Bullish Scenario:
If INTC can hold the $64.80 area and break back above $67.30, the potential for a rebound toward $70.67 begins to emerge. Any gains should be accompanied by supportive trading volume.
Bearish Scenario:
If the $64.80 support is breached, selling pressure could continue toward $60.88. For now, the daily trend remains tilted bearish, although selling pressure is nearing oversold territory.
Latest Intel News:
In its Q3 2026 report, released on October 29, Intel reported:
- Revenue reached $16.5 billion, up 21% YoY.
- Data Center & AI grew 78%.
- Intel Foundry grew 58%.
- A slowdown in the PC market remains a challenge through the first half of 2027.
Developments in Intel’s AI and Foundry businesses are positive catalysts, but the company still needs to demonstrate consistent growth and profitability.
INTC has an attractive fundamental outlook, particularly due to its AI and Foundry expansion. However, a trend reversal has not yet been confirmed technically.
There is no need to rush into chasing a rebound. Let the market show a clearer direction before making a decision.
{future}(INTCUSDT)
$INTC – Selling Pressure Remains Dominant, Waiting for a Rebound
INTC is currently trading around $66.30. After facing significant selling pressure, Intel stock is approaching an important support area.
Technical Levels:
- Support 1: $64.80
- Support 2: $60.88
- Resistance 1: $67.30
- Resistance 2: $70.67
Bullish Scenario:
If INTC can hold the $64.80 area and break back above $67.30, the potential for a rebound toward $70.67 begins to emerge. Any gains should be accompanied by supportive trading volume.
Bearish Scenario:
If the $64.80 support is breached, selling pressure could continue toward $60.88. For now, the daily trend remains tilted bearish, although selling pressure is nearing oversold territory.
Latest Intel News:
In its Q3 2026 report, released on October 29, Intel reported:
- Revenue reached $16.5 billion, up 21% YoY.
- Data Center & AI grew 78%.
- Intel Foundry grew 58%.
- A slowdown in the PC market remains a challenge through the first half of 2027.
Developments in Intel’s AI and Foundry businesses are positive catalysts, but the company still needs to demonstrate consistent growth and profitability.
INTC has an attractive fundamental outlook, particularly due to its AI and Foundry expansion. However, a trend reversal has not yet been confirmed technically.
There is no need to rush into chasing a rebound. Let the market show a clearer direction before making a decision.
INTC is currently trading around $66.30. After facing significant selling pressure, Intel stock is approaching an important support area.
Technical Levels:
- Support 1: $64.80
- Support 2: $60.88
- Resistance 1: $67.30
- Resistance 2: $70.67
Bullish Scenario:
If INTC can hold the $64.80 area and break back above $67.30, the potential for a rebound toward $70.67 begins to emerge. Any gains should be accompanied by supportive trading volume.
Bearish Scenario:
If the $64.80 support is breached, selling pressure could continue toward $60.88. For now, the daily trend remains tilted bearish, although selling pressure is nearing oversold territory.
Latest Intel News:
In its Q3 2026 report, released on October 29, Intel reported:
- Revenue reached $16.5 billion, up 21% YoY.
- Data Center & AI grew 78%.
- Intel Foundry grew 58%.
- A slowdown in the PC market remains a challenge through the first half of 2027.
Developments in Intel’s AI and Foundry businesses are positive catalysts, but the company still needs to demonstrate consistent growth and profitability.
INTC has an attractive fundamental outlook, particularly due to its AI and Foundry expansion. However, a trend reversal has not yet been confirmed technically.
There is no need to rush into chasing a rebound. Let the market show a clearer direction before making a decision.
1
743
·
--
Bullish
Verified
$SOPH — Fundamental Pressure Increases, Mainnet Scheduled to End in November
SOPH is currently at 0.001705 USDT. The price remains in a short-term recovery phase, but the overall daily trend still shows bearish pressure.
Bullish Scenario:
If it can hold the 0.001600 area and break through resistance at 0.001949, the way could open for a move toward 0.002245.
Bearish Scenario:
If the price falls below 0.001600, selling pressure could drive SOPH to test support at 0.001412. If that level breaks, the next support is at 0.001198.
Latest News — November 2, 2026:
Sophon announced that Sophon Mainnet will be discontinued on November 30, 2026.
Users are asked to withdraw their SOPH, ETH, USDC, and other assets before November 25. After that, the infrastructure and several related services will begin to shut down.
However, one important point: the SOPH token will not be discontinued. SOPH will remain on Ethereum, and users can move their tokens from Sophon Chain through the official bridge.
This change means SOPH's outlook needs to be reassessed, particularly in terms of ecosystem sustainability and investor confidence.
For now, it's not just the chart that needs attention, but also how Sophon's ecosystem transition unfolds through the end of November.
{future}(SOPHUSDT)
$SOPH — Fundamental Pressure Increases, Mainnet Scheduled to End in November
SOPH is currently at 0.001705 USDT. The price remains in a short-term recovery phase, but the overall daily trend still shows bearish pressure.
Bullish Scenario:
If it can hold the 0.001600 area and break through resistance at 0.001949, the way could open for a move toward 0.002245.
Bearish Scenario:
If the price falls below 0.001600, selling pressure could drive SOPH to test support at 0.001412. If that level breaks, the next support is at 0.001198.
Latest News — November 2, 2026:
Sophon announced that Sophon Mainnet will be discontinued on November 30, 2026.
Users are asked to withdraw their SOPH, ETH, USDC, and other assets before November 25. After that, the infrastructure and several related services will begin to shut down.
However, one important point: the SOPH token will not be discontinued. SOPH will remain on Ethereum, and users can move their tokens from Sophon Chain through the official bridge.
This change means SOPH's outlook needs to be reassessed, particularly in terms of ecosystem sustainability and investor confidence.
For now, it's not just the chart that needs attention, but also how Sophon's ecosystem transition unfolds through the end of November.
SOPH is currently at 0.001705 USDT. The price remains in a short-term recovery phase, but the overall daily trend still shows bearish pressure.
Bullish Scenario:
If it can hold the 0.001600 area and break through resistance at 0.001949, the way could open for a move toward 0.002245.
Bearish Scenario:
If the price falls below 0.001600, selling pressure could drive SOPH to test support at 0.001412. If that level breaks, the next support is at 0.001198.
Latest News — November 2, 2026:
Sophon announced that Sophon Mainnet will be discontinued on November 30, 2026.
Users are asked to withdraw their SOPH, ETH, USDC, and other assets before November 25. After that, the infrastructure and several related services will begin to shut down.
However, one important point: the SOPH token will not be discontinued. SOPH will remain on Ethereum, and users can move their tokens from Sophon Chain through the official bridge.
This change means SOPH's outlook needs to be reassessed, particularly in terms of ecosystem sustainability and investor confidence.
For now, it's not just the chart that needs attention, but also how Sophon's ecosystem transition unfolds through the end of November.
1
271
·
--
Bullish
$QNT — Trading Activity Picks Up, Buyers and Sellers Still Competing
Quant (QNT) is at 196.87 USDT. The 196.67 area is the nearest support, while 205.36 is the key resistance that needs to be reclaimed.
Bullish Scenario: If it holds above 196.67 and breaks through 205.36, a move toward 217.23 may become possible.
Bearish Scenario: If 196.67 is breached, a potential correction toward 186.72 should be watched for.
Latest Market Update — November 2:
QNT trading activity has picked up. Over the 24-hour monitoring period, 76 volume spikes were recorded, with buying and selling activity fairly balanced.
However, net flows from the volume spikes remain negative at around US$188,000. This means selling pressure has not fully eased, and further price gains still require stronger buyer support.
On the fundamental side, Quant's development work with The Clearing House on payment infrastructure for tokenized deposits remains a long-term catalyst.
QNT remains worth watching, but its next move will depend heavily on buyers' ability to hold support and reclaim resistance.
{spot}(QNTUSDT)
$QNT — Trading Activity Picks Up, Buyers and Sellers Still Competing
Quant (QNT) is at 196.87 USDT. The 196.67 area is the nearest support, while 205.36 is the key resistance that needs to be reclaimed.
Bullish Scenario: If it holds above 196.67 and breaks through 205.36, a move toward 217.23 may become possible.
Bearish Scenario: If 196.67 is breached, a potential correction toward 186.72 should be watched for.
Latest Market Update — November 2:
QNT trading activity has picked up. Over the 24-hour monitoring period, 76 volume spikes were recorded, with buying and selling activity fairly balanced.
However, net flows from the volume spikes remain negative at around US$188,000. This means selling pressure has not fully eased, and further price gains still require stronger buyer support.
On the fundamental side, Quant's development work with The Clearing House on payment infrastructure for tokenized deposits remains a long-term catalyst.
QNT remains worth watching, but its next move will depend heavily on buyers' ability to hold support and reclaim resistance.
Quant (QNT) is at 196.87 USDT. The 196.67 area is the nearest support, while 205.36 is the key resistance that needs to be reclaimed.
Bullish Scenario: If it holds above 196.67 and breaks through 205.36, a move toward 217.23 may become possible.
Bearish Scenario: If 196.67 is breached, a potential correction toward 186.72 should be watched for.
Latest Market Update — November 2:
QNT trading activity has picked up. Over the 24-hour monitoring period, 76 volume spikes were recorded, with buying and selling activity fairly balanced.
However, net flows from the volume spikes remain negative at around US$188,000. This means selling pressure has not fully eased, and further price gains still require stronger buyer support.
On the fundamental side, Quant's development work with The Clearing House on payment infrastructure for tokenized deposits remains a long-term catalyst.
QNT remains worth watching, but its next move will depend heavily on buyers' ability to hold support and reclaim resistance.
1
587
·
--
Bullish
Verified
$ZEC — Momentum Holds, NU7 Upgrade Becomes the Next Catalyst
Zcash is currently at 1,261.50 USDT. The price is trading around the intraday pivot at 1,262, making the next move key to determining short-term momentum.
Bullish Scenario:
If ZEC can hold above 1,262 and break through the 1,301 resistance, the path toward 1,365 could begin to open up.
Bearish Scenario:
If it fails to hold the 1,236 area, selling pressure could push the price to test support at 1,214. If that level is breached, the 1,176 area will be the next level to watch.
Fundamental Update:
Zcash is preparing for the NU7 network upgrade, scheduled for around November 5, 2026. The update is planned to shorten block times from 75 seconds to 25 seconds.
The upgrade is a catalyst worth watching, particularly for the development of Zcash’s technology and transaction experience.
For now, 1,262 is the key level. A breakout above resistance needs confirmation, while a loss of support warrants caution.
The fundamentals give investors a reason to watch ZEC, but market confirmation will remain decisive for the next move.
{future}(ZECUSDT)
$ZEC — Momentum Holds, NU7 Upgrade Becomes the Next Catalyst
Zcash is currently at 1,261.50 USDT. The price is trading around the intraday pivot at 1,262, making the next move key to determining short-term momentum.
Bullish Scenario:
If ZEC can hold above 1,262 and break through the 1,301 resistance, the path toward 1,365 could begin to open up.
Bearish Scenario:
If it fails to hold the 1,236 area, selling pressure could push the price to test support at 1,214. If that level is breached, the 1,176 area will be the next level to watch.
Fundamental Update:
Zcash is preparing for the NU7 network upgrade, scheduled for around November 5, 2026. The update is planned to shorten block times from 75 seconds to 25 seconds.
The upgrade is a catalyst worth watching, particularly for the development of Zcash’s technology and transaction experience.
For now, 1,262 is the key level. A breakout above resistance needs confirmation, while a loss of support warrants caution.
The fundamentals give investors a reason to watch ZEC, but market confirmation will remain decisive for the next move.
Zcash is currently at 1,261.50 USDT. The price is trading around the intraday pivot at 1,262, making the next move key to determining short-term momentum.
Bullish Scenario:
If ZEC can hold above 1,262 and break through the 1,301 resistance, the path toward 1,365 could begin to open up.
Bearish Scenario:
If it fails to hold the 1,236 area, selling pressure could push the price to test support at 1,214. If that level is breached, the 1,176 area will be the next level to watch.
Fundamental Update:
Zcash is preparing for the NU7 network upgrade, scheduled for around November 5, 2026. The update is planned to shorten block times from 75 seconds to 25 seconds.
The upgrade is a catalyst worth watching, particularly for the development of Zcash’s technology and transaction experience.
For now, 1,262 is the key level. A breakout above resistance needs confirmation, while a loss of support warrants caution.
The fundamentals give investors a reason to watch ZEC, but market confirmation will remain decisive for the next move.
LONG? 🚀
58%
SHORT? 🤔
42%
69 votes • Voting closed
2
1.8k
·
--
Bullish
Verified
$ESPORTS — Momentum Strengthens, Fundamental Risks Still Loom
ESPORTS is currently at 0.016292 USDT. Price action remains worth watching, especially after trading activity increased.
Bullish Scenario:
If buying momentum holds and the price manages to break through the nearest resistance, there is still room for the recovery to continue.
Bearish Scenario:
If selling pressure rises again, the correction could continue. High volatility makes it important to confirm the market direction.
Latest News:
Yooldo has once again come into focus after DWF Labs affiliate filed a $141 million lawsuit against BitGo in the London High Court. The lawsuit concerns alleged sales of ESPORTS tokens before the lock-up period ended.
The case is ongoing, and the allegations have not yet been ruled on by the court. However, token distribution concerns and market confidence remain factors to watch.
ESPORTS has potential in the Web3 gaming sector, but fundamental sentiment is not yet entirely favorable.
As the close approaches, the main focus remains on confirming momentum and the price's ability to withstand selling pressure.
{future}(ESPORTSUSDT)
$ESPORTS — Momentum Strengthens, Fundamental Risks Still Loom
ESPORTS is currently at 0.016292 USDT. Price action remains worth watching, especially after trading activity increased.
Bullish Scenario:
If buying momentum holds and the price manages to break through the nearest resistance, there is still room for the recovery to continue.
Bearish Scenario:
If selling pressure rises again, the correction could continue. High volatility makes it important to confirm the market direction.
Latest News:
Yooldo has once again come into focus after DWF Labs affiliate filed a $141 million lawsuit against BitGo in the London High Court. The lawsuit concerns alleged sales of ESPORTS tokens before the lock-up period ended.
The case is ongoing, and the allegations have not yet been ruled on by the court. However, token distribution concerns and market confidence remain factors to watch.
ESPORTS has potential in the Web3 gaming sector, but fundamental sentiment is not yet entirely favorable.
As the close approaches, the main focus remains on confirming momentum and the price's ability to withstand selling pressure.
ESPORTS is currently at 0.016292 USDT. Price action remains worth watching, especially after trading activity increased.
Bullish Scenario:
If buying momentum holds and the price manages to break through the nearest resistance, there is still room for the recovery to continue.
Bearish Scenario:
If selling pressure rises again, the correction could continue. High volatility makes it important to confirm the market direction.
Latest News:
Yooldo has once again come into focus after DWF Labs affiliate filed a $141 million lawsuit against BitGo in the London High Court. The lawsuit concerns alleged sales of ESPORTS tokens before the lock-up period ended.
The case is ongoing, and the allegations have not yet been ruled on by the court. However, token distribution concerns and market confidence remain factors to watch.
ESPORTS has potential in the Web3 gaming sector, but fundamental sentiment is not yet entirely favorable.
As the close approaches, the main focus remains on confirming momentum and the price's ability to withstand selling pressure.
1
672
·
--
Bearish
BINANCE HACKED FOR US$6.3 BILLION, FBI OFFICIALLY POINTS TO NORTH KOREA!
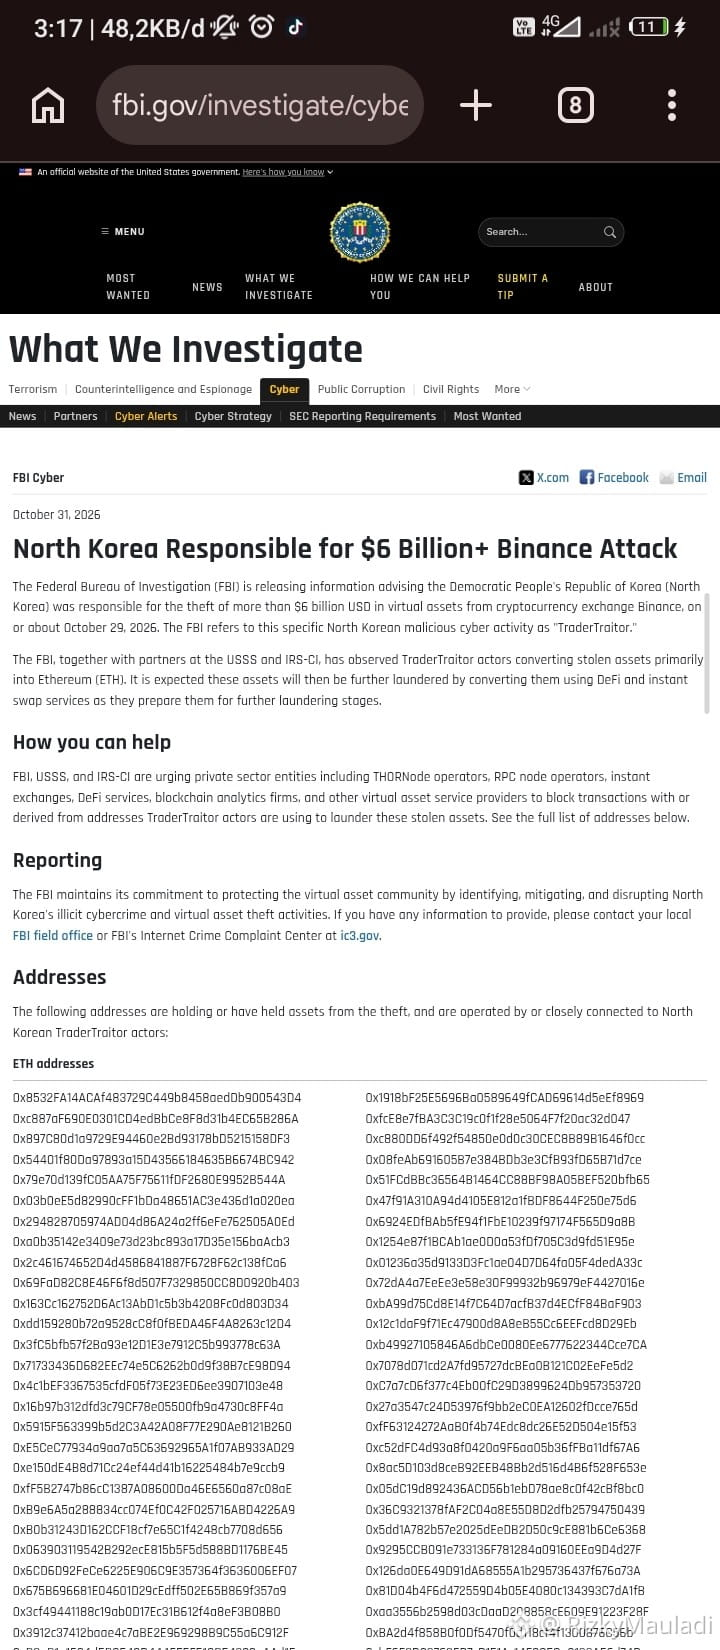
The crypto world has been shaken once again by a major hack. On October 29, 2026, Binance suffered the theft of digital assets worth approximately US$6.36 billion through unauthorized withdrawals from hot wallets across 10 blockchain networks.
Binance’s initial investigation pointed to a DevOps engineer’s laptop that was suspected of being hacked. However, Binance later found indications of additional points of compromise. The initial investigation found no evidence that wallet private keys had been leaked.
Binance immediately suspended withdrawals, worked with blockchain security firms, and helped freeze around US$3 billion in related assets.
The biggest development came on October 31, when the FBI officially stated that North Korea was behind the attack, carried out by a hacker group called TraderTraitor.
Why did the FBI get involved?
Because the stolen funds were beginning to be converted into ETH and could potentially be laundered through DeFi services and instant swaps. The FBI, along with the US Secret Service and IRS-CI, asked various crypto service providers to block wallet addresses linked to the attackers.
Binance said it would cover all losses using funds from SAFU and company reserves. This means users will not bear the cost of those losses.
An important lesson from this incident: even an exchange as large as Binance still faces security risks. In the crypto industry, security is not just about wallet technology, but also internal access, authorization systems, and transaction monitoring.
The case is still unfolding. What matters now is how much of the assets can be recovered and how Binance improves its security systems.
#TraderTraitor $BTC
{spot}(BTCUSDT)
{spot}(BNBUSDT)
{spot}(ETHUSDT)
BINANCE HACKED FOR US$6.3 BILLION, FBI OFFICIALLY POINTS TO NORTH KOREA!
The crypto world has been shaken once again by a major hack. On October 29, 2026, Binance suffered the theft of digital assets worth approximately US$6.36 billion through unauthorized withdrawals from hot wallets across 10 blockchain networks.
Binance’s initial investigation pointed to a DevOps engineer’s laptop that was suspected of being hacked. However, Binance later found indications of additional points of compromise. The initial investigation found no evidence that wallet private keys had been leaked.
Binance immediately suspended withdrawals, worked with blockchain security firms, and helped freeze around US$3 billion in related assets.
The biggest development came on October 31, when the FBI officially stated that North Korea was behind the attack, carried out by a hacker group called TraderTraitor.
Why did the FBI get involved?
Because the stolen funds were beginning to be converted into ETH and could potentially be laundered through DeFi services and instant swaps. The FBI, along with the US Secret Service and IRS-CI, asked various crypto service providers to block wallet addresses linked to the attackers.
Binance said it would cover all losses using funds from SAFU and company reserves. This means users will not bear the cost of those losses.
An important lesson from this incident: even an exchange as large as Binance still faces security risks. In the crypto industry, security is not just about wallet technology, but also internal access, authorization systems, and transaction monitoring.
The case is still unfolding. What matters now is how much of the assets can be recovered and how Binance improves its security systems.
#TraderTraitor $BTC
The crypto world has been shaken once again by a major hack. On October 29, 2026, Binance suffered the theft of digital assets worth approximately US$6.36 billion through unauthorized withdrawals from hot wallets across 10 blockchain networks.
Binance’s initial investigation pointed to a DevOps engineer’s laptop that was suspected of being hacked. However, Binance later found indications of additional points of compromise. The initial investigation found no evidence that wallet private keys had been leaked.
Binance immediately suspended withdrawals, worked with blockchain security firms, and helped freeze around US$3 billion in related assets.
The biggest development came on October 31, when the FBI officially stated that North Korea was behind the attack, carried out by a hacker group called TraderTraitor.
Why did the FBI get involved?
Because the stolen funds were beginning to be converted into ETH and could potentially be laundered through DeFi services and instant swaps. The FBI, along with the US Secret Service and IRS-CI, asked various crypto service providers to block wallet addresses linked to the attackers.
Binance said it would cover all losses using funds from SAFU and company reserves. This means users will not bear the cost of those losses.
An important lesson from this incident: even an exchange as large as Binance still faces security risks. In the crypto industry, security is not just about wallet technology, but also internal access, authorization systems, and transaction monitoring.
The case is still unfolding. What matters now is how much of the assets can be recovered and how Binance improves its security systems.
#TraderTraitor $BTC
3
721
·
--
Bullish
$PREDICT — Price Recovery Still Faces Fibonacci Resistance
PREDICT is currently at 1.2635 USDT, after previously moving from a high of 1.99 to a low of 1.10.
Based on the Fibonacci Retracement of that range, 1.290 is the nearest resistance, followed by 1.442 and 1.545.
Bullish Scenario:
If it can reclaim 1.290 and hold above it, the path toward 1.442 and then 1.545 may open up. A breakout above 1.545 would strengthen the prospects for further recovery.
Bearish Scenario:
If it fails to break above 1.290 and loses the 1.20 area again, selling pressure could push the price to retest 1.10.
Fundamental Update:
Binance opened spot trading for PREDICT on October 30. However, the Predict.fun security incident involving around 400,000 USDT remains a concern, even though the team has stated its commitment to compensating affected users for their losses.
PREDICT has a catalyst in terms of market access, but confidence in the platform’s security remains an important factor.
A healthy recovery requires price confirmation and market confidence—not just listing momentum.
{future}(PREDICTUSDT)
$PREDICT — Price Recovery Still Faces Fibonacci Resistance
PREDICT is currently at 1.2635 USDT, after previously moving from a high of 1.99 to a low of 1.10.
Based on the Fibonacci Retracement of that range, 1.290 is the nearest resistance, followed by 1.442 and 1.545.
Bullish Scenario:
If it can reclaim 1.290 and hold above it, the path toward 1.442 and then 1.545 may open up. A breakout above 1.545 would strengthen the prospects for further recovery.
Bearish Scenario:
If it fails to break above 1.290 and loses the 1.20 area again, selling pressure could push the price to retest 1.10.
Fundamental Update:
Binance opened spot trading for PREDICT on October 30. However, the Predict.fun security incident involving around 400,000 USDT remains a concern, even though the team has stated its commitment to compensating affected users for their losses.
PREDICT has a catalyst in terms of market access, but confidence in the platform’s security remains an important factor.
A healthy recovery requires price confirmation and market confidence—not just listing momentum.
PREDICT is currently at 1.2635 USDT, after previously moving from a high of 1.99 to a low of 1.10.
Based on the Fibonacci Retracement of that range, 1.290 is the nearest resistance, followed by 1.442 and 1.545.
Bullish Scenario:
If it can reclaim 1.290 and hold above it, the path toward 1.442 and then 1.545 may open up. A breakout above 1.545 would strengthen the prospects for further recovery.
Bearish Scenario:
If it fails to break above 1.290 and loses the 1.20 area again, selling pressure could push the price to retest 1.10.
Fundamental Update:
Binance opened spot trading for PREDICT on October 30. However, the Predict.fun security incident involving around 400,000 USDT remains a concern, even though the team has stated its commitment to compensating affected users for their losses.
PREDICT has a catalyst in terms of market access, but confidence in the platform’s security remains an important factor.
A healthy recovery requires price confirmation and market confidence—not just listing momentum.
2
997
·
--
Bullish
Verified
$HYPE — Fundamental Catalysts Strengthen, Price Still Needs Confirmation
HYPE is currently at 86.88 USDT. After previously setting a record near 98.057, the price is still in a recovery phase and needs to prove its strength before resuming its uptrend.
Market Analysis
The 85 USDT area is a psychological level to watch. Meanwhile, the nearest resistance is around 90–92 USDT.
Bullish Scenario:
If the price can hold the 85 area and reclaim 90–92 USDT, there may be an opportunity to test the 95 area and the previous high.
Bearish Scenario:
If 85 fails to hold, selling pressure could push the price to test the 80 USDT area.
Fundamental Update:
Big news came from ICE, the parent company of the NYSE, which is partnering with Trade[XYZ] to bring perpetual futures markets built on Hyperliquid infrastructure to the United States.
In addition, ecosystem expansion is ongoing, including the development of traditional asset markets and pre-IPO asset trading on Hyperliquid.
However, one thing still needs attention: the HYPE token distribution schedule on November 6, which could add pressure on the supply side.
Fundamentally, Hyperliquid is building a bridge between DeFi and traditional financial markets. But when it comes to price, major catalysts still need confirmation from the market.
Adoption can build long-term value, but disciplined price analysis remains key.
{future}(HYPEUSDT)
$HYPE — Fundamental Catalysts Strengthen, Price Still Needs Confirmation
HYPE is currently at 86.88 USDT. After previously setting a record near 98.057, the price is still in a recovery phase and needs to prove its strength before resuming its uptrend.
Market Analysis
The 85 USDT area is a psychological level to watch. Meanwhile, the nearest resistance is around 90–92 USDT.
Bullish Scenario:
If the price can hold the 85 area and reclaim 90–92 USDT, there may be an opportunity to test the 95 area and the previous high.
Bearish Scenario:
If 85 fails to hold, selling pressure could push the price to test the 80 USDT area.
Fundamental Update:
Big news came from ICE, the parent company of the NYSE, which is partnering with Trade[XYZ] to bring perpetual futures markets built on Hyperliquid infrastructure to the United States.
In addition, ecosystem expansion is ongoing, including the development of traditional asset markets and pre-IPO asset trading on Hyperliquid.
However, one thing still needs attention: the HYPE token distribution schedule on November 6, which could add pressure on the supply side.
Fundamentally, Hyperliquid is building a bridge between DeFi and traditional financial markets. But when it comes to price, major catalysts still need confirmation from the market.
Adoption can build long-term value, but disciplined price analysis remains key.
HYPE is currently at 86.88 USDT. After previously setting a record near 98.057, the price is still in a recovery phase and needs to prove its strength before resuming its uptrend.
Market Analysis
The 85 USDT area is a psychological level to watch. Meanwhile, the nearest resistance is around 90–92 USDT.
Bullish Scenario:
If the price can hold the 85 area and reclaim 90–92 USDT, there may be an opportunity to test the 95 area and the previous high.
Bearish Scenario:
If 85 fails to hold, selling pressure could push the price to test the 80 USDT area.
Fundamental Update:
Big news came from ICE, the parent company of the NYSE, which is partnering with Trade[XYZ] to bring perpetual futures markets built on Hyperliquid infrastructure to the United States.
In addition, ecosystem expansion is ongoing, including the development of traditional asset markets and pre-IPO asset trading on Hyperliquid.
However, one thing still needs attention: the HYPE token distribution schedule on November 6, which could add pressure on the supply side.
Fundamentally, Hyperliquid is building a bridge between DeFi and traditional financial markets. But when it comes to price, major catalysts still need confirmation from the market.
Adoption can build long-term value, but disciplined price analysis remains key.
LONG? 🤔
58%
SHORT? ✊🏻
42%
65 votes • Voting closed
2
1.6k
·
--
Bullish
$IDOL — Momentum Remains Intact, Resistance Is Being Tested
IDOL is currently at 0.02328 USDT. After aggressive movement over the past few sessions, the price is starting to approach the 0.02420 resistance area.
Bullish Scenario:
If it can break through 0.02420 and hold above it, there is still potential for further gains toward 0.02560 and then the next resistance at 0.031411.
Bearish Scenario:
If it fails to break through 0.02420, the risk of a correction should still be watched. The psychological level of 0.02000 warrants attention if selling pressure increases.
IDOL still has interesting momentum, but further gains will require confirmation. There is no need to rush to chase the price while the market has yet to show a clear direction.
{future}(IDOLUSDT)
$IDOL — Momentum Remains Intact, Resistance Is Being Tested
IDOL is currently at 0.02328 USDT. After aggressive movement over the past few sessions, the price is starting to approach the 0.02420 resistance area.
Bullish Scenario:
If it can break through 0.02420 and hold above it, there is still potential for further gains toward 0.02560 and then the next resistance at 0.031411.
Bearish Scenario:
If it fails to break through 0.02420, the risk of a correction should still be watched. The psychological level of 0.02000 warrants attention if selling pressure increases.
IDOL still has interesting momentum, but further gains will require confirmation. There is no need to rush to chase the price while the market has yet to show a clear direction.
IDOL is currently at 0.02328 USDT. After aggressive movement over the past few sessions, the price is starting to approach the 0.02420 resistance area.
Bullish Scenario:
If it can break through 0.02420 and hold above it, there is still potential for further gains toward 0.02560 and then the next resistance at 0.031411.
Bearish Scenario:
If it fails to break through 0.02420, the risk of a correction should still be watched. The psychological level of 0.02000 warrants attention if selling pressure increases.
IDOL still has interesting momentum, but further gains will require confirmation. There is no need to rush to chase the price while the market has yet to show a clear direction.
LONG 🚀🚀
29%
SHORT 🙏🏻🙏🏻
71%
21 votes • Voting closed
1
638
·
--
Bullish
$ESPORTS — Strong Momentum, But Beware of Selling Pressure
ESPORTS briefly touched 0.022484 USDT and is now at 0.020900 USDT. It has corrected by around 7% from today's high.
Bullish Scenario:
If it can hold in the 0.0200 area, another test of 0.022484 remains possible. A breakout and hold above that level could confirm the continuation of the uptrend.
Bearish Scenario:
If 0.0200 is breached, selling pressure could intensify and the price may continue to correct.
ESPORTS is still worth watching. However, after an aggressive rally, waiting for confirmation is better than rushing to chase the price.
{future}(ESPORTSUSDT)
$ESPORTS — Strong Momentum, But Beware of Selling Pressure
ESPORTS briefly touched 0.022484 USDT and is now at 0.020900 USDT. It has corrected by around 7% from today's high.
Bullish Scenario:
If it can hold in the 0.0200 area, another test of 0.022484 remains possible. A breakout and hold above that level could confirm the continuation of the uptrend.
Bearish Scenario:
If 0.0200 is breached, selling pressure could intensify and the price may continue to correct.
ESPORTS is still worth watching. However, after an aggressive rally, waiting for confirmation is better than rushing to chase the price.
ESPORTS briefly touched 0.022484 USDT and is now at 0.020900 USDT. It has corrected by around 7% from today's high.
Bullish Scenario:
If it can hold in the 0.0200 area, another test of 0.022484 remains possible. A breakout and hold above that level could confirm the continuation of the uptrend.
Bearish Scenario:
If 0.0200 is breached, selling pressure could intensify and the price may continue to correct.
ESPORTS is still worth watching. However, after an aggressive rally, waiting for confirmation is better than rushing to chase the price.
LONG AGAIN 🔥🔥
37%
SHORT ✊🏻✊🏻
63%
52 votes • Voting closed
1
1.7k
Log in to explore more content
Join global crypto users on Binance Square
⚡️ Get latest and useful information about crypto.
💬 Trusted by the world’s largest crypto exchange.
👍 Discover real insights from verified creators.
Email / Phone number
Trending Topics
BinanceReopensWithdrawalsForMoreAssets
56,880 views
1,156 Discussing
Security Incident | Recovery Update #6: Withdrawals Reopen for More Assets (2026-11-03)
Binance Announcement
·179 Likes
·497.1k views
BinanceHourlyDepositsExceedWithdrawals
19,228 views
446 Discussing
AnthropicIPOPricedDownasInvestorsEye$1.5T
25 views
13 Discussing