
TheCryptoOnur
897 Posts

TheCryptoOnur
Social Media Content Creator / Full Stack Developer
57 Following
1.9K+ Followers
592 Liked
Posts
All
Quotes
Videos
📈 $CAKE · 1D
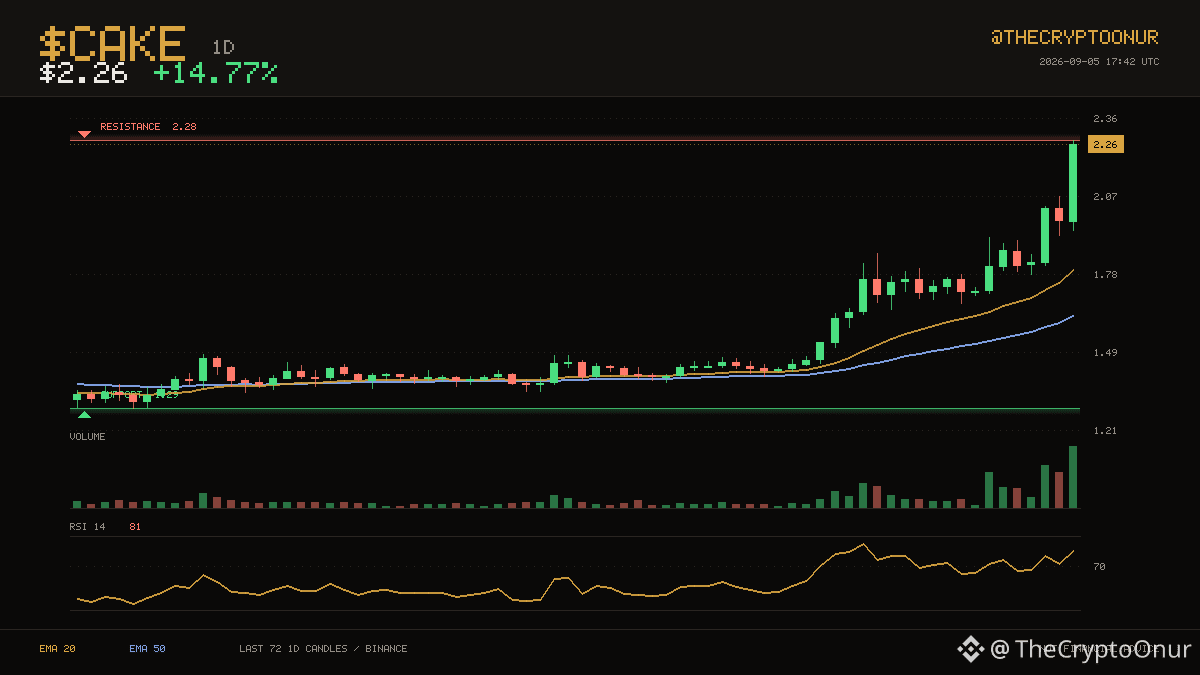
$CAKE sits at $2.26, with the 20 and 50 daily averages both below price. $2.28 has been the ceiling over the last two months and $CAKE is back at it. Price is holding in the upper third of that range. The ceiling is 0.7% away while the floor sits well below current levels. The 20 has stayed above the 50 for 56 candles. RSI is up at 81, which is stretched enough that pullbacks would not be a surprise. Over the past day it has traded between $1.94 and $2.28, sitting near the top of it now. The last 24 hours carried roughly 1.9x normal volume. Up 14.8% over 24 hours.
⚠️ DYOR
$CAKE #Trading
$CAKE sits at $2.26, with the 20 and 50 daily averages both below price. $2.28 has been the ceiling over the last two months and $CAKE is back at it. Price is holding in the upper third of that range. The ceiling is 0.7% away while the floor sits well below current levels. The 20 has stayed above the 50 for 56 candles. RSI is up at 81, which is stretched enough that pullbacks would not be a surprise. Over the past day it has traded between $1.94 and $2.28, sitting near the top of it now. The last 24 hours carried roughly 1.9x normal volume. Up 14.8% over 24 hours.
⚠️ DYOR
$CAKE #Trading
📈 $WLD · 1D
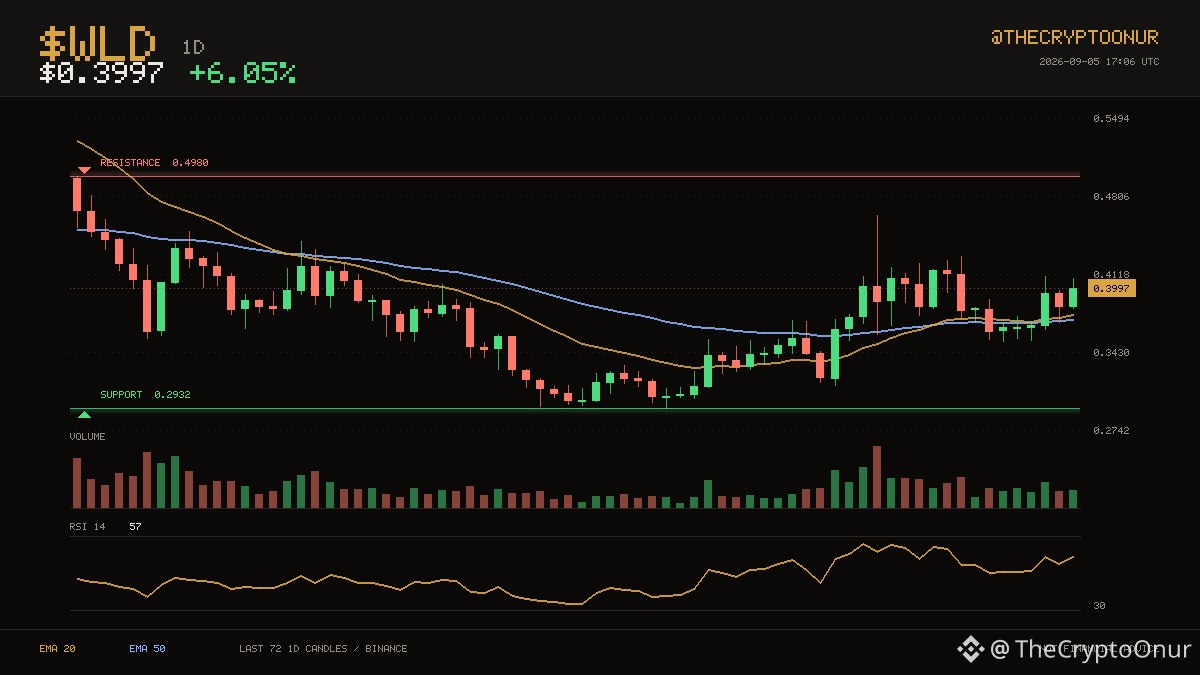
$WLD sits at $0.3997, with the 20 and 50 daily averages both below price. The two month range runs from $0.2932 up to $0.4980. That puts price in the middle of the range. Price is a long way from both ends of this range. The 20 crossed above the 50 recently, for only 11 candles, so this leg is still young. RSI at 57 is neutral, so momentum is not blocking a move either way. Over the past day it has traded between $0.3750 and $0.4082, sitting near the top of it now. Participation is light at about 0.4x average volume. Up 6.0% over 24 hours.
DYOR
$WLD #Trading
$WLD sits at $0.3997, with the 20 and 50 daily averages both below price. The two month range runs from $0.2932 up to $0.4980. That puts price in the middle of the range. Price is a long way from both ends of this range. The 20 crossed above the 50 recently, for only 11 candles, so this leg is still young. RSI at 57 is neutral, so momentum is not blocking a move either way. Over the past day it has traded between $0.3750 and $0.4082, sitting near the top of it now. Participation is light at about 0.4x average volume. Up 6.0% over 24 hours.
DYOR
$WLD #Trading
🟢 $NOM · 1H
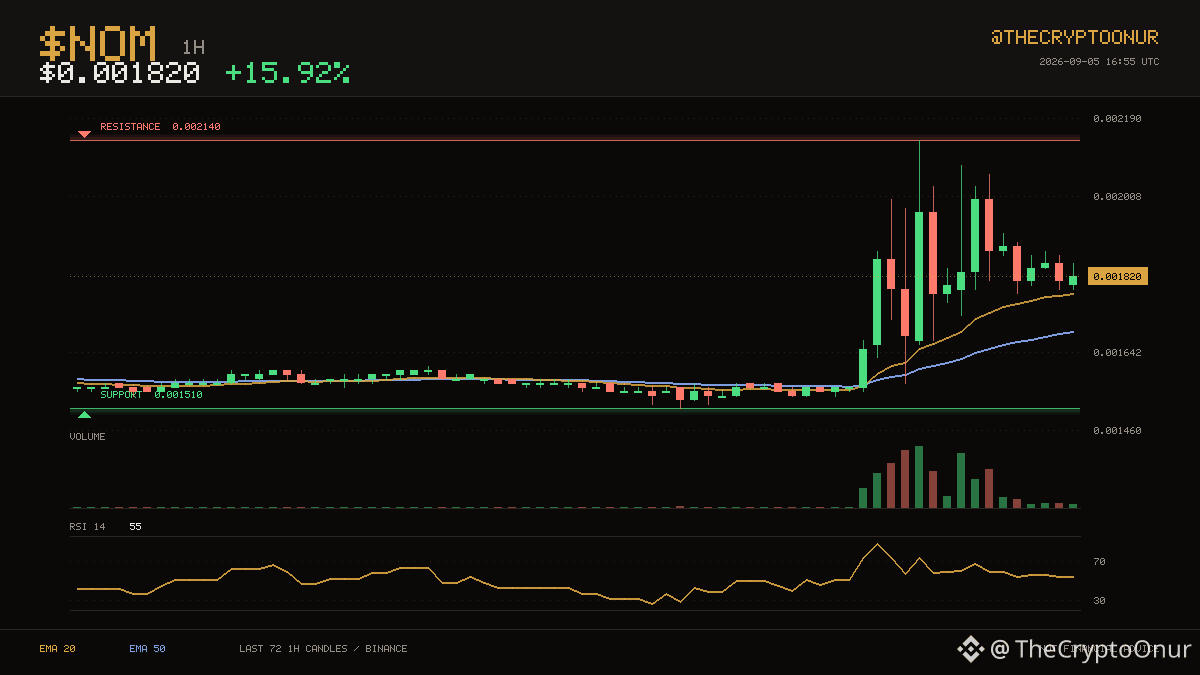
$0.001820 keeps $NOM on the stronger side of its hourly averages. $0.001510 on the low side and $0.002140 on the high side have contained the last three days. That puts price in the middle of the range. Price is a long way from both ends of this range. The 20 has stayed above the 50 for only 15 candles. RSI at 55 is neutral, so momentum is not blocking a move either way. Over the past day it has traded between $0.001540 and $0.002140, sitting around the middle of it now. The last 24 hours carried roughly 34.7x normal volume. Up 15.9% over 24 hours.
DYOR
$NOM #TechnicalAnalysis
$0.001820 keeps $NOM on the stronger side of its hourly averages. $0.001510 on the low side and $0.002140 on the high side have contained the last three days. That puts price in the middle of the range. Price is a long way from both ends of this range. The 20 has stayed above the 50 for only 15 candles. RSI at 55 is neutral, so momentum is not blocking a move either way. Over the past day it has traded between $0.001540 and $0.002140, sitting around the middle of it now. The last 24 hours carried roughly 34.7x normal volume. Up 15.9% over 24 hours.
DYOR
$NOM #TechnicalAnalysis
📈 $LINK · 1H
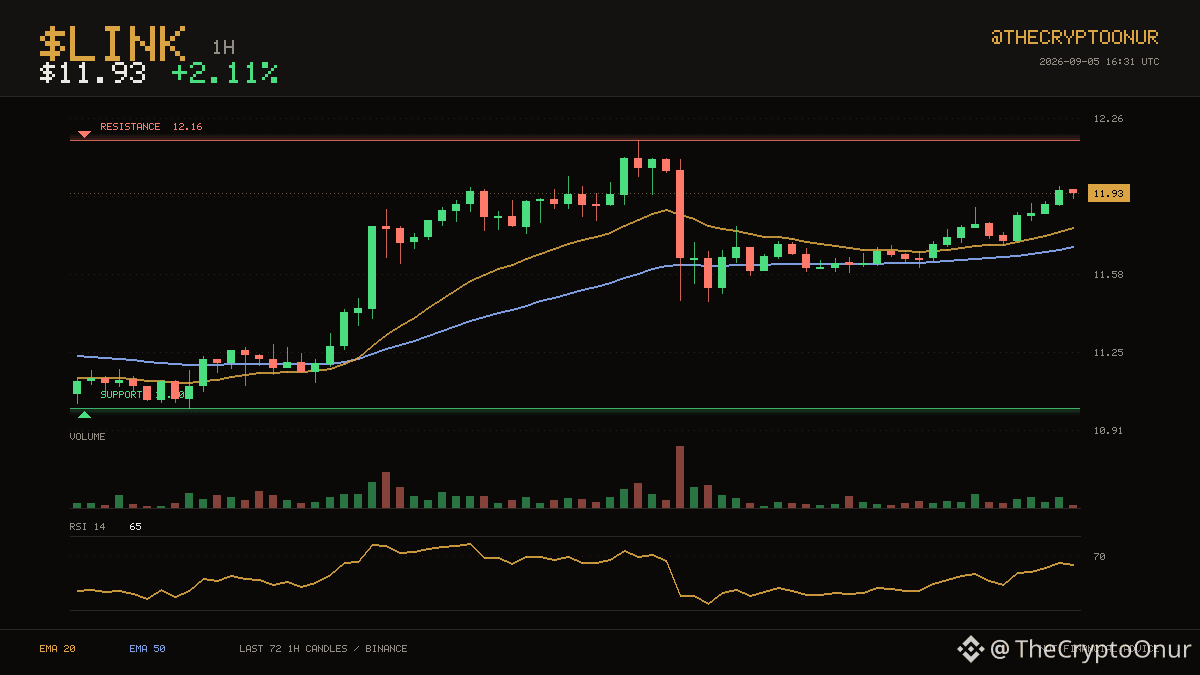
$LINK sits at $11.93, with the 20 and 50 hourly averages both below price. $12.16 has been the ceiling over the last three days and $LINK is back at it. Price is holding in the upper third of that range. That is 1.9% to the ceiling and 7.8% to the floor. The 20 has stayed above the 50 for 52 candles. RSI at 65 is neutral, so momentum is not blocking a move either way. Over the past day it has traded between $11.58 and $11.96, sitting near the top of it now. Participation is light at about 0.5x average volume. Up 2.1% over 24 hours.
DYOR
$LINK #Trading
$LINK sits at $11.93, with the 20 and 50 hourly averages both below price. $12.16 has been the ceiling over the last three days and $LINK is back at it. Price is holding in the upper third of that range. That is 1.9% to the ceiling and 7.8% to the floor. The 20 has stayed above the 50 for 52 candles. RSI at 65 is neutral, so momentum is not blocking a move either way. Over the past day it has traded between $11.58 and $11.96, sitting near the top of it now. Participation is light at about 0.5x average volume. Up 2.1% over 24 hours.
DYOR
$LINK #Trading
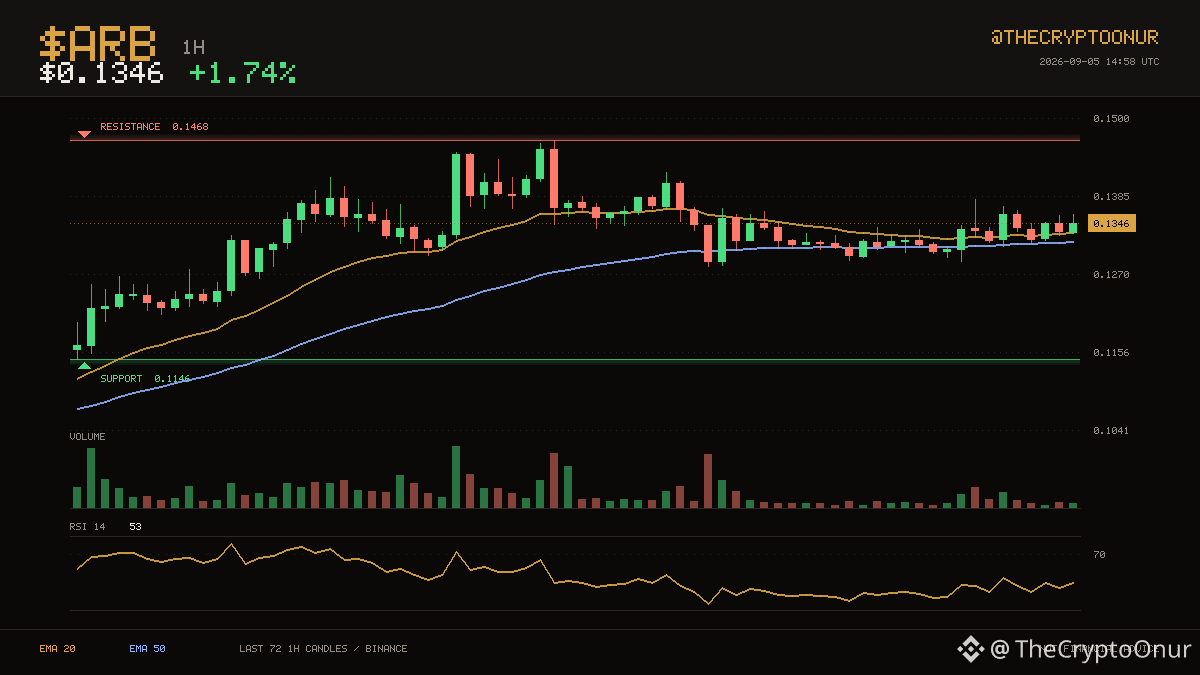
🟢 $ARB · 1H
$0.1346 keeps $ARB on the stronger side of its hourly averages. $0.1146 on the low side and $0.1468 on the high side have contained the last three days. Price is roughly mid range here. Resistance sits 9.1% above and support 14.9% below. Averages have been ordered the same way for a long stretch now, with the 20 above the 50. Momentum is mid range with RSI at 53. The 24 hour range runs $0.1289 to $0.1380, and price is around the middle of it. Volume is thin, around 0.4x the recent average, so moves here are easier to fade. Up 1.7% over 24 hours.
DYOR
$ARB #Crypto
$0.1346 keeps $ARB on the stronger side of its hourly averages. $0.1146 on the low side and $0.1468 on the high side have contained the last three days. Price is roughly mid range here. Resistance sits 9.1% above and support 14.9% below. Averages have been ordered the same way for a long stretch now, with the 20 above the 50. Momentum is mid range with RSI at 53. The 24 hour range runs $0.1289 to $0.1380, and price is around the middle of it. Volume is thin, around 0.4x the recent average, so moves here are easier to fade. Up 1.7% over 24 hours.
DYOR
$ARB #Crypto
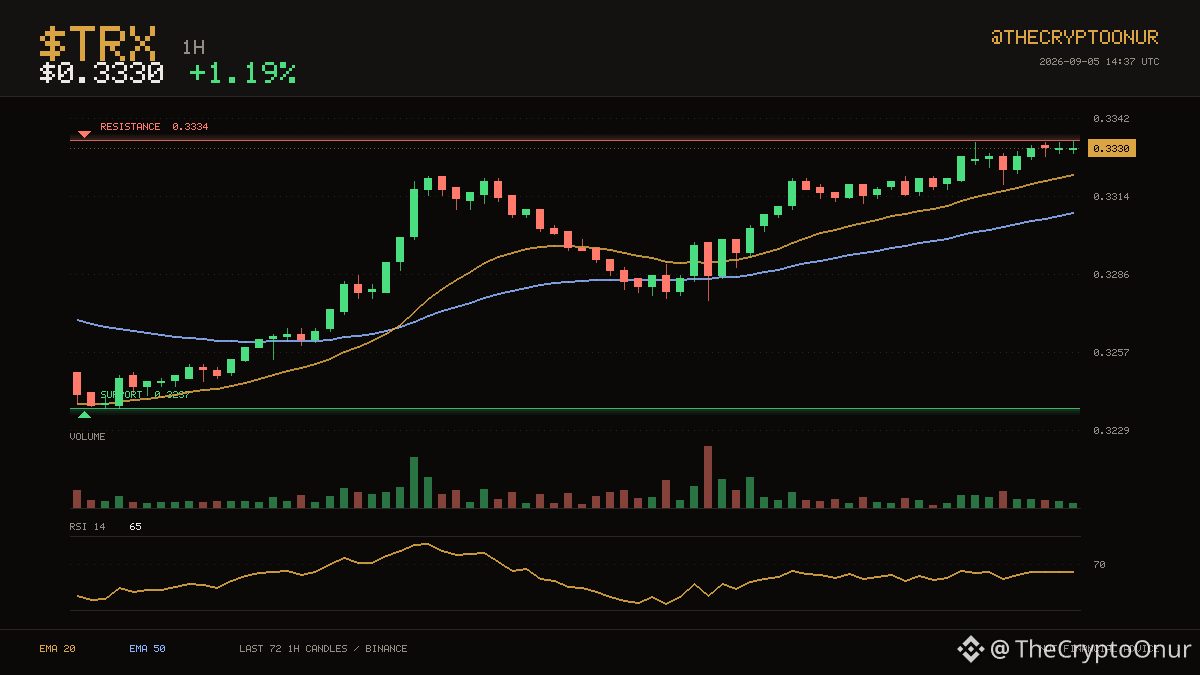
📈 $TRX · 1H
$TRX sits at $0.3330, with the 20 and 50 hourly averages both below price. $0.3334 has been the ceiling over the last three days and $TRX is back at it. Price is holding in the upper third of that range. That leaves just 0.1% to the ceiling. The 20 has stayed above the 50 for 49 candles. RSI at 64 is neutral, so momentum is not blocking a move either way. Over the past day it has traded between $0.3289 and $0.3334, sitting near the top of it now. Participation is light at about 0.6x average volume. Up 1.2% over 24 hours.
DYOR
$TRX #Trading
$TRX sits at $0.3330, with the 20 and 50 hourly averages both below price. $0.3334 has been the ceiling over the last three days and $TRX is back at it. Price is holding in the upper third of that range. That leaves just 0.1% to the ceiling. The 20 has stayed above the 50 for 49 candles. RSI at 64 is neutral, so momentum is not blocking a move either way. Over the past day it has traded between $0.3289 and $0.3334, sitting near the top of it now. Participation is light at about 0.6x average volume. Up 1.2% over 24 hours.
DYOR
$TRX #Trading
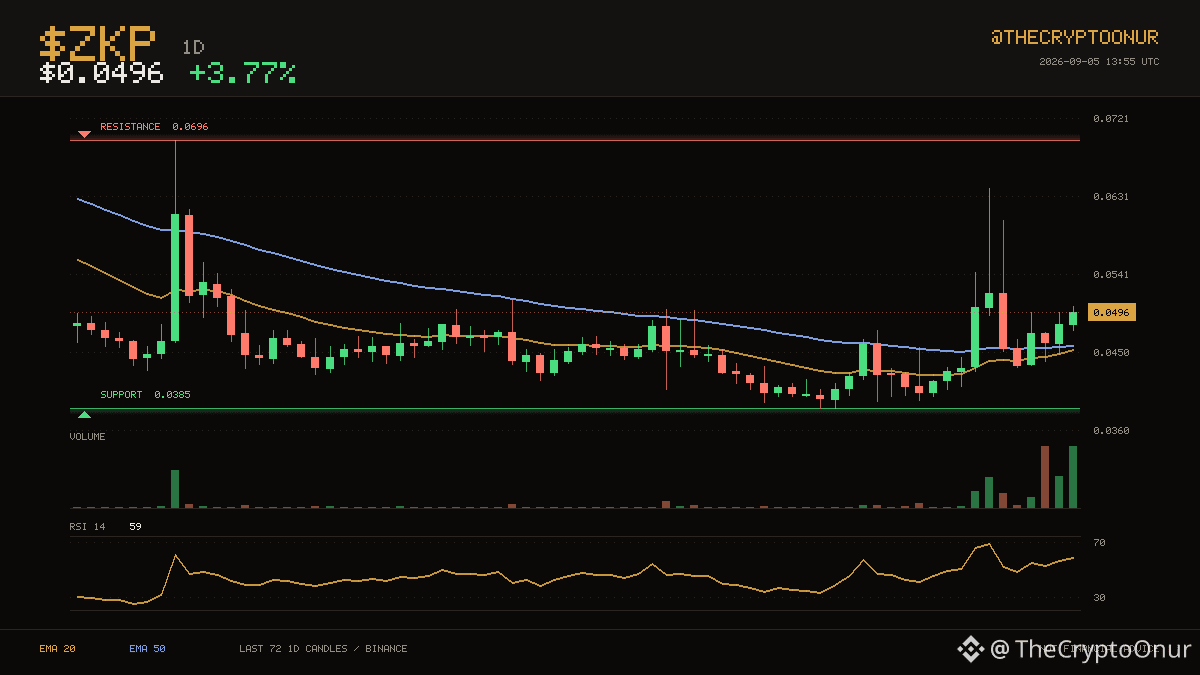
🟢 $ZKP · 1D
$0.0496 keeps $ZKP on the stronger side of its daily averages. $0.0385 on the low side and $0.0696 on the high side have contained the last two months. Price is roughly mid range here. Both edges of the range are far from here, so neither is in play yet. Averages have been ordered the same way for a long stretch now, with the 20 below the 50. Momentum is mid range with RSI at 59. The 24 hour range runs $0.0470 to $0.0504, and price is near the top of it. Volume over the past day is running about 4.4x the recent average, so there is real participation behind this. Up 3.8% over 24 hours.
DYOR
$ZKP #Crypto
$0.0496 keeps $ZKP on the stronger side of its daily averages. $0.0385 on the low side and $0.0696 on the high side have contained the last two months. Price is roughly mid range here. Both edges of the range are far from here, so neither is in play yet. Averages have been ordered the same way for a long stretch now, with the 20 below the 50. Momentum is mid range with RSI at 59. The 24 hour range runs $0.0470 to $0.0504, and price is near the top of it. Volume over the past day is running about 4.4x the recent average, so there is real participation behind this. Up 3.8% over 24 hours.
DYOR
$ZKP #Crypto
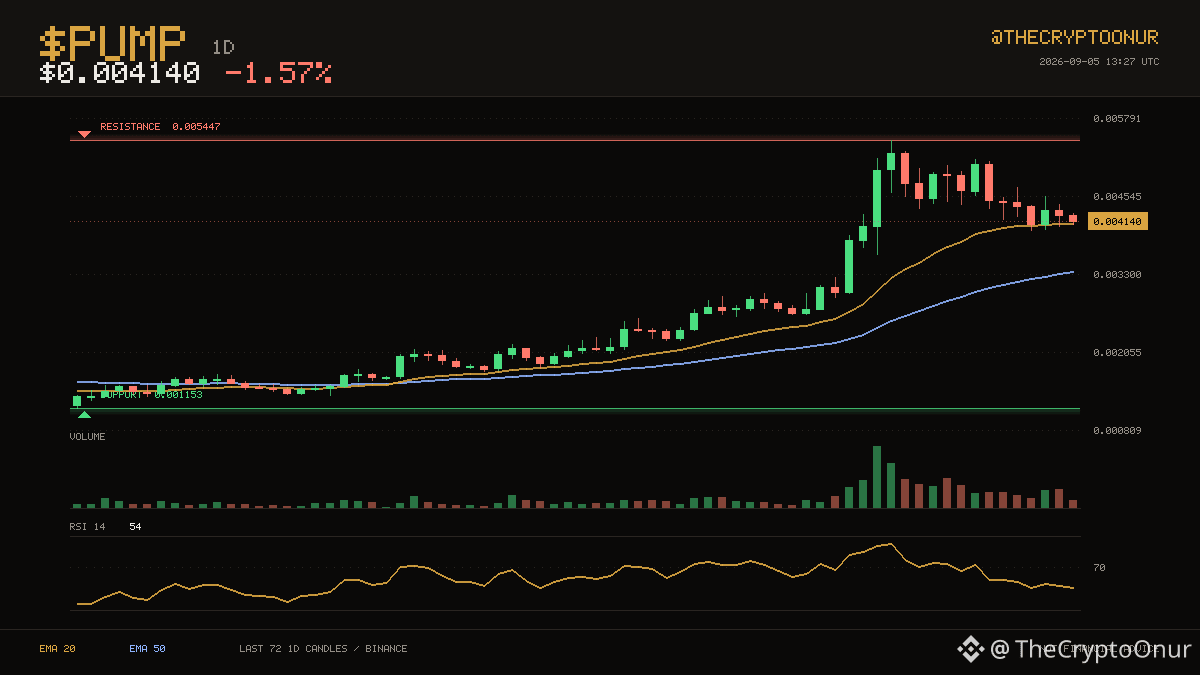
📉 $PUMP · 1D
The action has stayed between $0.001153 and $0.005447 over the last two months. $PUMP is trading at $0.004140, above both its 20 and 50 daily averages. It is trading in the top third of the range right now. Both edges of the range are far from here, so neither is in play yet. Averages have been ordered the same way for 49 candles, with the 20 above the 50. Momentum is mid range with RSI at 54. The 24 hour range runs $0.004095 to $0.004411, and price is near the bottom of it. Volume over the past day is running about 4.1x the recent average, so there is real participation behind this. Down 1.6% over 24 hours.
Binance spot data. DYOR
$PUMP #Binance
The action has stayed between $0.001153 and $0.005447 over the last two months. $PUMP is trading at $0.004140, above both its 20 and 50 daily averages. It is trading in the top third of the range right now. Both edges of the range are far from here, so neither is in play yet. Averages have been ordered the same way for 49 candles, with the 20 above the 50. Momentum is mid range with RSI at 54. The 24 hour range runs $0.004095 to $0.004411, and price is near the bottom of it. Volume over the past day is running about 4.1x the recent average, so there is real participation behind this. Down 1.6% over 24 hours.
Binance spot data. DYOR
$PUMP #Binance
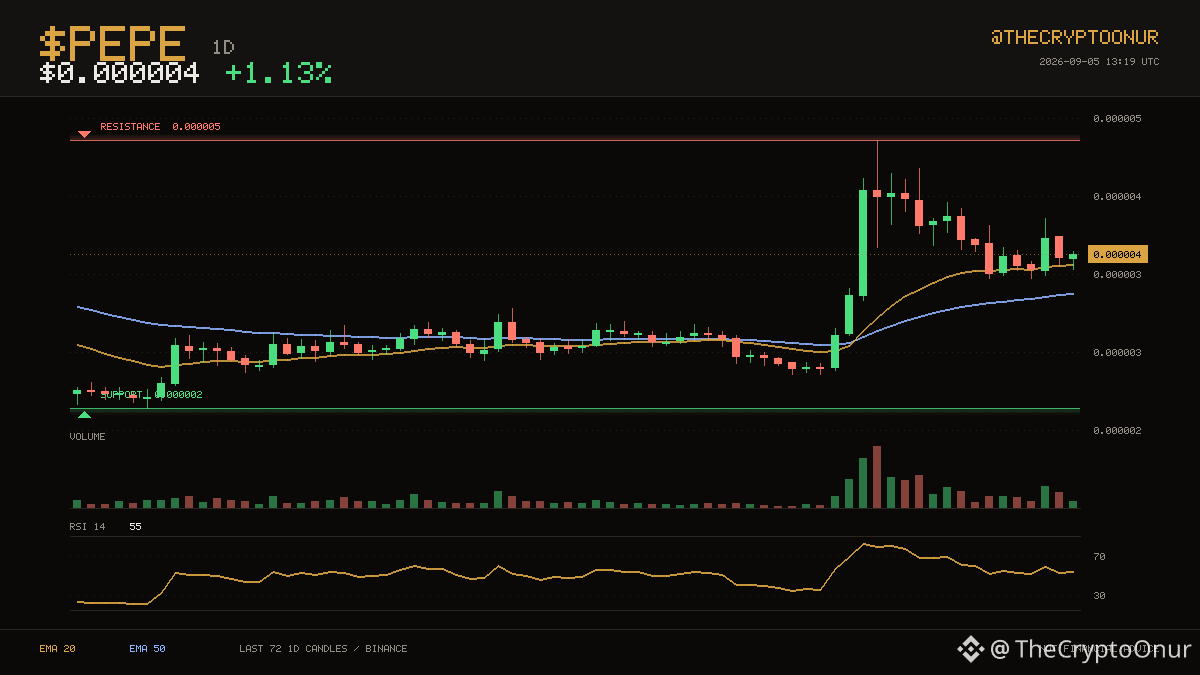
📈 $PEPE · 1D
The action has stayed between $0.000002 and $0.000005 over the last two months. $PEPE is trading at $0.000004, above both its 20 and 50 daily averages. Price is roughly mid range here. Both edges of the range are far from here, so neither is in play yet. Averages have been ordered the same way for only 16 candles, with the 20 above the 50. Momentum is mid range with RSI at 55. The 24 hour range runs $0.000003 to $0.000004, and price is near the top of it. Volume over the past day is running about 1.5x the recent average, so there is real participation behind this. Up 1.1% over 24 hours.
Binance spot data. DYOR
$PEPE #Binance
The action has stayed between $0.000002 and $0.000005 over the last two months. $PEPE is trading at $0.000004, above both its 20 and 50 daily averages. Price is roughly mid range here. Both edges of the range are far from here, so neither is in play yet. Averages have been ordered the same way for only 16 candles, with the 20 above the 50. Momentum is mid range with RSI at 55. The 24 hour range runs $0.000003 to $0.000004, and price is near the top of it. Volume over the past day is running about 1.5x the recent average, so there is real participation behind this. Up 1.1% over 24 hours.
Binance spot data. DYOR
$PEPE #Binance
I did some research on $AST and found something pretty interesting: @ast_dotfun , a meme launchpad built on top of @Aster_DEX
So far, I haven’t found any official confirmation from the AsterDEX team that @ast_dotfun is an official partner or Aster-owned project, so I’m not going to overstate that part.
But the technical connection is real:
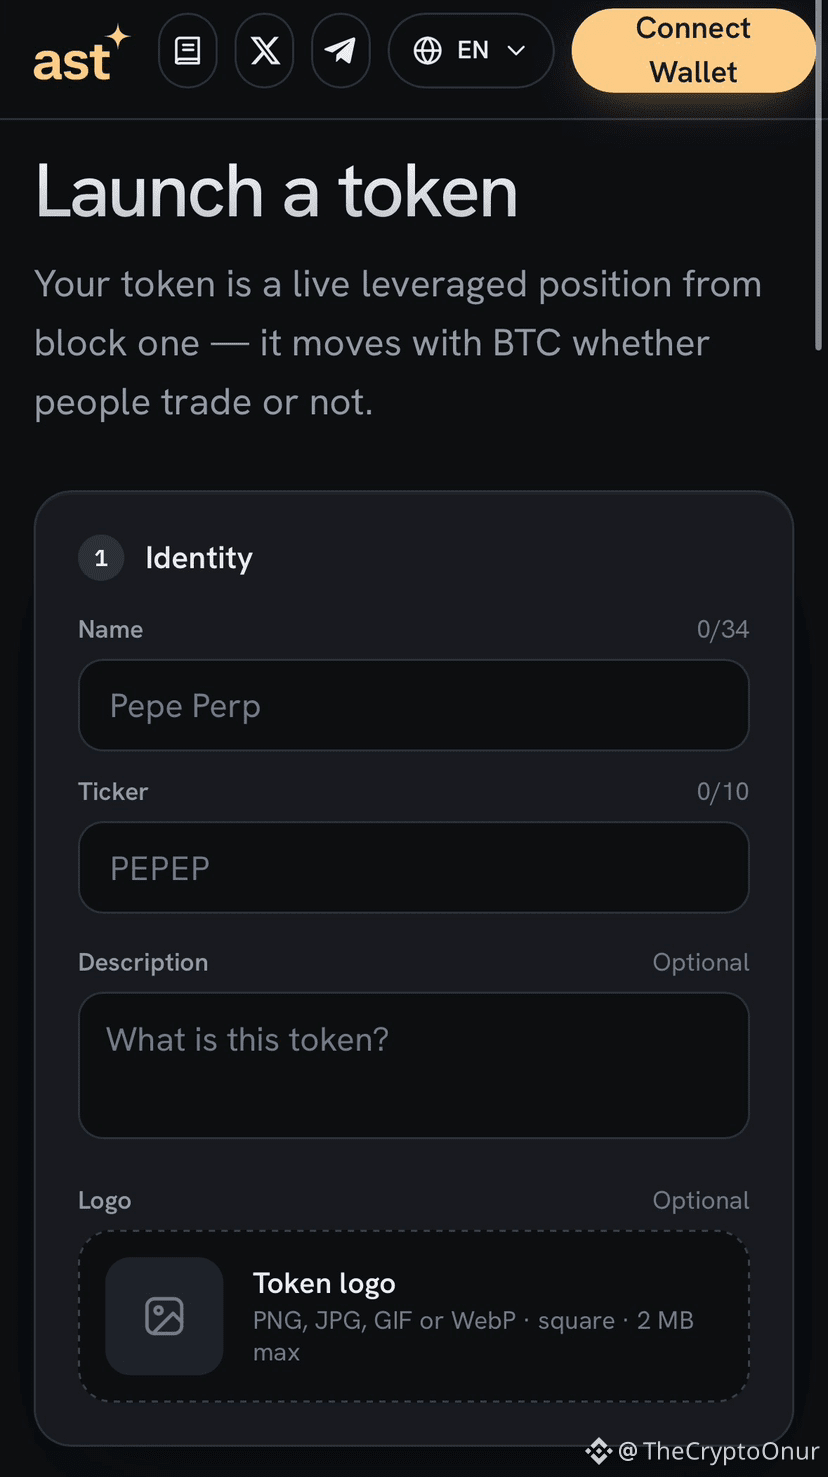
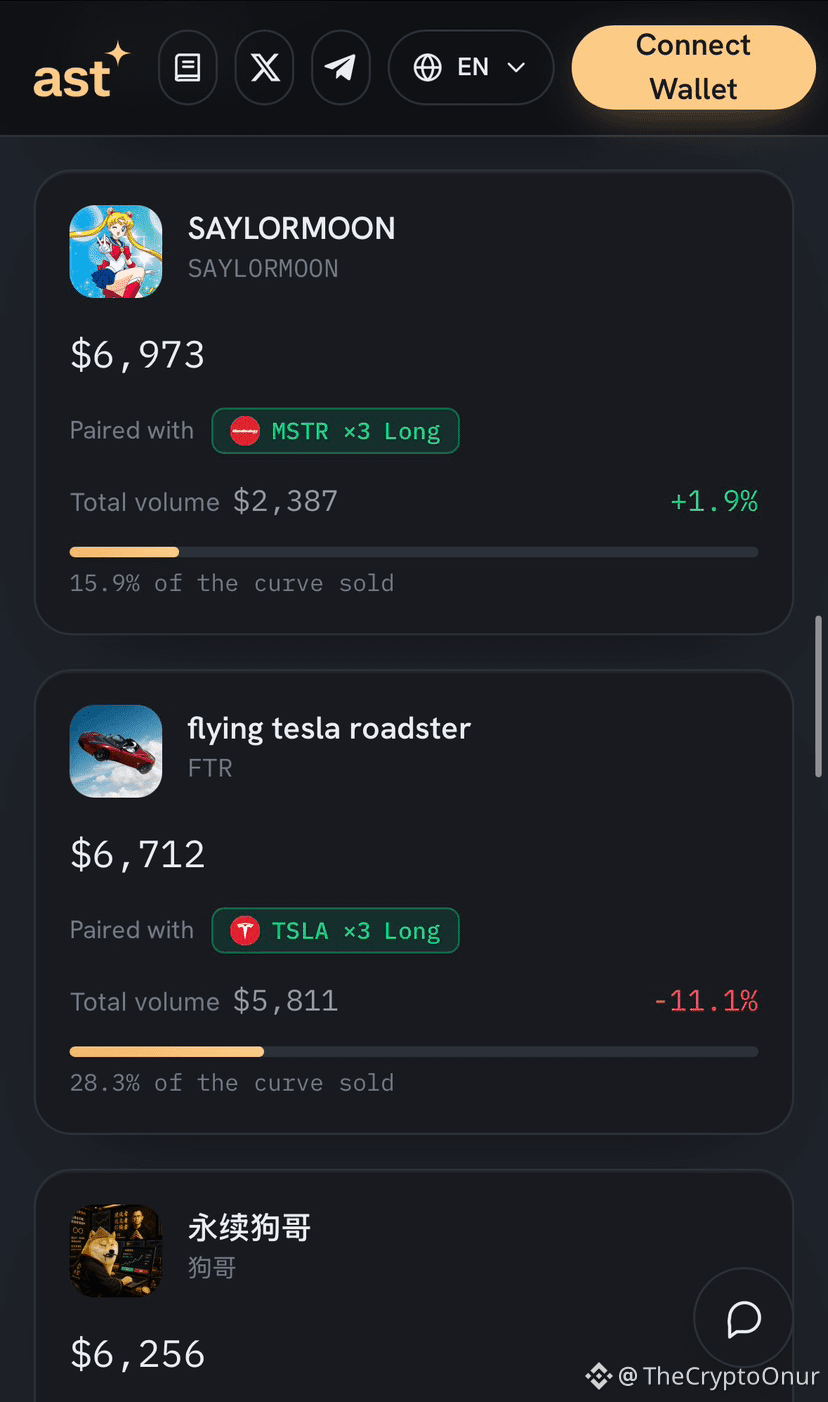
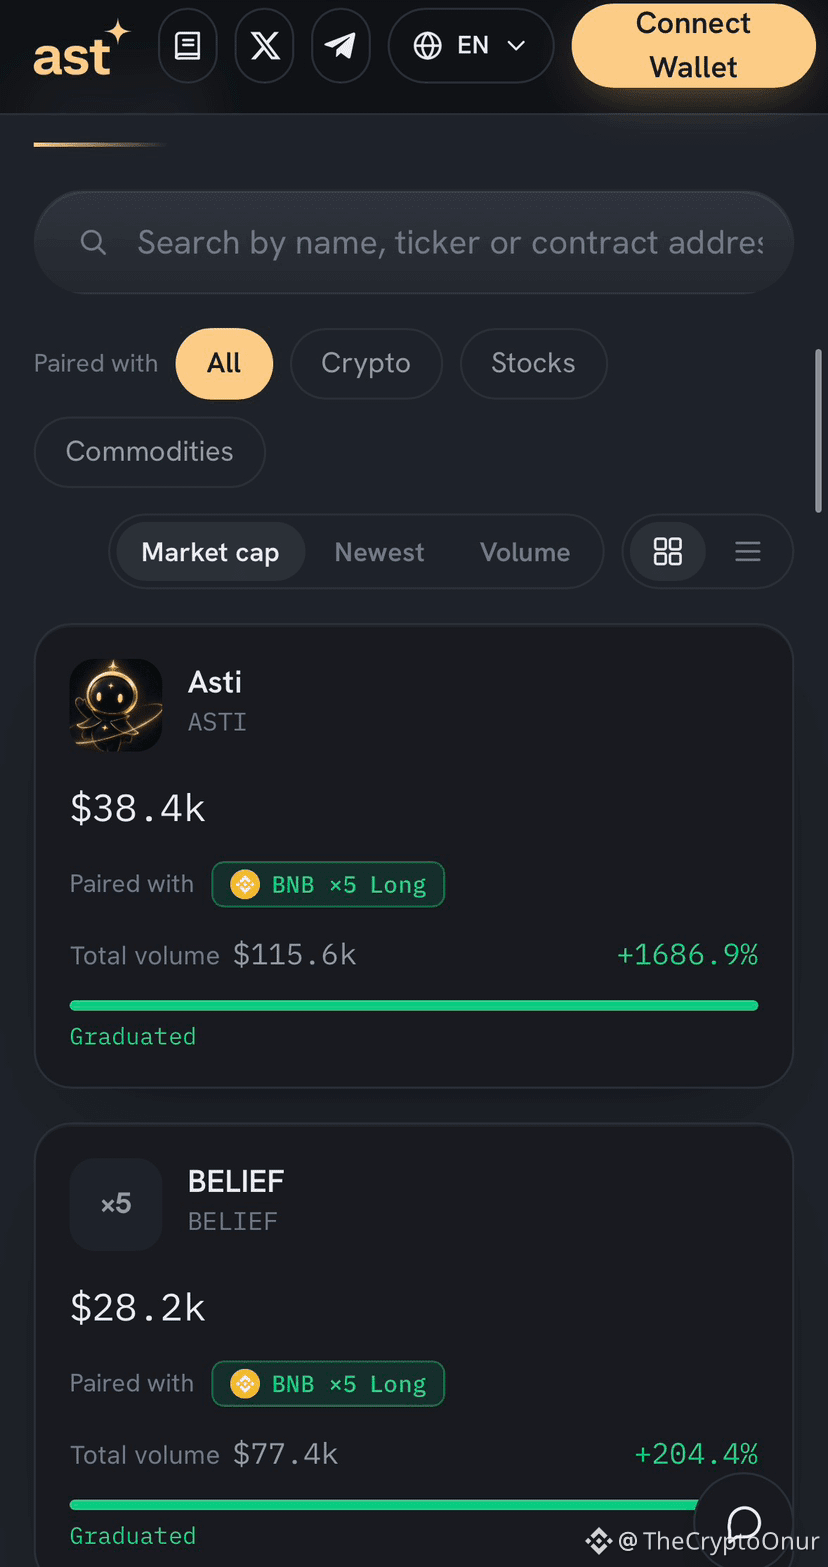
Tokens launched on ast.fun are created on BNB Chain, while their leveraged perp exposure is managed through Aster. Users can launch meme tokens tied to markets like BTC, ETH and BNB with 2x / 3x / 5x LONG or SHORT exposure.
Their native token, $AST:
🔸Launched on Four.meme
🔸Migrated to PancakeSwap after the bonding curve
🔸 1B max supply
🔸 Protocol revenue is used for AST buybacks
🔸 Bought-back AST is burned 🔥
What makes it even more interesting is that the ast fun account has directly interacted with Ryan from Aster and publicly said:
“We chose #Aster to build on.”
For now, the best way to describe it is:
An independent meme/perp launchpad built on Aster infrastructure.
Whether Aster officially acknowledges or partners with it later is something I’ll be watching closely. 👀
NFA. DYOR.
So far, I haven’t found any official confirmation from the AsterDEX team that @ast_dotfun is an official partner or Aster-owned project, so I’m not going to overstate that part.
But the technical connection is real:
Tokens launched on ast.fun are created on BNB Chain, while their leveraged perp exposure is managed through Aster. Users can launch meme tokens tied to markets like BTC, ETH and BNB with 2x / 3x / 5x LONG or SHORT exposure.
Their native token, $AST:
🔸Launched on Four.meme
🔸Migrated to PancakeSwap after the bonding curve
🔸 1B max supply
🔸 Protocol revenue is used for AST buybacks
🔸 Bought-back AST is burned 🔥
What makes it even more interesting is that the ast fun account has directly interacted with Ryan from Aster and publicly said:
“We chose #Aster to build on.”
For now, the best way to describe it is:
An independent meme/perp launchpad built on Aster infrastructure.
Whether Aster officially acknowledges or partners with it later is something I’ll be watching closely. 👀
NFA. DYOR.
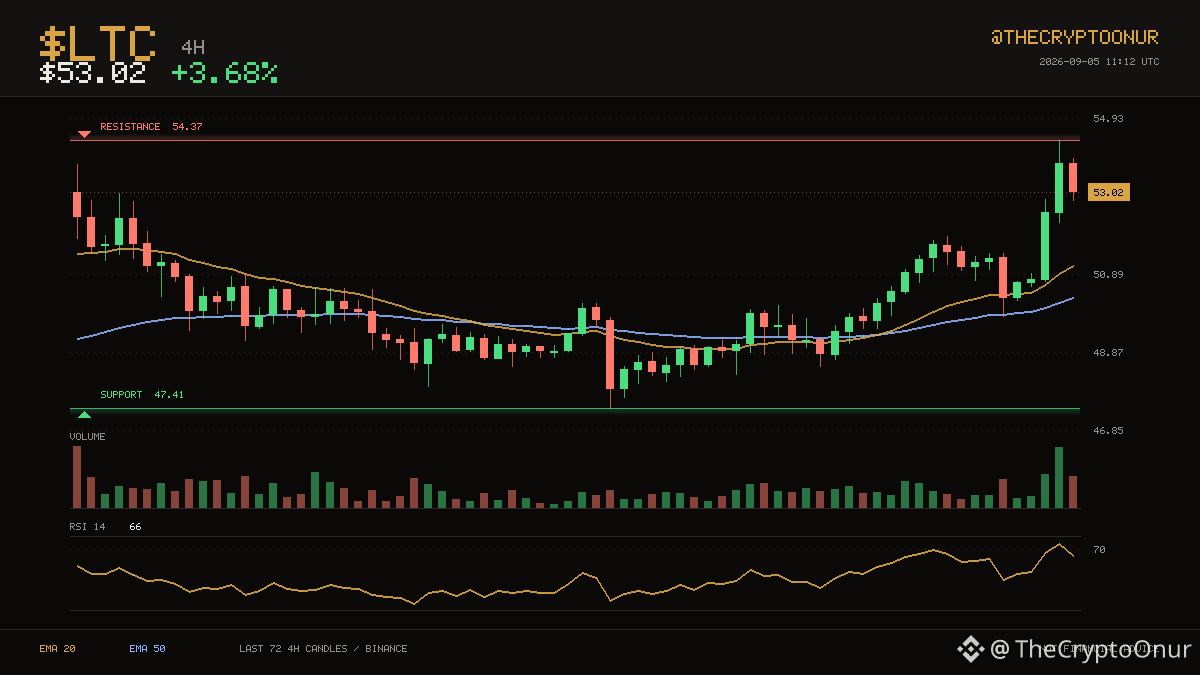
📈 $LTC · 4H
$LTC sits at $53.02, with the 20 and 50 4-hour averages both below price. $54.37 has been the ceiling over the last two weeks and $LTC is back at it. Price is holding in the upper third of that range. That is 2.5% to the ceiling and 10.6% to the floor. The 20 has stayed above the 50 for only 15 candles. RSI at 66 is neutral, so momentum is not blocking a move either way. Over the past day it has traded between $49.80 and $54.37, sitting near the top of it now. Turnover is unremarkable, running 1.2x the recent average. Up 3.7% over 24 hours.
DYOR
$LTC #Trading
$LTC sits at $53.02, with the 20 and 50 4-hour averages both below price. $54.37 has been the ceiling over the last two weeks and $LTC is back at it. Price is holding in the upper third of that range. That is 2.5% to the ceiling and 10.6% to the floor. The 20 has stayed above the 50 for only 15 candles. RSI at 66 is neutral, so momentum is not blocking a move either way. Over the past day it has traded between $49.80 and $54.37, sitting near the top of it now. Turnover is unremarkable, running 1.2x the recent average. Up 3.7% over 24 hours.
DYOR
$LTC #Trading
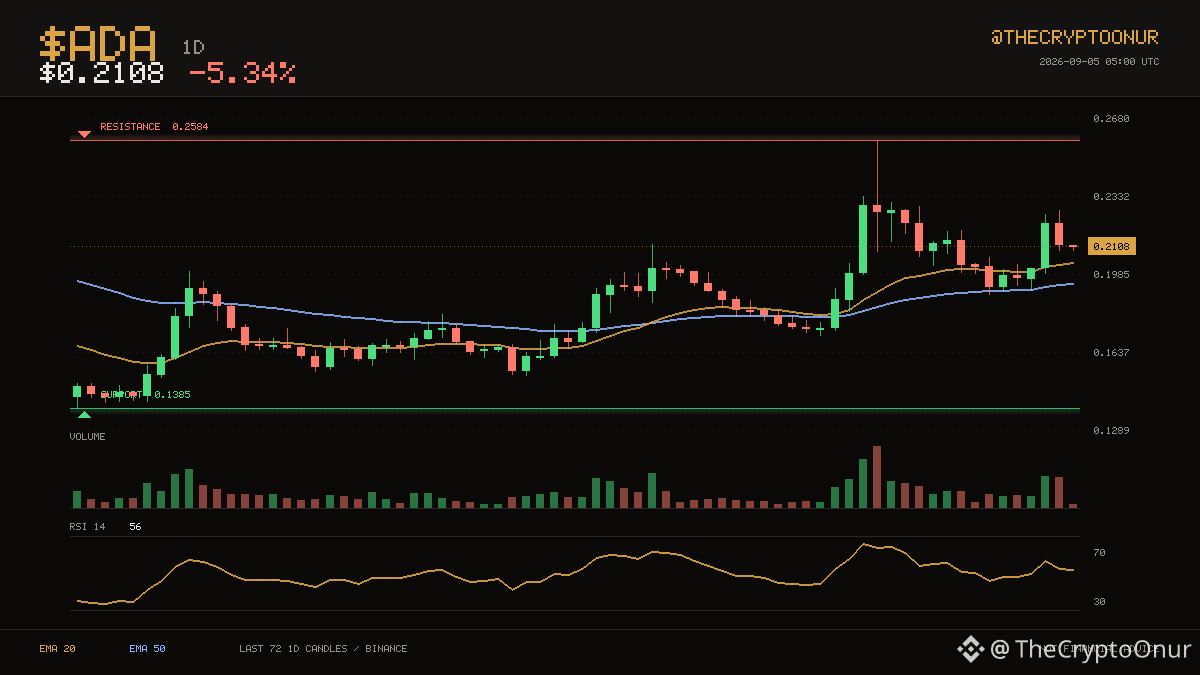
🔴 $ADA · 1D
$0.2108 keeps $ADA on the stronger side of its daily averages. $0.1385 on the low side and $0.2584 on the high side have contained the last two months. That puts price in the middle of the range. Price is a long way from both ends of this range. The 20 has stayed above the 50 for 31 candles. RSI at 56 is neutral, so momentum is not blocking a move either way. Over the past day it has traded between $0.2091 and $0.2249, sitting near the bottom of it now. Turnover is unremarkable, running 1.1x the recent average. Down 5.3% over 24 hours.
DYOR
$ADA #TechnicalAnalysis
$0.2108 keeps $ADA on the stronger side of its daily averages. $0.1385 on the low side and $0.2584 on the high side have contained the last two months. That puts price in the middle of the range. Price is a long way from both ends of this range. The 20 has stayed above the 50 for 31 candles. RSI at 56 is neutral, so momentum is not blocking a move either way. Over the past day it has traded between $0.2091 and $0.2249, sitting near the bottom of it now. Turnover is unremarkable, running 1.1x the recent average. Down 5.3% over 24 hours.
DYOR
$ADA #TechnicalAnalysis
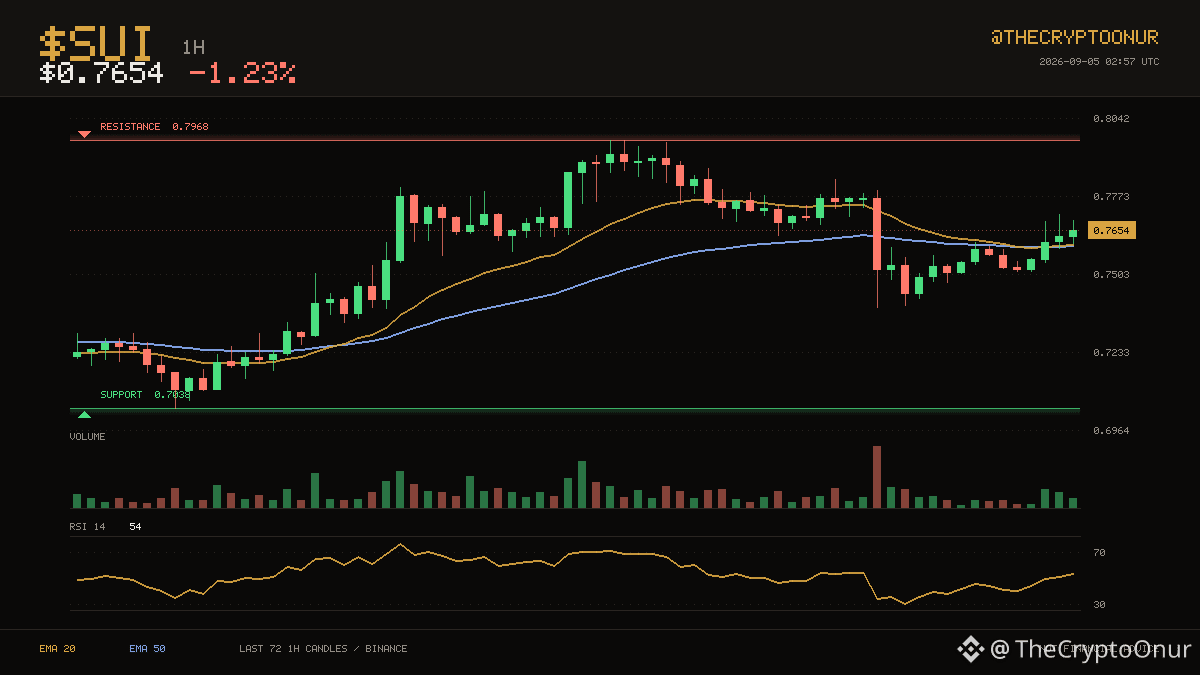
📉 $SUI · 1H
$SUI sits at $0.7654, with the 20 and 50 hourly averages both below price. The three day range runs from $0.7038 up to $0.7968. Price is holding in the upper third of that range. That is 4.1% to the ceiling and 8.0% to the floor. The 20 crossed above the 50 recently, for only 2 candles, so this leg is still young. RSI at 54 is neutral, so momentum is not blocking a move either way. Over the past day it has traded between $0.7390 and $0.7830, sitting around the middle of it now. Turnover is unremarkable, running 0.9x the recent average. Down 1.2% over 24 hours.
DYOR
$SUI #Trading
$SUI sits at $0.7654, with the 20 and 50 hourly averages both below price. The three day range runs from $0.7038 up to $0.7968. Price is holding in the upper third of that range. That is 4.1% to the ceiling and 8.0% to the floor. The 20 crossed above the 50 recently, for only 2 candles, so this leg is still young. RSI at 54 is neutral, so momentum is not blocking a move either way. Over the past day it has traded between $0.7390 and $0.7830, sitting around the middle of it now. Turnover is unremarkable, running 0.9x the recent average. Down 1.2% over 24 hours.
DYOR
$SUI #Trading
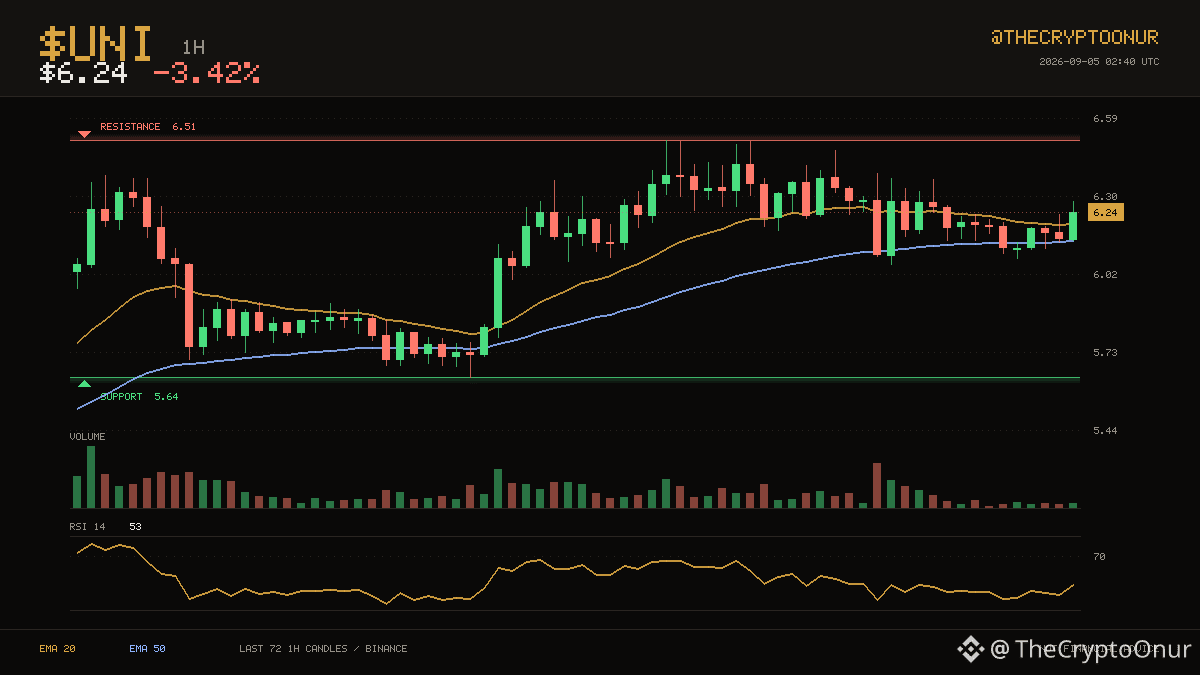
📉 $UNI · 1H
The action has stayed between $5.64 and $6.51 over the last three days. $UNI is trading at $6.24, above both its 20 and 50 hourly averages. It is trading in the top third of the range right now. Resistance sits 4.3% above and support 9.7% below. Averages have been ordered the same way for a long stretch now, with the 20 above the 50. Momentum is mid range with RSI at 53. The 24 hour range runs $6.05 to $6.51, and price is around the middle of it. Volume is close to normal at 0.8x the recent average. Down 3.4% over 24 hours.
Binance spot data. DYOR
$UNI #Binance
The action has stayed between $5.64 and $6.51 over the last three days. $UNI is trading at $6.24, above both its 20 and 50 hourly averages. It is trading in the top third of the range right now. Resistance sits 4.3% above and support 9.7% below. Averages have been ordered the same way for a long stretch now, with the 20 above the 50. Momentum is mid range with RSI at 53. The 24 hour range runs $6.05 to $6.51, and price is around the middle of it. Volume is close to normal at 0.8x the recent average. Down 3.4% over 24 hours.
Binance spot data. DYOR
$UNI #Binance
📉 $UNI · 1H
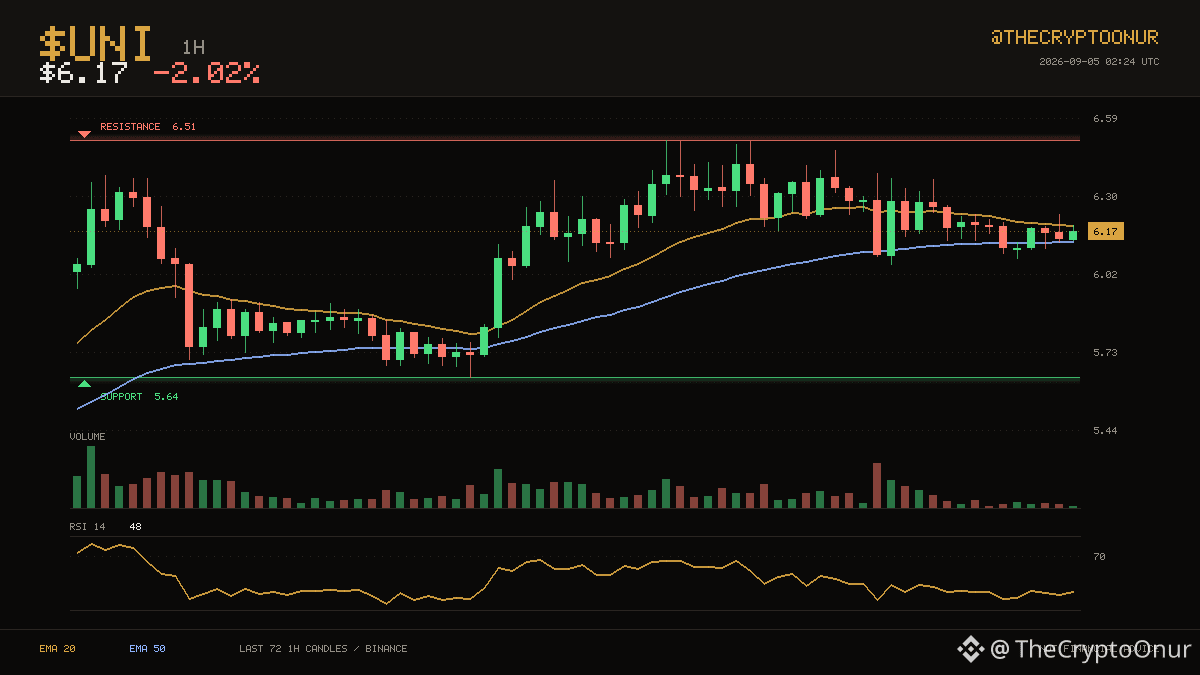
$UNI is at $6.17, with one average above price and one below. The three day range runs from $5.64 up to $6.51. RSI at 48 is neutral, so momentum is not blocking a move either way. That is 5.5% to the ceiling and 8.7% to the floor. Down 2.0% over 24 hours.
🔴 $ENA · 1H
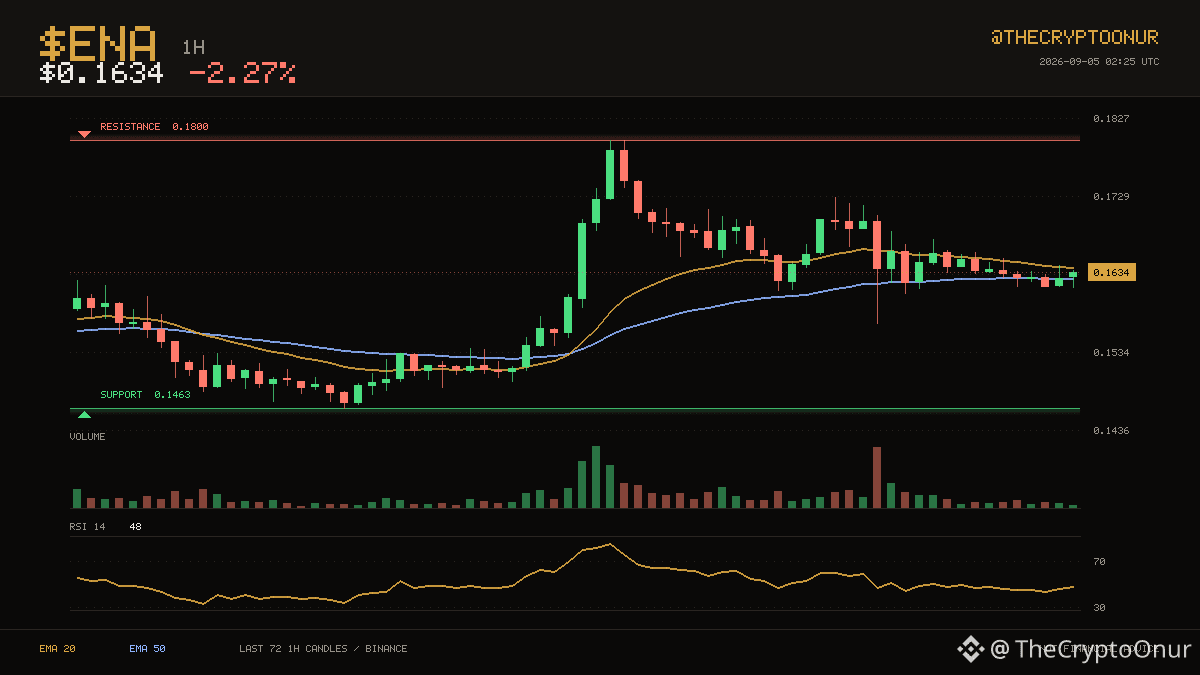
$ENA is caught between its averages at $0.1634. The action has stayed between $0.1463 and $0.1800 over the last three days. Momentum is mid range with RSI at 48. Resistance sits 10.2% above and support 10.5% below. Down 2.3% over 24 hours.
DYOR
$UNI $ENA #Trading
$UNI is at $6.17, with one average above price and one below. The three day range runs from $5.64 up to $6.51. RSI at 48 is neutral, so momentum is not blocking a move either way. That is 5.5% to the ceiling and 8.7% to the floor. Down 2.0% over 24 hours.
🔴 $ENA · 1H
$ENA is caught between its averages at $0.1634. The action has stayed between $0.1463 and $0.1800 over the last three days. Momentum is mid range with RSI at 48. Resistance sits 10.2% above and support 10.5% below. Down 2.3% over 24 hours.
DYOR
$UNI $ENA #Trading
🟢 $NEAR · 4H
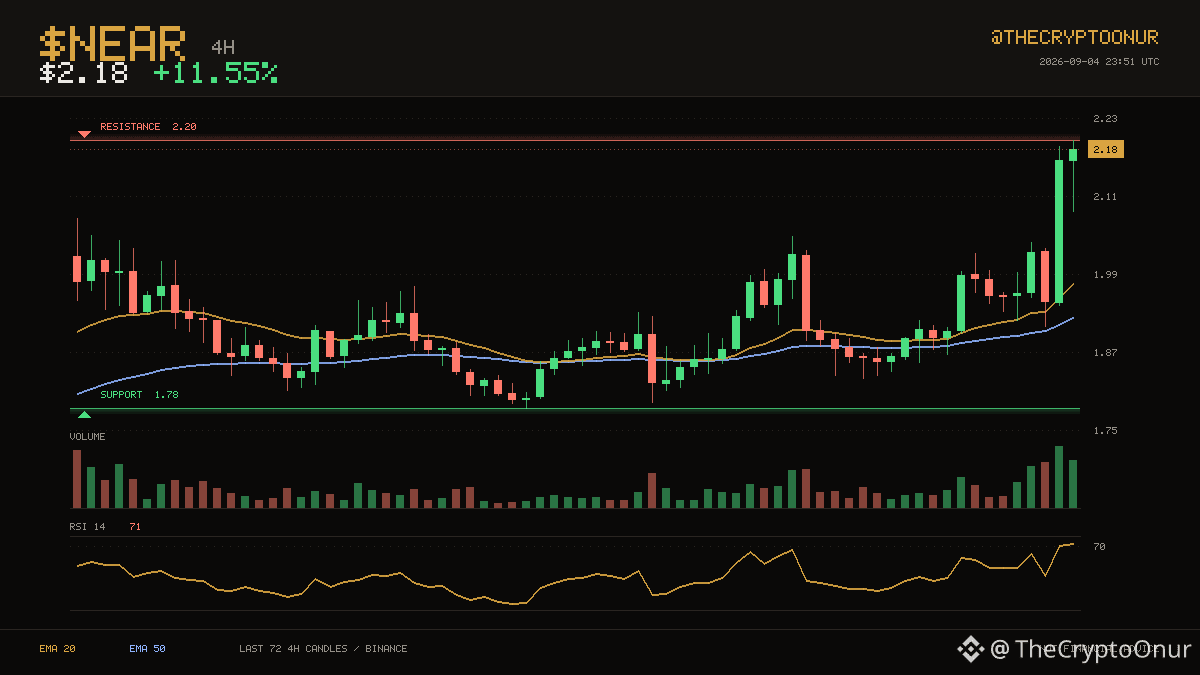
$2.18 keeps $NEAR on the stronger side of its 4-hour averages. The last two weeks topped out near $2.20, and price is pressing that area again. It is trading in the top third of the range right now. Resistance is the near one at 0.6% above; support is far below and not in play. Averages have been ordered the same way for a long stretch now, with the 20 above the 50. At 71 on RSI the move is getting hot. The 24 hour range runs $1.91 to $2.20, and price is near the top of it. Volume is close to normal at 1.5x the recent average. Up 11.5% over 24 hours.
⚠️ DYOR
$NEAR #Crypto
$2.18 keeps $NEAR on the stronger side of its 4-hour averages. The last two weeks topped out near $2.20, and price is pressing that area again. It is trading in the top third of the range right now. Resistance is the near one at 0.6% above; support is far below and not in play. Averages have been ordered the same way for a long stretch now, with the 20 above the 50. At 71 on RSI the move is getting hot. The 24 hour range runs $1.91 to $2.20, and price is near the top of it. Volume is close to normal at 1.5x the recent average. Up 11.5% over 24 hours.
⚠️ DYOR
$NEAR #Crypto
🔴 $DOGE · 4H
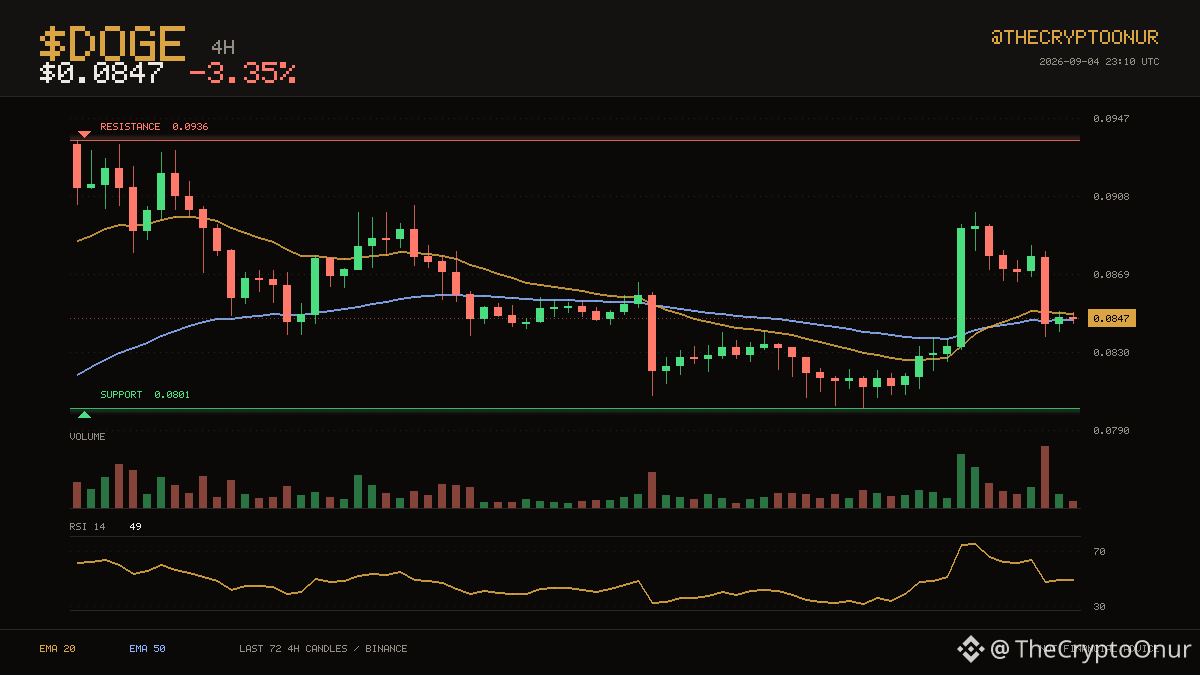
At $0.0847, $DOGE is sitting right in the middle of its 4-hour averages. $0.0801 on the low side and $0.0936 on the high side have contained the last two weeks. Price is roughly mid range here. Resistance sits 10.6% above and support 5.3% below. This shift is fresh: the 20 has been above the 50 for only 7 candles. Momentum is mid range with RSI at 49. The 24 hour range runs $0.0838 to $0.0884, and price is near the bottom of it. Volume is close to normal at 1.1x the recent average. Those averages sit at $0.0849 and $0.0846 respectively. Down 3.3% over 24 hours.
DYOR
$DOGE #Crypto
At $0.0847, $DOGE is sitting right in the middle of its 4-hour averages. $0.0801 on the low side and $0.0936 on the high side have contained the last two weeks. Price is roughly mid range here. Resistance sits 10.6% above and support 5.3% below. This shift is fresh: the 20 has been above the 50 for only 7 candles. Momentum is mid range with RSI at 49. The 24 hour range runs $0.0838 to $0.0884, and price is near the bottom of it. Volume is close to normal at 1.1x the recent average. Those averages sit at $0.0849 and $0.0846 respectively. Down 3.3% over 24 hours.
DYOR
$DOGE #Crypto
📉 $BNB · 1H
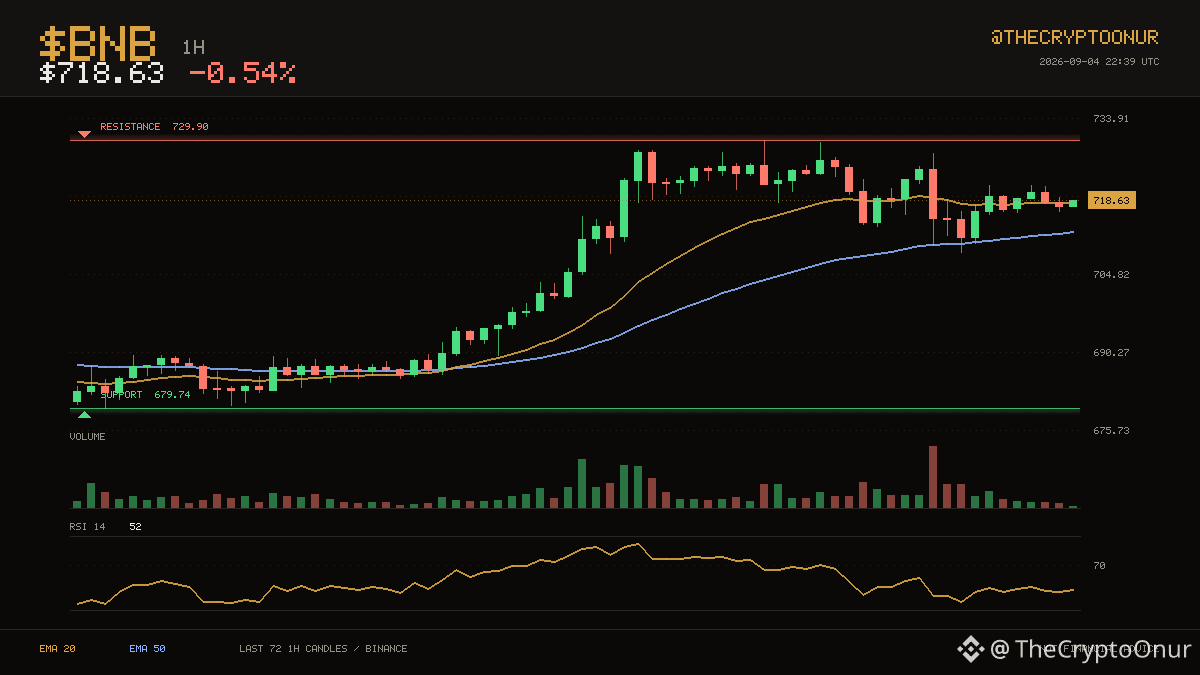
The action has stayed between $679.74 and $729.90 over the last three days. $BNB is trading at $718.63, above both its 20 and 50 hourly averages. It is trading in the top third of the range right now. Resistance sits 1.6% above and support 5.4% below. Averages have been ordered the same way for 45 candles, with the 20 above the 50. Momentum is mid range with RSI at 52. The 24 hour range runs $708.88 to $729.90, and price is around the middle of it. Volume is close to normal at 1.4x the recent average. Down 0.5% over 24 hours.
Binance spot data. DYOR
$BNB #Binance
The action has stayed between $679.74 and $729.90 over the last three days. $BNB is trading at $718.63, above both its 20 and 50 hourly averages. It is trading in the top third of the range right now. Resistance sits 1.6% above and support 5.4% below. Averages have been ordered the same way for 45 candles, with the 20 above the 50. Momentum is mid range with RSI at 52. The 24 hour range runs $708.88 to $729.90, and price is around the middle of it. Volume is close to normal at 1.4x the recent average. Down 0.5% over 24 hours.
Binance spot data. DYOR
$BNB #Binance
🔴 $ENSO · 1D
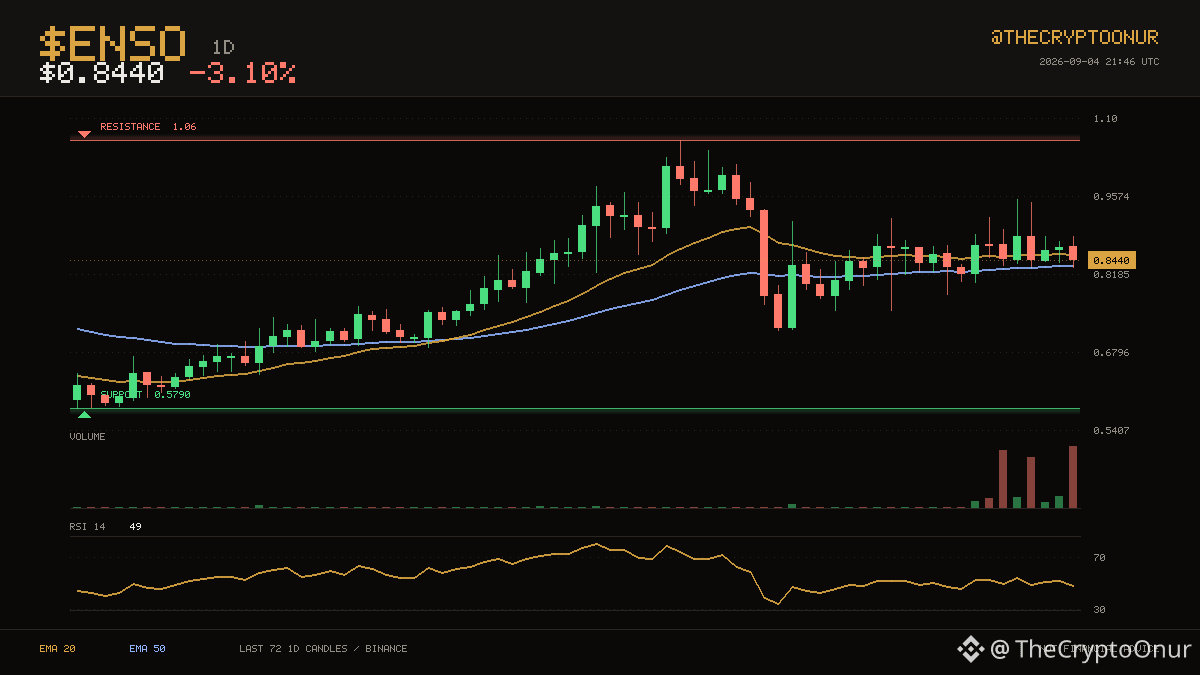
At $0.8440, $ENSO is sitting right in the middle of its daily averages. $0.5790 on the low side and $1.06 on the high side have contained the last two months. Price is roughly mid range here. Both edges of the range are far from here, so neither is in play yet. Averages have been ordered the same way for 45 candles, with the 20 above the 50. Momentum is mid range with RSI at 49. The 24 hour range runs $0.8310 to $0.8860, and price is near the bottom of it. Volume over the past day is running about 8.5x the recent average, so there is real participation behind this. Down 3.1% over 24 hours.
DYOR
$ENSO #Crypto
At $0.8440, $ENSO is sitting right in the middle of its daily averages. $0.5790 on the low side and $1.06 on the high side have contained the last two months. Price is roughly mid range here. Both edges of the range are far from here, so neither is in play yet. Averages have been ordered the same way for 45 candles, with the 20 above the 50. Momentum is mid range with RSI at 49. The 24 hour range runs $0.8310 to $0.8860, and price is near the bottom of it. Volume over the past day is running about 8.5x the recent average, so there is real participation behind this. Down 3.1% over 24 hours.
DYOR
$ENSO #Crypto
🟢 $DASH · 1D
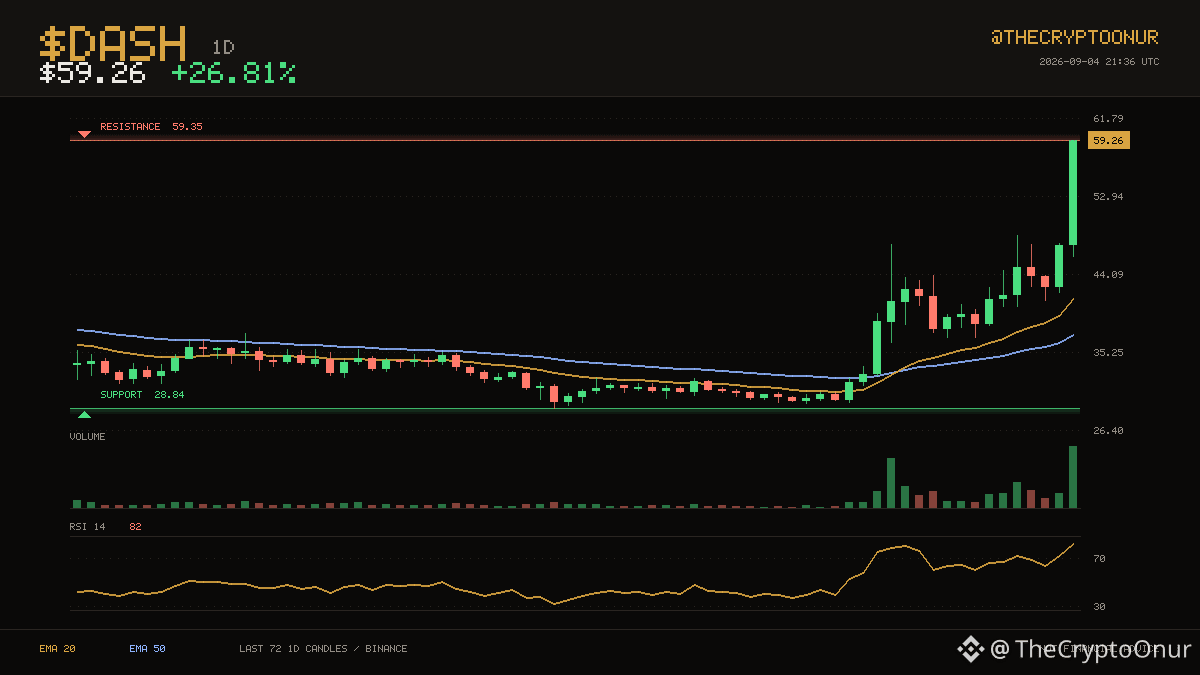
$59.26 keeps $DASH on the stronger side of its daily averages. $59.35 has been the ceiling over the last two months and $DASH is back at it. Price is holding in the upper third of that range. The ceiling is 0.2% away while the floor sits well below current levels. The 20 has stayed above the 50 for only 13 candles. RSI is up at 82, which is stretched enough that pullbacks would not be a surprise. Over the past day it has traded between $45.87 and $59.35, sitting near the top of it now. Turnover is unremarkable, running 1.3x the recent average. Up 26.8% over 24 hours.
⚠️ DYOR
$DASH #TechnicalAnalysis
$59.26 keeps $DASH on the stronger side of its daily averages. $59.35 has been the ceiling over the last two months and $DASH is back at it. Price is holding in the upper third of that range. The ceiling is 0.2% away while the floor sits well below current levels. The 20 has stayed above the 50 for only 13 candles. RSI is up at 82, which is stretched enough that pullbacks would not be a surprise. Over the past day it has traded between $45.87 and $59.35, sitting near the top of it now. Turnover is unremarkable, running 1.3x the recent average. Up 26.8% over 24 hours.
⚠️ DYOR
$DASH #TechnicalAnalysis
Log in to explore more content