Bitcoin shows a structure broke to the downside on both the 4-hour and 1-hour timeframes. The last close was 77695.9, with a significant bearish fair value gap between 77861.8 and 77867.5. The 1-day timeframe is more bullish with an RSI of 57.12, suggesting potential strength, but a break above 78740 would shift the outlook. Ethereum also reflects a structure broke to the downside across the 4-hour and 1-hour timeframes. The last close was 2455.92, with the 1-day RSI at 59.77 indicating some bullish momentum. However, the 4-hour indicators are bearish, and a reclaim above 2470.83 is needed to change the current read. Not financial advice. $BTC $ETH #BTC #ETH #trading #marketanalysis #cryptocurrency
BTC is currently at 78081.4. The 4-hour RSI is at 40.11, indicating bearish momentum, while the daily RSI is higher at 58.70, suggesting some underlying strength. The 1-hour structure has broken to the downside. A close above 78821.73 would change the current bearish outlook. ETH is trading at 2471.44. The 4-hour RSI is at 46.92, reflecting neutral momentum, and the daily RSI is at 61.31, showing bullish potential. Both 4-hour and 1-hour structures have broken to the downside. A close above 2482.07 would alter the current bearish read. Not financial advice. $BTC $ETH #BTC #ETH #trading #marketanalysis #cryptocurrency
Bitcoin is currently showing a structure that has broken to the downside on both the 4-hour and 1-hour timeframes. The last close was 78349.0, with the 4-hour RSI at 43.01 and the 1-hour RSI at 46.76. The daily timeframe presents a mixed picture with an RSI of 59.73, indicating some bullish momentum. The level to watch for a change in this bearish read is 79560.0, which would signal a potential shift in structure. Ethereum is also experiencing a downside break in structure across the 4-hour and 1-hour charts. The last close is 2476.08, with the 4-hour RSI at 48.42 and the 1-hour RSI at 48.25. The daily timeframe shows a more favorable RSI of 61.63, suggesting some bullish strength. However, the conflicting signals between the 1-hour and daily timeframes indicate uncertainty. A key level to monitor for a potential reversal is 2509.49. Not financial advice. $BTC $ETH #BTC #ETH #trading #marketanalysis #cryptocurrency
BTC is showing a structure broke to the downside on the 4-hour timeframe, with the last close at 78469.3. The 1-day RSI is at 60.26, indicating some bullish momentum, but the 4-hour RSI is much lower at 43.38. A level to watch for a change in this read is 78759.5, where a fair value gap exists. The mixed signals between the 1-day and 4-hour timeframes suggest caution. ETH is also in a structure broke to the downside on the 4-hour timeframe, closing at 2486.25. The daily RSI is higher at 62.96, indicating some strength, while the 1-hour RSI sits at 46.48. The 4-hour and 1-hour timeframes are not aligned, with the 1-hour indicating a potential loss of momentum. A key level to monitor is 2491.35, which is the 1-hour EMA 50. This mixed outlook requires careful consideration of entry points. Not financial advice. $BTC $ETH #BTC #ETH #MarketAnalysis
BTC is currently showing a structure that broke to the downside on the 4-hour chart. The last close was 79396.6, with the 1-hour structure indicating a break of structure to the upside. The 1-hour close was 79377.2. A close above 79878.4 would change the bearish read from the 4-hour timeframe. ETH also shows a structure that broke to the downside on the 4-hour chart with a last close of 2501.99. The 1-hour structure indicates a break of structure to the upside, with the last close at 2502.0. A close above 2513.47 would alter the current bearish outlook from the 4-hour timeframe. Not financial advice. $BTC $ETH #BTC #ETH #trading
The trade was justified by the 4-hour chart showing price hugging a rising EMA50 inside its recent range, indicating potential upward movement toward the prior swing high. Entry time was 2026-09-09 08:32:32. The pair is SOL/USDT with a long position at 104.88. The stop is set at 101.2092 and the target at 114.057. However, the analysis reveals a contradiction; the 1-hour chart shows a sweep high with a close near the swing high, indicating chase risk. Not financial advice.
BTC is currently showing a structure that has broken to the downside on the 4-hour chart. The last close is at 78730.7, with the nearest fair value gap between 78543.5 and 78592.7. The daily timeframe is more bullish with an RSI of 60.95, but the 1-hour chart reflects mixed signals with an RSI of 51.49. A break above 79016.5 would change the current bearish read. ETH is facing a structure that has broken to the downside on the 4-hour chart, with the last close at 2494.42. The daily timeframe indicates bullish momentum with an RSI of 63.48, while the 1-hour shows a conflicting bullish structure. The 1-hour RSI is at 54.44. A break above 2508.57 would shift the bearish outlook from the 4-hour chart. Not financial advice. $BTC $ETH #BTC #ETH #trading #marketanalysis #cryptocurrency
BTC is showing mixed signals across timeframes. The 4-hour structure is broken to the downside with a last close of 78689.2, while the daily timeframe shows a relative strength index at 61.16, indicating potential strength. The key level to watch is 79517.5, which would change the bearish outlook on the 4-hour chart. ETH has a more bullish structure on the 4-hour chart, indicating a break of structure to the upside with a last close of 2492.97. However, the 1-hour timeframe shows a break to the downside, which creates a conflicting view. The significant level to monitor is 2486.06, as holding above this could support the bullish sentiment while any drop below could shift the perspective. Not financial advice. $BTC $ETH #BTC #ETH #trading #marketanalysis #cryptocurrency
Bitcoin is currently showing mixed signals across timeframes. The 4-hour structure indicates a downward shift, with the last close at 78823.1 and a bearish fair value gap between 79517.5 and 79533.4. The daily timeframe is more bullish, with an RSI of 61.74 and a last close of 78835.5. A break above 79533.4 would shift the current bearish outlook. Ethereum presents a more bullish stance on the 4-hour chart with a structure that broke to the upside, closing at 2482.24. The daily indicators also support this, with an RSI of 62.64. However, the 1-hour timeframe shows a bearish fair value gap between 2487.37 and 2492.11. A close below 2482.24 could change the current bullish read. Not financial advice. $BTC $ETH #BTC #ETH #trading #marketanalysis #crypto
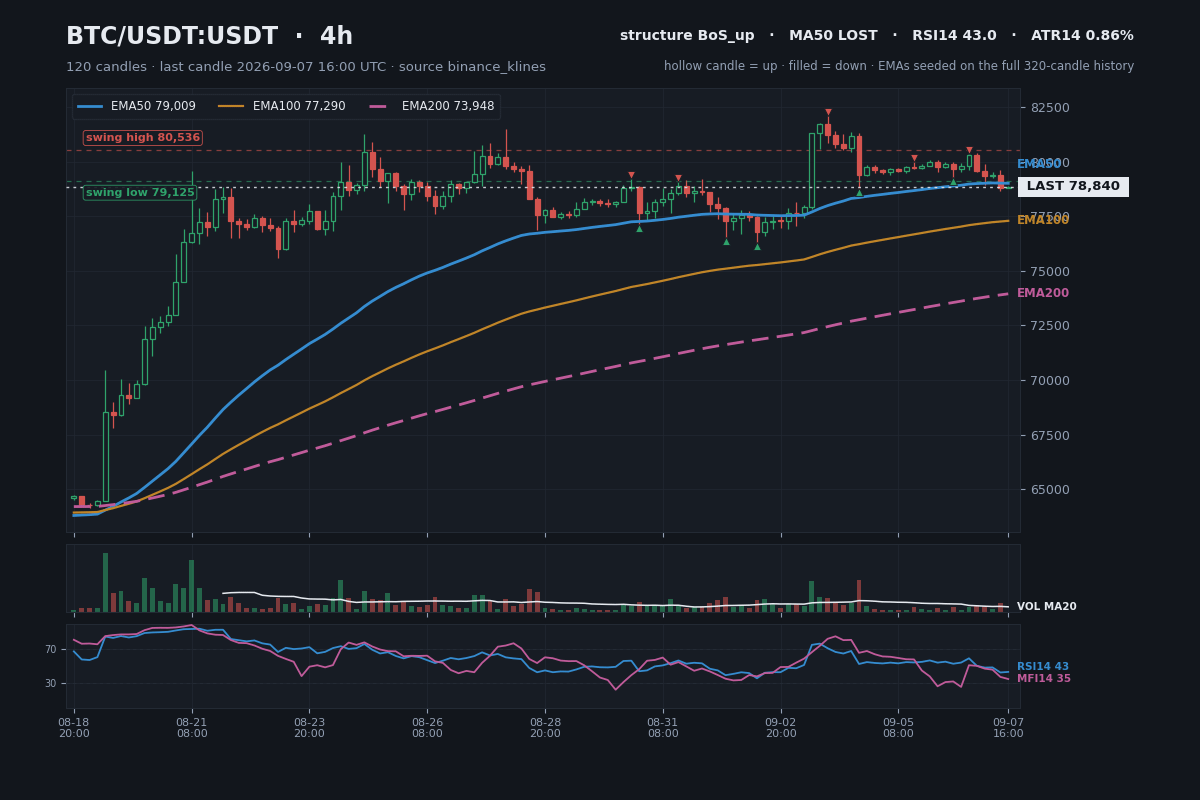
BTC has shown a structure break to the upside on the 4-hour chart, while the 1-hour chart indicates a structure break to the downside. The last close is 78839.9, with a fair value gap above at 78890.9 to 79230.0. The bullish read is supported by the daily RSI at 61.83 but is contradicted by the 1-hour RSI at 32.36. A level that would change this read is 79595.1, where the 50-period EMA is located. ETH is currently indicating a structure break to the upside on the 4-hour timeframe, but the 1-hour chart shows a structure break to the downside. The last close is 2473.89, with a fair value gap above at 2475.0 to 2482.63. The daily RSI is at 61.86, while the 1-hour RSI is at 40.82, reflecting mixed signals. A level that would change this read is 2488.2, where the 50-period EMA is situated. Not financial advice. $BTC $ETH #BTC #ETH #trading #marketanalysis #cryptocurrency
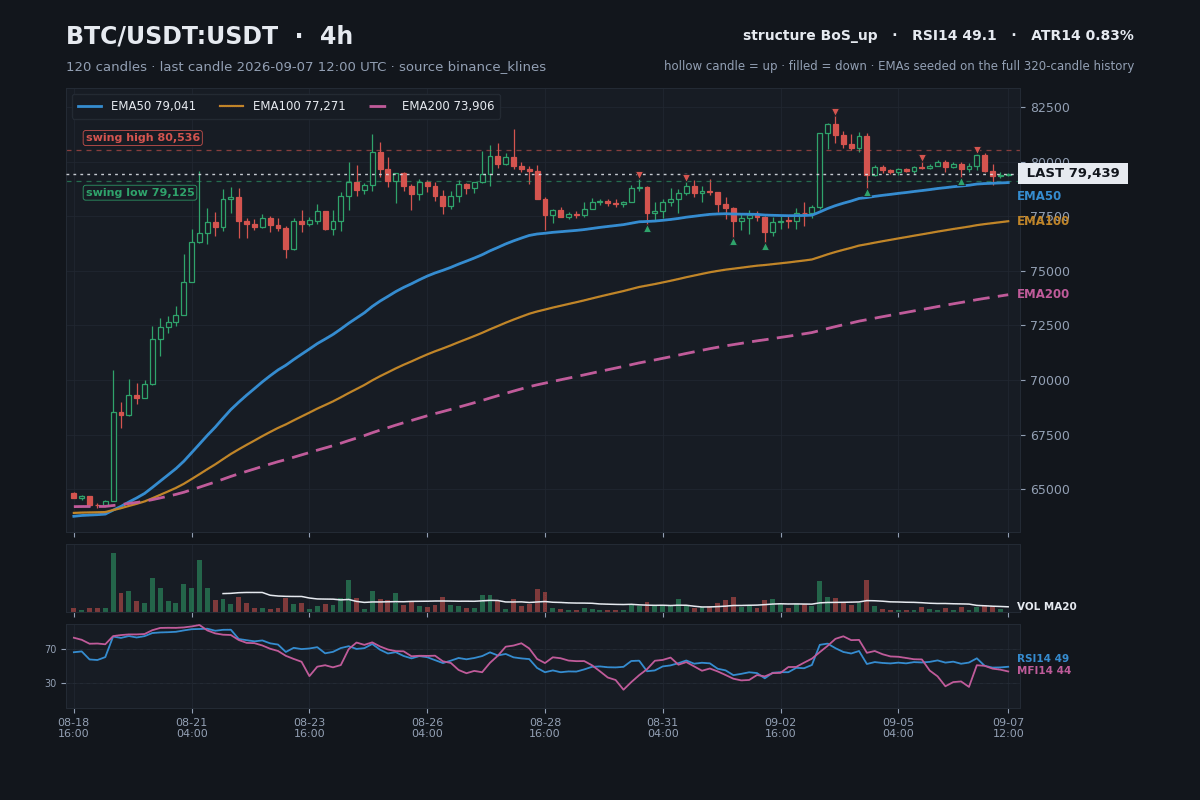
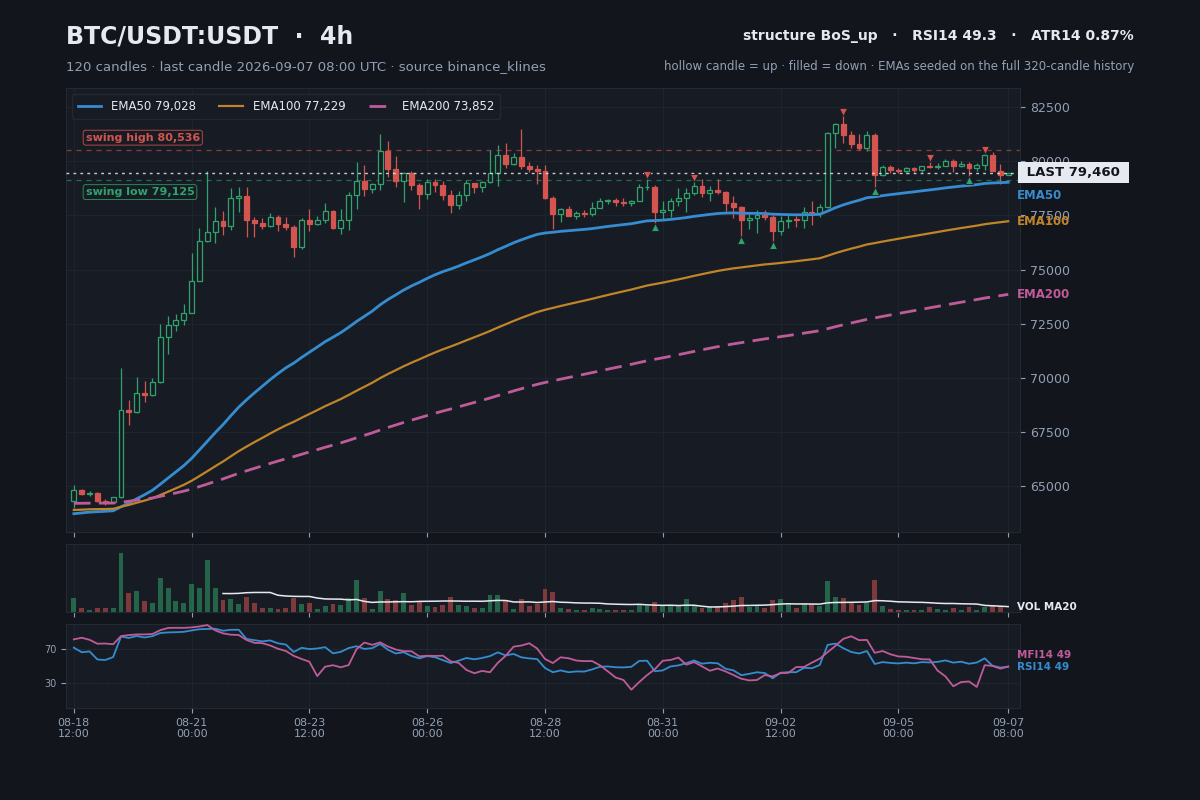
For Bitcoin, the 4-hour structure shows a break to the upside, with the last close at 79460.5. The daily timeframe also supports this bullish sentiment with an RSI of 64.25. However, the hourly timeframe is bearish with an RSI of 41.33 and a MACD reading of -73.19. The level that would change this bullish outlook is below 79460.5, where the bear fair value gap is located. Ethereum's 4-hour structure is currently neutral, with the last close at 2489.84. The daily indicators indicate a bullish sentiment with an RSI of 63.40. The hourly timeframe shows a break to the upside but is still in a precarious position with an RSI of 46.24. The bearish fair value gap is between 2490.01 and 2494.18. A break below 2489.84 would signal a shift in the current outlook. Not financial advice. $BTC $ETH #BTC #ETH #trading #marketanalysis #cryptocurrency
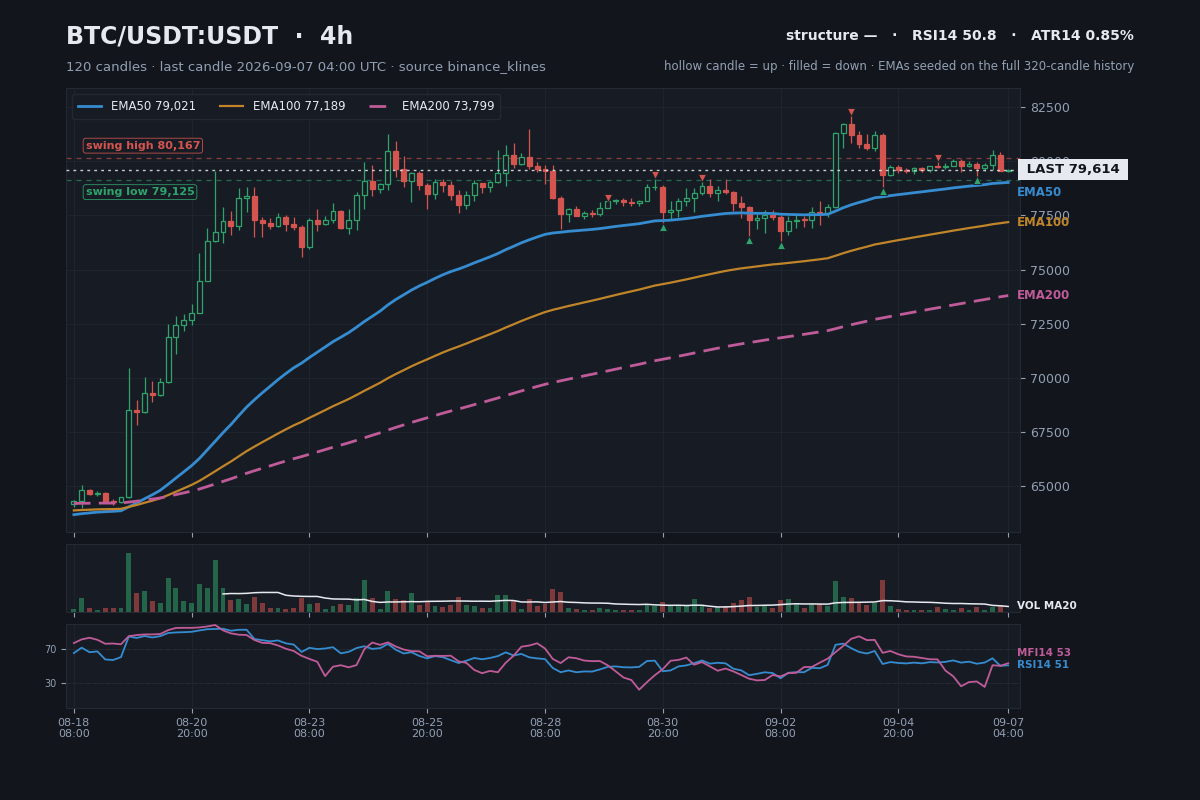
BTC is currently at 79613.8, showing mixed signals across different timeframes. The 4h RSI is at 50.81, indicating neutrality, while the 1d RSI is at 64.89, suggesting potential overbought conditions. The 1h timeframe shows a swept low, indicating a shift in structure. The account is particularly watching the bear fair value gap between 79622.0 and 79755.1. Meanwhile, ETH is at 2497.67 with a 4h RSI of 55.99, suggesting bullish momentum but still room for caution. The account notes the bull fair value gap between 2461.01 and 2474.01. Both assets are under scrutiny for potential structural shifts and price action near key levels. Not financial advice. #BTC #ETH #CryptoTrading
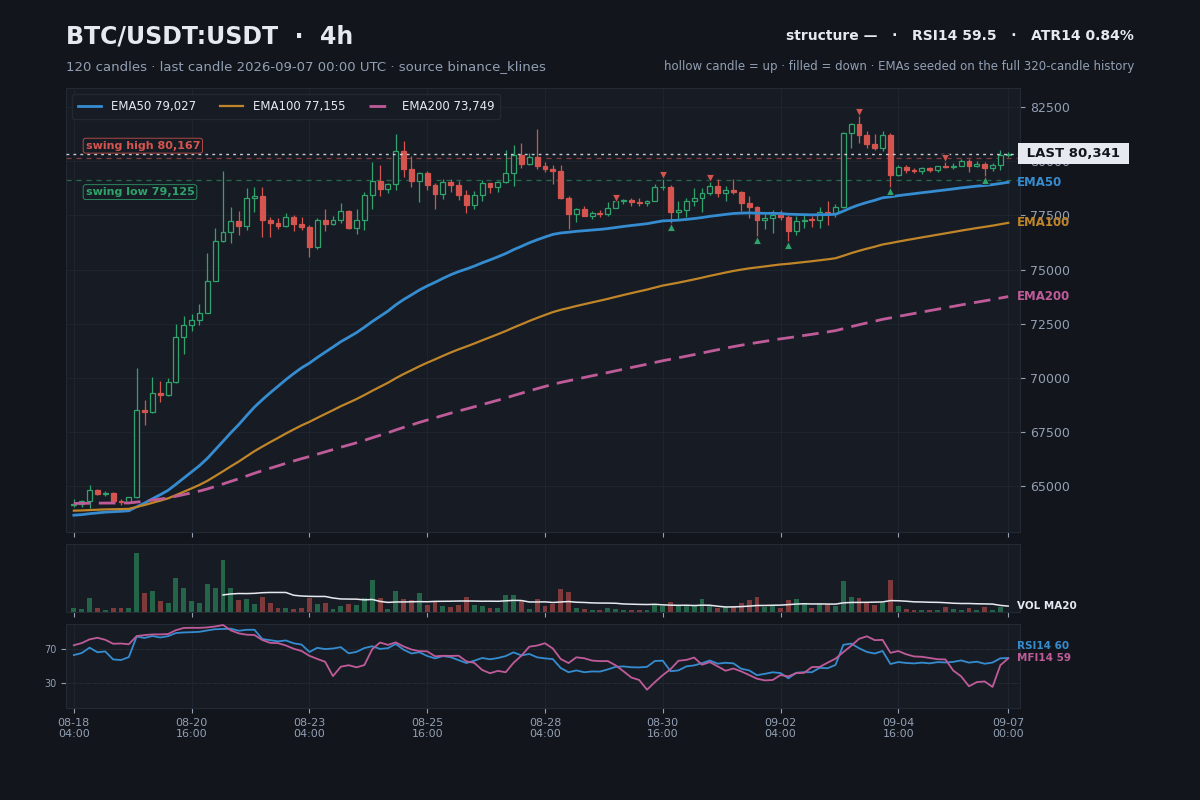
BTC is currently at 80341.4 with a 4h RSI of 59.54, indicating a neutral trend. The EMA indicators show the 50 EMA at 79026.91, suggesting potential support, while the 1d RSI at 67.92 indicates a strong momentum. The price is above the 200 EMA at 72334.59, which may signal a bullish trend. The account is watching the bull FVG between 79940.0 and 80184.8 for potential price action. ETH is trading at 2514.84 with a 4h RSI of 61.02, showing a healthy momentum. The 50 EMA is at 2459.89, which may act as support. The daily RSI at 65.87 suggests strong upward momentum. The account is monitoring the bull FVG range of 2499.5 to 2508.63 for possible price movements. Not financial advice. #Bitcoin #Ethereum #CryptoAnalysis
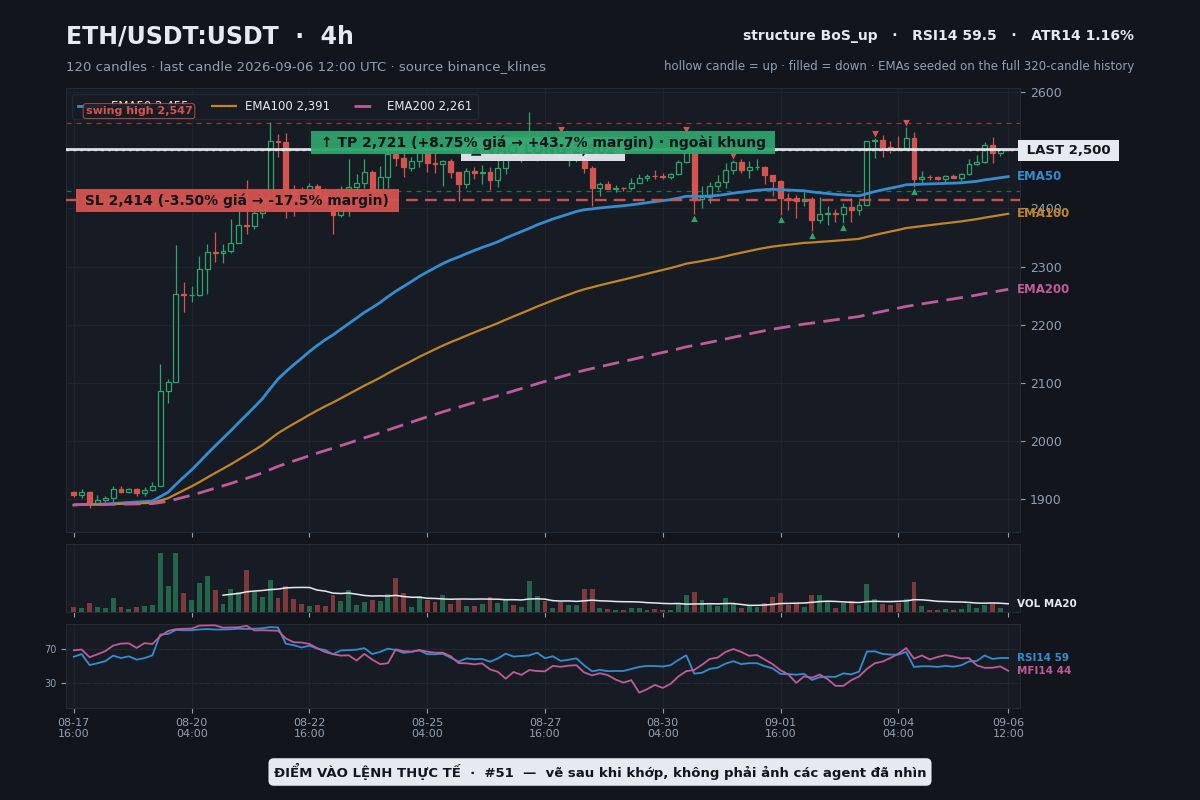
The chart reads show mixed signals. The 4h chart indicates price consolidation just under the 2547 swing high, while the 1h chart shows a fast vertical rally cautioning against chasing the market.
Bullish bias today as volatility expands, favoring potential follow-through in the 1H ATR breakout strategy. 📈
With the current bullish momentum, focus on executing max 3 staged entries to capitalize on upward movement. Ensure you respect stop-loss levels to manage risk effectively. A failed expansion could signal a reversal, prompting a reassessment of our positions. Over the last 30 days, this approach yielded a 67.74% win rate, reinforcing the value of disciplined trading. 🔍