
bullzaro
42 Posts

bullzaro
Report
Block User
Crypto Trader | 📊 | BTC & Altcoin Analysis SMC • Breakouts • Risk Management Sharing my market views, not financial advice.
High-Frequency Trader
2.4 Years
22 Following
34 Followers
56 Liked
Posts
All
Quotes
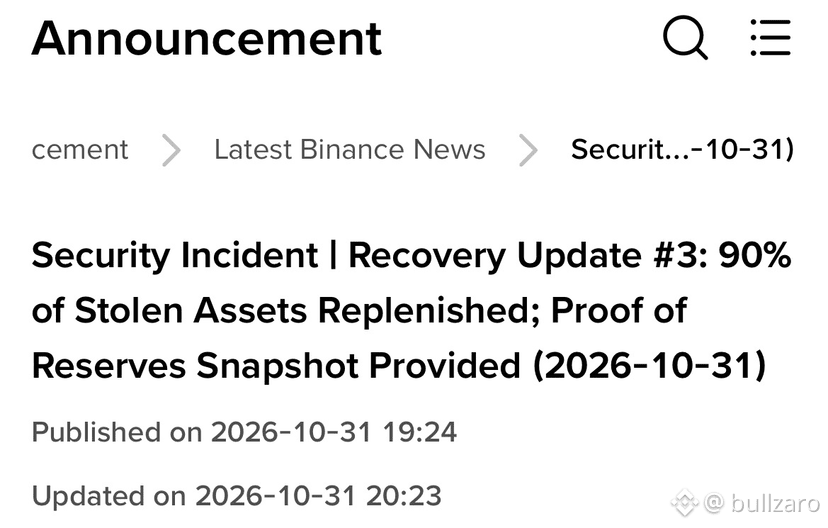
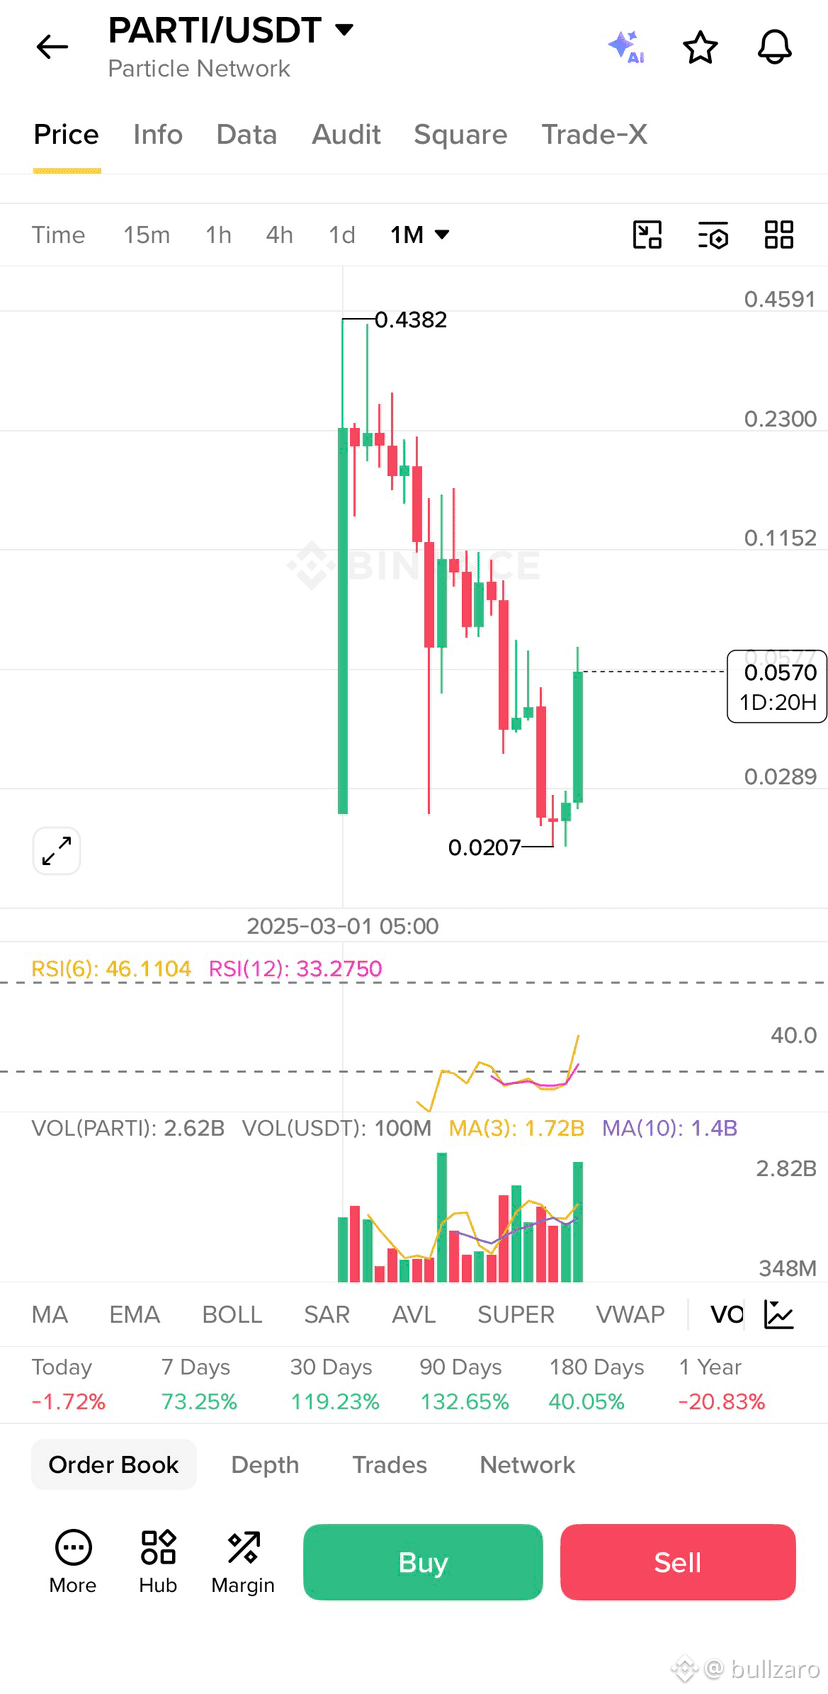
·
--
Bearish
Crypto market crashing.
$SOL falls under $96
$XRP falls under $1.25
$ETH falls under $2,250
Over $600,000,000 in leveraged crypto long positions have been liquidated in the past 30 minutes.
#NewsAboutCrypto #binance #BrazilCryptoExchangesMustApplyForLicensesByFriday
{spot}(ETHUSDT)
Crypto market crashing.
$SOL falls under $96
$XRP falls under $1.25
$ETH falls under $2,250
Over $600,000,000 in leveraged crypto long positions have been liquidated in the past 30 minutes.
#NewsAboutCrypto #binance #BrazilCryptoExchangesMustApplyForLicensesByFriday
$SOL falls under $96
$XRP falls under $1.25
$ETH falls under $2,250
Over $600,000,000 in leveraged crypto long positions have been liquidated in the past 30 minutes.
#NewsAboutCrypto #binance #BrazilCryptoExchangesMustApplyForLicensesByFriday
40
·
--
Bearish
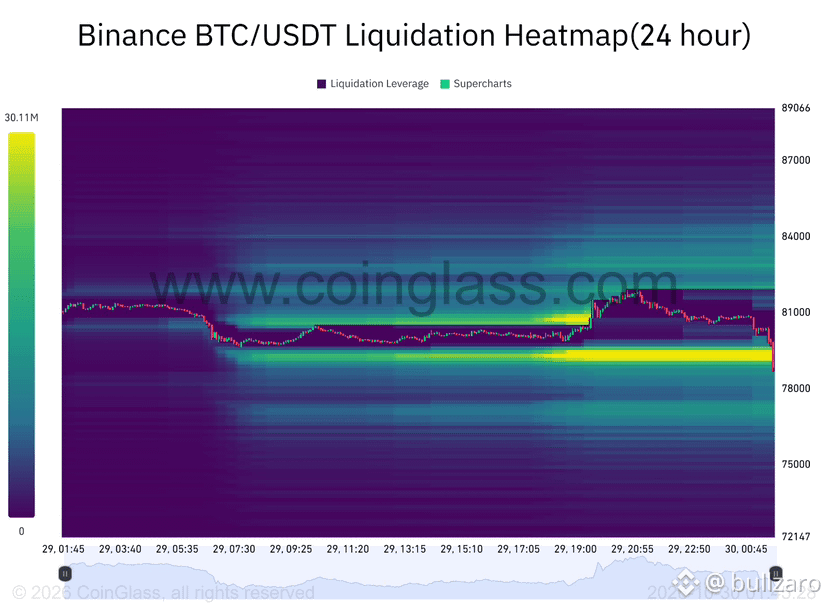
🚨 $124 MILLION IN $BTC LONG LIQUIDATIONS IN THE LAST 1 HOUR! Bitcoin has witnessed a massive long liquidation cascade, putting intense pressure on the market. BTC is currently trading around $78,400, with $78,000 acting as a key support zone. If selling pressure continues, further downside could follow, while a strong recovery above $79,000 may signal a potential relief bounce. Stay cautious, as high volatility can create opportunities as well as risks.
#FedWatch #EarnFreeCrypto2024 #EarningCrypto #btc70k
{spot}(BTCUSDT)
🚨 $124 MILLION IN $BTC LONG LIQUIDATIONS IN THE LAST 1 HOUR! Bitcoin has witnessed a massive long liquidation cascade, putting intense pressure on the market. BTC is currently trading around $78,400, with $78,000 acting as a key support zone. If selling pressure continues, further downside could follow, while a strong recovery above $79,000 may signal a potential relief bounce. Stay cautious, as high volatility can create opportunities as well as risks.
#FedWatch #EarnFreeCrypto2024 #EarningCrypto #btc70k
#FedWatch #EarnFreeCrypto2024 #EarningCrypto #btc70k
1
427
·
--
Bullish
$BTC *BTC/USDT 12H - Technical Analysis:*
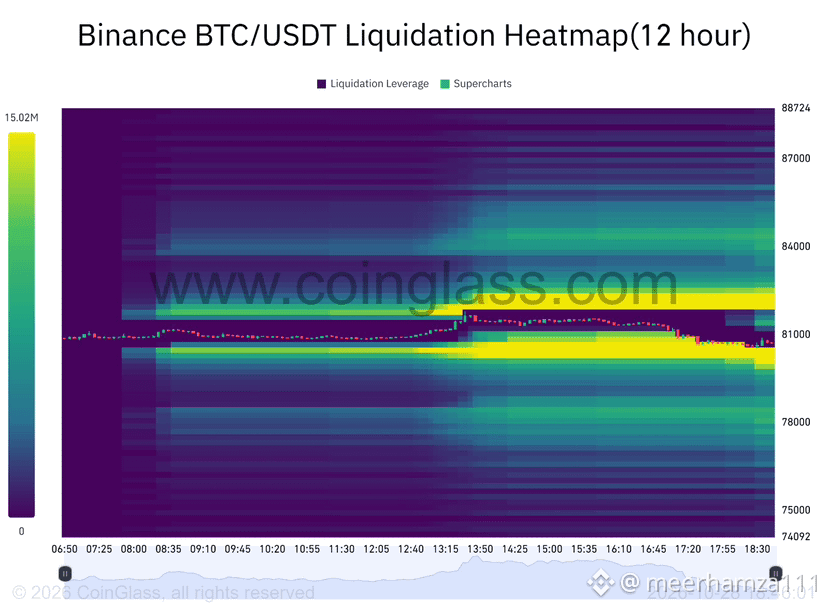
BTC is trading around *$80,800*, trapped between two heavy liquidation zones. Resistance is at *$82,000-$82,500* where shorts are stacked, and support is at *$80,000-$80,300* where longs are stacked. Price is squeezing, so a sharp move is coming soon. If BTC breaks above *$82.5K*, it can run to *$84K*. If it loses *$80K*, a drop to *$78K* is likely. Bias: Neutral, but upside magnet is stronger. Which side first? 🚀 or 📉
#btc #CanMicrosoftDeliverOnAI $BTC
{spot}(BTCUSDT)
$BTC *BTC/USDT 12H - Technical Analysis:*
BTC is trading around *$80,800*, trapped between two heavy liquidation zones. Resistance is at *$82,000-$82,500* where shorts are stacked, and support is at *$80,000-$80,300* where longs are stacked. Price is squeezing, so a sharp move is coming soon. If BTC breaks above *$82.5K*, it can run to *$84K*. If it loses *$80K*, a drop to *$78K* is likely. Bias: Neutral, but upside magnet is stronger. Which side first? 🚀 or 📉
#btc #CanMicrosoftDeliverOnAI $BTC
BTC is trading around *$80,800*, trapped between two heavy liquidation zones. Resistance is at *$82,000-$82,500* where shorts are stacked, and support is at *$80,000-$80,300* where longs are stacked. Price is squeezing, so a sharp move is coming soon. If BTC breaks above *$82.5K*, it can run to *$84K*. If it loses *$80K*, a drop to *$78K* is likely. Bias: Neutral, but upside magnet is stronger. Which side first? 🚀 or 📉
#btc #CanMicrosoftDeliverOnAI $BTC
1
1
1
1.4k
·
--
Bullish
1
190
·
--
Bullish
$BTC
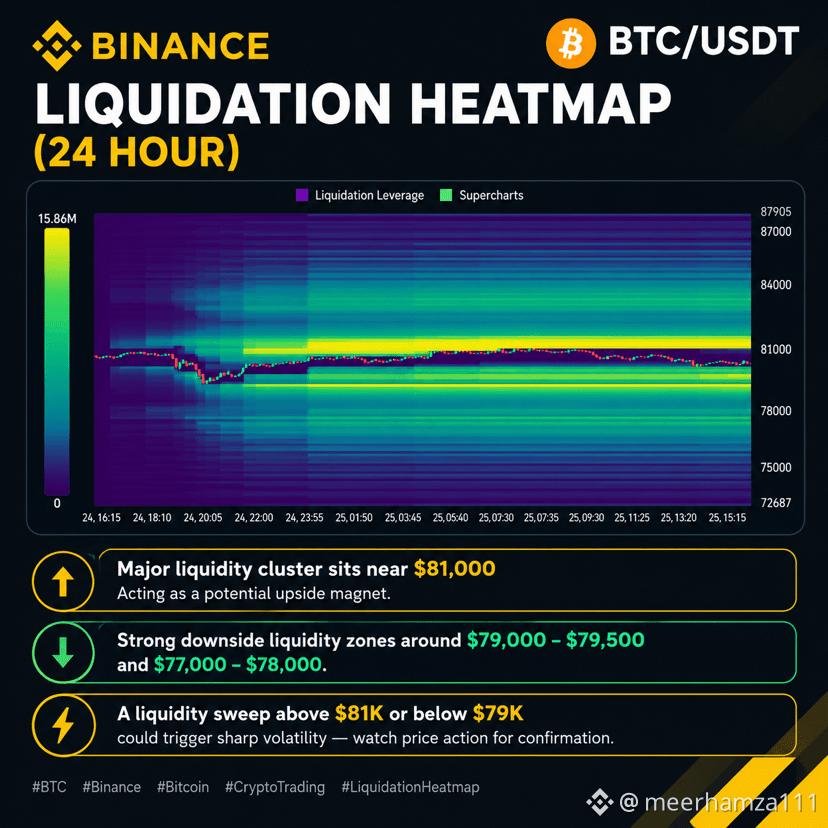
📊 BTC/USDT Liquidation Heatmap | Binance
🔥 Major liquidity cluster sits near $81,000, acting as a potential upside magnet.
🟢 Strong downside liquidity zones around $79,000–$79,500 and $77,000–$78,000.
⚡ A liquidity sweep above $81K or below $79K could trigger sharp volatility—watch price action for confirmation.
#BTC #EarningsSeason Binance #bitcoin #cryptotrading #BinancePick
$BTC
{spot}(BTCUSDT)
$BTC
📊 BTC/USDT Liquidation Heatmap | Binance
🔥 Major liquidity cluster sits near $81,000, acting as a potential upside magnet.
🟢 Strong downside liquidity zones around $79,000–$79,500 and $77,000–$78,000.
⚡ A liquidity sweep above $81K or below $79K could trigger sharp volatility—watch price action for confirmation.
#BTC #EarningsSeason Binance #bitcoin #cryptotrading #BinancePick
$BTC
📊 BTC/USDT Liquidation Heatmap | Binance
🔥 Major liquidity cluster sits near $81,000, acting as a potential upside magnet.
🟢 Strong downside liquidity zones around $79,000–$79,500 and $77,000–$78,000.
⚡ A liquidity sweep above $81K or below $79K could trigger sharp volatility—watch price action for confirmation.
#BTC #EarningsSeason Binance #bitcoin #cryptotrading #BinancePick
$BTC
1
150
·
--
Bullish
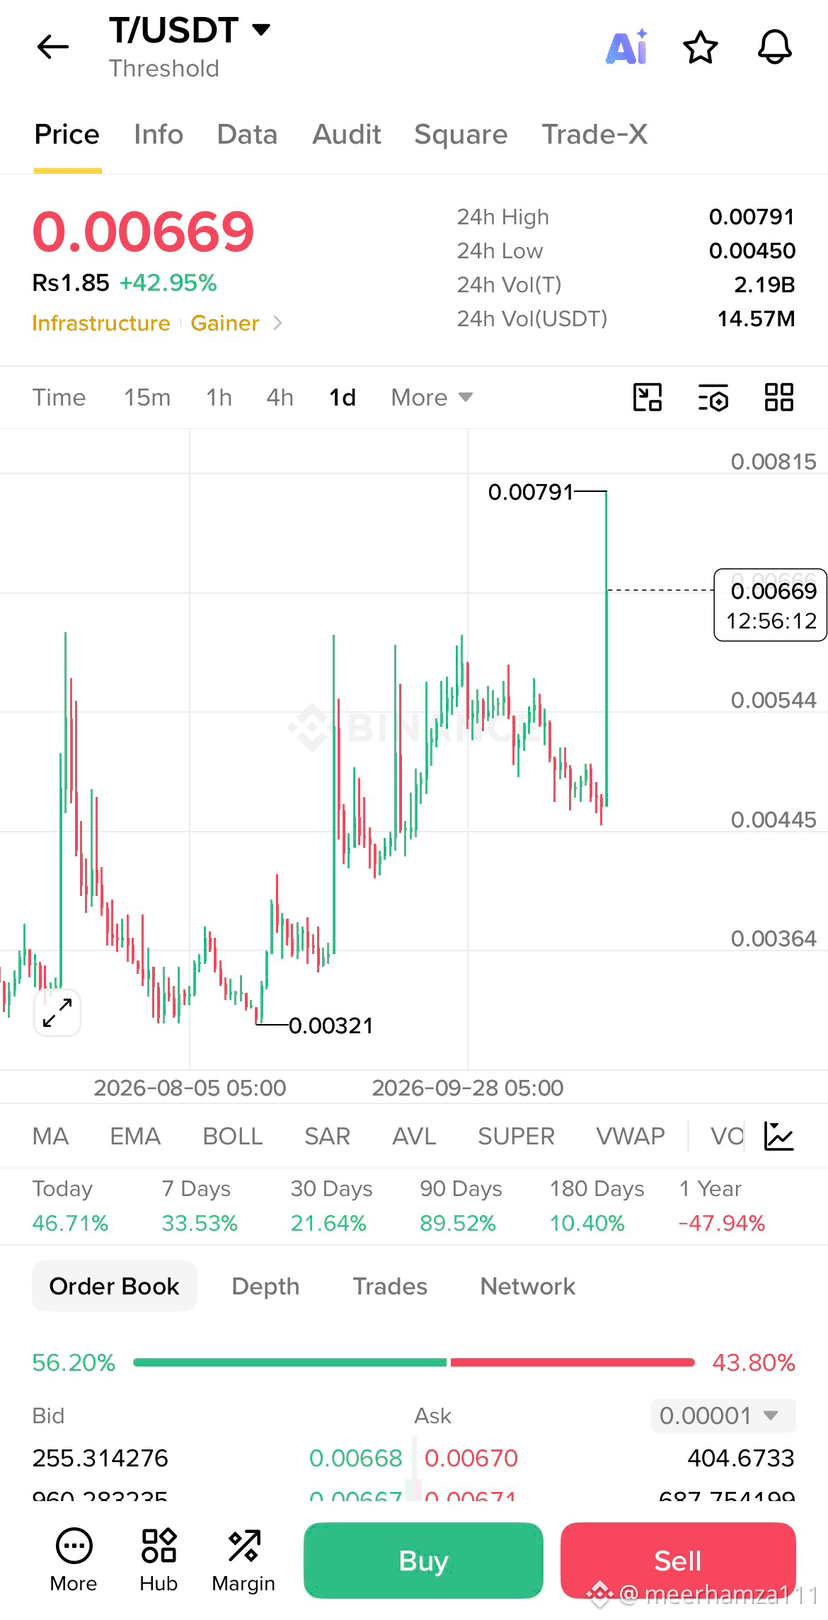
$T 📉 T/USDT: A Lesson for Short Traders
T/USDT is up nearly 43% in 24 hours, with a recent high of 0.00791.
⚠️ Don’t short just because the price has pumped!
A strong coin can continue rising and liquidate overleveraged short sellers.
📌 Short Trading Strategy:
🔹 Wait for rejection at resistance.
🔹 Look for bearish confirmation before entry.
🔹 Place a stop-loss above the invalidation level.
🔹 Target support zones for take-profit.
🔹 Risk only 0.5–1% of your trading capital per trade.
🔹 Avoid excessive leverage.
🎯 Remember: Protecting your capital is more important than catching every move. No setup is guaranteed.
💬 Are you bullish or bearish on T/USDT?
#cryptotrading #BinancePick BinanceSquare #tradingtips #RiskManagement #ShortTrading
$T 📉 T/USDT: A Lesson for Short Traders
T/USDT is up nearly 43% in 24 hours, with a recent high of 0.00791.
⚠️ Don’t short just because the price has pumped!
A strong coin can continue rising and liquidate overleveraged short sellers.
📌 Short Trading Strategy:
🔹 Wait for rejection at resistance.
🔹 Look for bearish confirmation before entry.
🔹 Place a stop-loss above the invalidation level.
🔹 Target support zones for take-profit.
🔹 Risk only 0.5–1% of your trading capital per trade.
🔹 Avoid excessive leverage.
🎯 Remember: Protecting your capital is more important than catching every move. No setup is guaranteed.
💬 Are you bullish or bearish on T/USDT?
#cryptotrading #BinancePick BinanceSquare #tradingtips #RiskManagement #ShortTrading
T/USDT is up nearly 43% in 24 hours, with a recent high of 0.00791.
⚠️ Don’t short just because the price has pumped!
A strong coin can continue rising and liquidate overleveraged short sellers.
📌 Short Trading Strategy:
🔹 Wait for rejection at resistance.
🔹 Look for bearish confirmation before entry.
🔹 Place a stop-loss above the invalidation level.
🔹 Target support zones for take-profit.
🔹 Risk only 0.5–1% of your trading capital per trade.
🔹 Avoid excessive leverage.
🎯 Remember: Protecting your capital is more important than catching every move. No setup is guaranteed.
💬 Are you bullish or bearish on T/USDT?
#cryptotrading #BinancePick BinanceSquare #tradingtips #RiskManagement #ShortTrading
1
253
·
--

Article
Phases of a Trader: The Real Journey Most People Never Talk AboutEvery trader starts the same way.
Very few finish the same way.
The difference isn’t luck, signals, or a secret strategy.
It’s the phase you’re currently stuck in — and whether you have the discipline to move forward.
Here are the four real phases every serious trader goes through:
1. Beginner – “This Looks Easy”
You open the charts.
Green candles. Quick profits. Dopamine hits.
You feel unstoppable.Reality: You’re trading without a plan, risking too much, and confusing luck with skill.Most people never leave this phase because the market eventually takes everything back — with interest.
2. Intermediate – “Why Is This So Hard?”
This is where most traders quit.Losses pile up. Emotions take over. You start blaming the market, the news, or “manipulation.”The pain is necessary.This is the phase where you either develop discipline… or you leave trading forever.
If you’re here right now, you’re not failing — you’re being tested.
3. Advanced – “Process Over Profits”
Something clicks.You stop chasing moves. You start following a plan.Risk management becomes non-negotiable. You journal every trade. You care more about executing correctly than making money on any single trade.This is the most important shift.Profits become a byproduct of process — not the goal itself.
4. Master – “Trading With Edge”
You no longer need motivation.You have emotional control, consistent execution, and a real statistical edge.Trading feels calm. Almost boring. And that’s exactly how it should feel.You understand that survival and consistency matter more than being right.
The Hard Truth:
Most people stay stuck between Phase 1 and Phase 2 for years.
Only a small percentage reach Phase
3.Even fewer reach Phase
4.The market doesn’t care how long you’ve been trading.It only rewards those who treat it like a serious profession.
Discipline. Process. Patience. Edge.
Master all four — or the market will keep teaching you the same expensive lessons.
Which phase are you in right now?
Follow for more$BNB
#BinancePick
#BinancePick #EarningsSeason #article $NVDAB BTC
{spot}(BTCUSDT)
Phases of a Trader: The Real Journey Most People Never Talk About
Every trader starts the same way.
Very few finish the same way.
The difference isn’t luck, signals, or a secret strategy.
It’s the phase you’re currently stuck in — and whether you have the discipline to move forward.
Here are the four real phases every serious trader goes through:
1. Beginner – “This Looks Easy”
You open the charts.
Green candles. Quick profits. Dopamine hits.
You feel unstoppable.Reality: You’re trading without a plan, risking too much, and confusing luck with skill.Most people never leave this phase because the market eventually takes everything back — with interest.
2. Intermediate – “Why Is This So Hard?”
This is where most traders quit.Losses pile up. Emotions take over. You start blaming the market, the news, or “manipulation.”The pain is necessary.This is the phase where you either develop discipline… or you leave trading forever.
If you’re here right now, you’re not failing — you’re being tested.
3. Advanced – “Process Over Profits”
Something clicks.You stop chasing moves. You start following a plan.Risk management becomes non-negotiable. You journal every trade. You care more about executing correctly than making money on any single trade.This is the most important shift.Profits become a byproduct of process — not the goal itself.
4. Master – “Trading With Edge”
You no longer need motivation.You have emotional control, consistent execution, and a real statistical edge.Trading feels calm. Almost boring. And that’s exactly how it should feel.You understand that survival and consistency matter more than being right.
The Hard Truth:
Most people stay stuck between Phase 1 and Phase 2 for years.
Only a small percentage reach Phase
3.Even fewer reach Phase
4.The market doesn’t care how long you’ve been trading.It only rewards those who treat it like a serious profession.
Discipline. Process. Patience. Edge.
Master all four — or the market will keep teaching you the same expensive lessons.
Which phase are you in right now?
Follow for more$BNB
#BinancePick
#BinancePick #EarningsSeason #article $NVDAB BTC
Very few finish the same way.
The difference isn’t luck, signals, or a secret strategy.
It’s the phase you’re currently stuck in — and whether you have the discipline to move forward.
Here are the four real phases every serious trader goes through:
1. Beginner – “This Looks Easy”
You open the charts.
Green candles. Quick profits. Dopamine hits.
You feel unstoppable.Reality: You’re trading without a plan, risking too much, and confusing luck with skill.Most people never leave this phase because the market eventually takes everything back — with interest.
2. Intermediate – “Why Is This So Hard?”
This is where most traders quit.Losses pile up. Emotions take over. You start blaming the market, the news, or “manipulation.”The pain is necessary.This is the phase where you either develop discipline… or you leave trading forever.
If you’re here right now, you’re not failing — you’re being tested.
3. Advanced – “Process Over Profits”
Something clicks.You stop chasing moves. You start following a plan.Risk management becomes non-negotiable. You journal every trade. You care more about executing correctly than making money on any single trade.This is the most important shift.Profits become a byproduct of process — not the goal itself.
4. Master – “Trading With Edge”
You no longer need motivation.You have emotional control, consistent execution, and a real statistical edge.Trading feels calm. Almost boring. And that’s exactly how it should feel.You understand that survival and consistency matter more than being right.
The Hard Truth:
Most people stay stuck between Phase 1 and Phase 2 for years.
Only a small percentage reach Phase
3.Even fewer reach Phase
4.The market doesn’t care how long you’ve been trading.It only rewards those who treat it like a serious profession.
Discipline. Process. Patience. Edge.
Master all four — or the market will keep teaching you the same expensive lessons.
Which phase are you in right now?
Follow for more$BNB
#BinancePick
#BinancePick #EarningsSeason #article $NVDAB BTC
1
72
·
--
Bearish
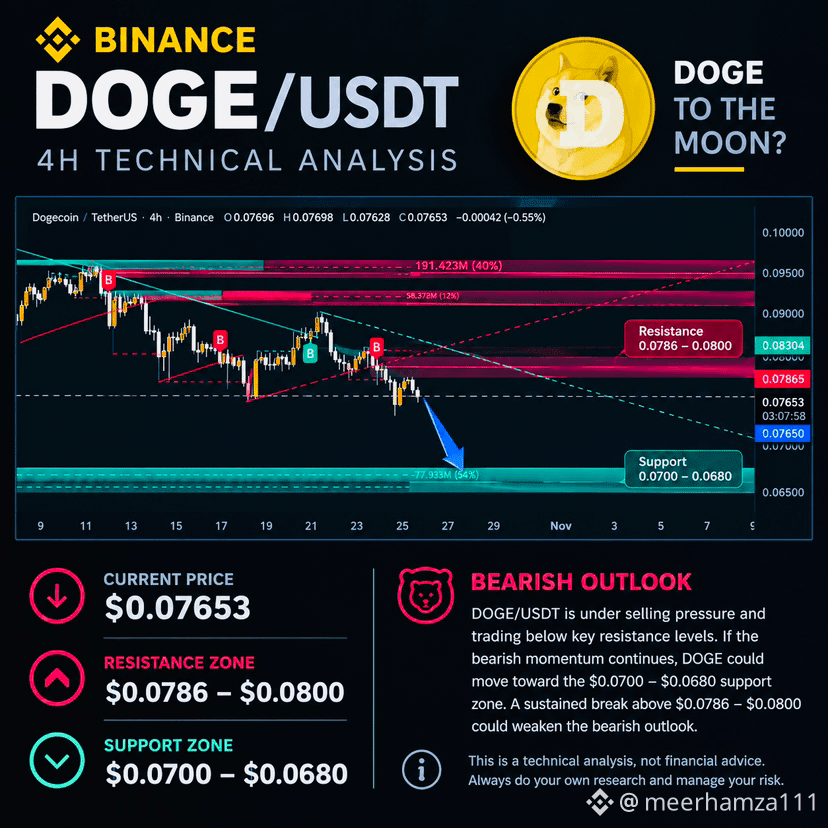
$DOGE Targets – Binance (4H)
Current Price: $0.07653
Target 1: $0.07300
Target 2: $0.07000
Target 3: $0.06800
Resistance 1: $0.07865
Resistance 2: $0.08000
Bias: Bearish 📉
Targets are potential downside levels, not guaranteed outcomes. Wait for price confirmation and manage risk carefully.
Follow for more
#BinancePick #DOGE #viral
{future}(DOGEUSDT)
$DOGE Targets – Binance (4H)
Current Price: $0.07653
Target 1: $0.07300
Target 2: $0.07000
Target 3: $0.06800
Resistance 1: $0.07865
Resistance 2: $0.08000
Bias: Bearish 📉
Targets are potential downside levels, not guaranteed outcomes. Wait for price confirmation and manage risk carefully.
Follow for more
#BinancePick #DOGE #viral
Current Price: $0.07653
Target 1: $0.07300
Target 2: $0.07000
Target 3: $0.06800
Resistance 1: $0.07865
Resistance 2: $0.08000
Bias: Bearish 📉
Targets are potential downside levels, not guaranteed outcomes. Wait for price confirmation and manage risk carefully.
Follow for more
#BinancePick #DOGE #viral
1
108
·
--
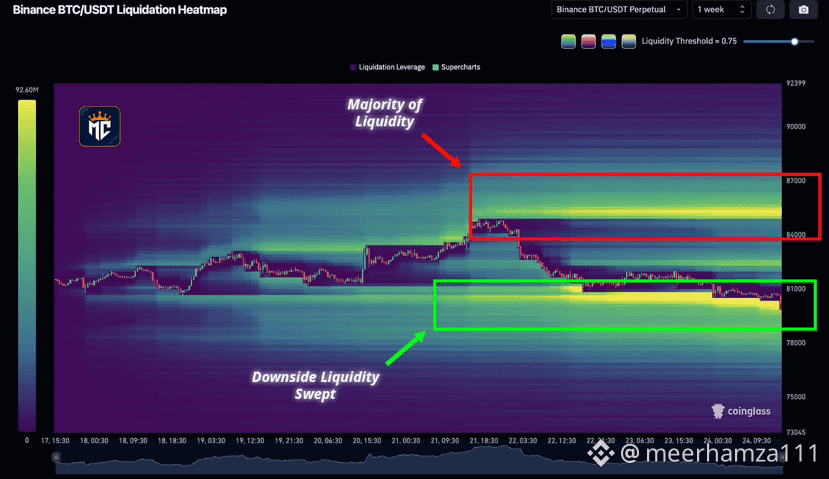
$BTC has swept the downside liquidity.
The largest visible liquidity clusters are now sitting above the current price.
Over *$203.13M* in crypto liquidations hit the market in the past hour, with *$193.92M* coming from longs.
You already know what comes next… 👀
#BinancePick #EarningsSeason
$BTC has swept the downside liquidity.
The largest visible liquidity clusters are now sitting above the current price.
Over *$203.13M* in crypto liquidations hit the market in the past hour, with *$193.92M* coming from longs.
You already know what comes next… 👀
#BinancePick #EarningsSeason
The largest visible liquidity clusters are now sitting above the current price.
Over *$203.13M* in crypto liquidations hit the market in the past hour, with *$193.92M* coming from longs.
You already know what comes next… 👀
#BinancePick #EarningsSeason
1
27
·
--
Bullish
$BNB Recovery Faces a Critical Test: Can Bulls Break $761?
BNB$BNB is attempting to turn its rebound from the $704 region into a more sustainable recovery, with recent market data placing the token near $740. But buyers still face an important resistance barrier.
The technical levels are clear: initial support sits at $729–$720, with $704 remaining the major downside reference. On the upside, $751–$761 is the immediate resistance zone, followed by the more demanding $779–$789 region. The cited daily Supertrend level of $779.53 remains an unverified technical reference.
Jamos Parsa's perspective: A resistance breakout matters less than what happens afterward. A sustained move above $761, supported by stronger trading volume, would improve the bullish case. Rejection followed by a loss of $720 could expose the recovery's underlying weakness.
Will BNB$BNB attract enough demand to confirm a genuine reversal, or are buyers approaching another liquidity test?
#binancepick #viral #TrendingTopic #Growth
$BNB Recovery Faces a Critical Test: Can Bulls Break $761?
BNB$BNB is attempting to turn its rebound from the $704 region into a more sustainable recovery, with recent market data placing the token near $740. But buyers still face an important resistance barrier.
The technical levels are clear: initial support sits at $729–$720, with $704 remaining the major downside reference. On the upside, $751–$761 is the immediate resistance zone, followed by the more demanding $779–$789 region. The cited daily Supertrend level of $779.53 remains an unverified technical reference.
Jamos Parsa's perspective: A resistance breakout matters less than what happens afterward. A sustained move above $761, supported by stronger trading volume, would improve the bullish case. Rejection followed by a loss of $720 could expose the recovery's underlying weakness.
Will BNB$BNB attract enough demand to confirm a genuine reversal, or are buyers approaching another liquidity test?
#binancepick #viral #TrendingTopic #Growth
BNB$BNB is attempting to turn its rebound from the $704 region into a more sustainable recovery, with recent market data placing the token near $740. But buyers still face an important resistance barrier.
The technical levels are clear: initial support sits at $729–$720, with $704 remaining the major downside reference. On the upside, $751–$761 is the immediate resistance zone, followed by the more demanding $779–$789 region. The cited daily Supertrend level of $779.53 remains an unverified technical reference.
Jamos Parsa's perspective: A resistance breakout matters less than what happens afterward. A sustained move above $761, supported by stronger trading volume, would improve the bullish case. Rejection followed by a loss of $720 could expose the recovery's underlying weakness.
Will BNB$BNB attract enough demand to confirm a genuine reversal, or are buyers approaching another liquidity test?
#binancepick #viral #TrendingTopic #Growth

1
35
·
--
Bearish
52
·
--
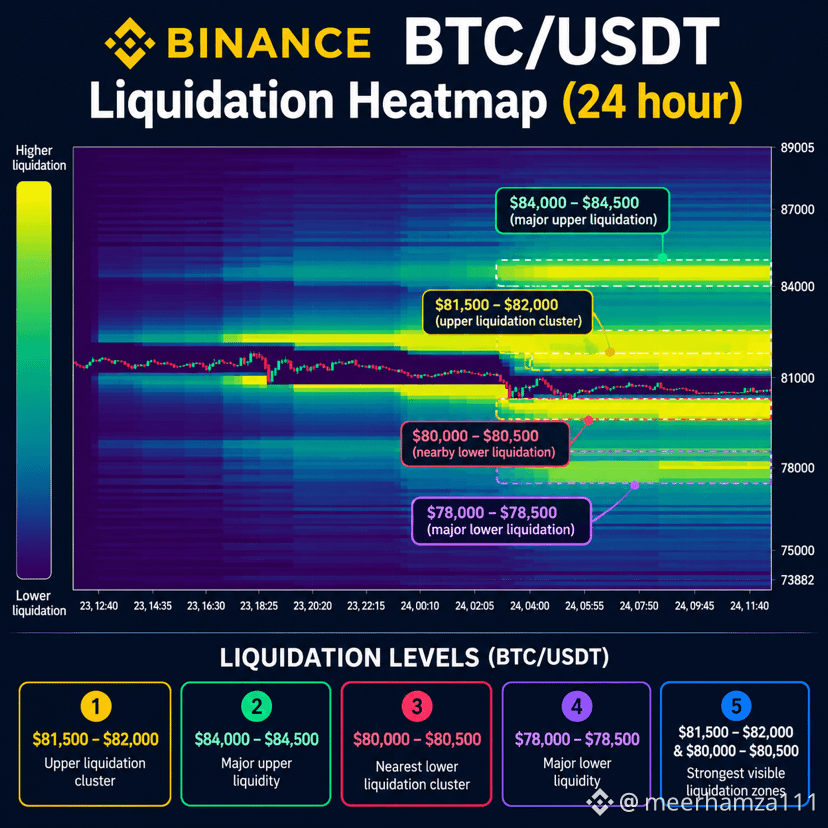
📊 $BTC /USDT LIQUIDATION HEATMAP — KEY LEVELS TO WATCH
Bitcoin is consolidating near $81,000, with major liquidation liquidity zones visible above and below the current price.
🟢 Upper liquidity: $81,500–$82,000
🟡 Major upper zone: $84,000–$84,500
🔴 Lower liquidity: $80,000–$80,500
🟣 Major lower zone: $78,000–$78,500
🎯 What to watch: A move toward either liquidity cluster could trigger liquidations and increase volatility. Wait for price confirmation before entering a trade.
These are potential liquidity zones, not guaranteed price targets.
What do you think — will BTC sweep the upper or lower liquidity first?
Share your analysis below!
#BTC #Bitcoin #CryptoAnalysis #BinanceSquare
#IRSPlansLowerTaxDisclosurePenaltiesForCryptoCases #BTC☀️ #BNBbull
📊 $BTC /USDT LIQUIDATION HEATMAP — KEY LEVELS TO WATCH
Bitcoin is consolidating near $81,000, with major liquidation liquidity zones visible above and below the current price.
🟢 Upper liquidity: $81,500–$82,000
🟡 Major upper zone: $84,000–$84,500
🔴 Lower liquidity: $80,000–$80,500
🟣 Major lower zone: $78,000–$78,500
🎯 What to watch: A move toward either liquidity cluster could trigger liquidations and increase volatility. Wait for price confirmation before entering a trade.
These are potential liquidity zones, not guaranteed price targets.
What do you think — will BTC sweep the upper or lower liquidity first?
Share your analysis below!
#BTC #Bitcoin #CryptoAnalysis #BinanceSquare
#IRSPlansLowerTaxDisclosurePenaltiesForCryptoCases #BTC☀️ #BNBbull
Bitcoin is consolidating near $81,000, with major liquidation liquidity zones visible above and below the current price.
🟢 Upper liquidity: $81,500–$82,000
🟡 Major upper zone: $84,000–$84,500
🔴 Lower liquidity: $80,000–$80,500
🟣 Major lower zone: $78,000–$78,500
🎯 What to watch: A move toward either liquidity cluster could trigger liquidations and increase volatility. Wait for price confirmation before entering a trade.
These are potential liquidity zones, not guaranteed price targets.
What do you think — will BTC sweep the upper or lower liquidity first?
Share your analysis below!
#BTC #Bitcoin #CryptoAnalysis #BinanceSquare
#IRSPlansLowerTaxDisclosurePenaltiesForCryptoCases #BTC☀️ #BNBbull
3
1.4k
·
--
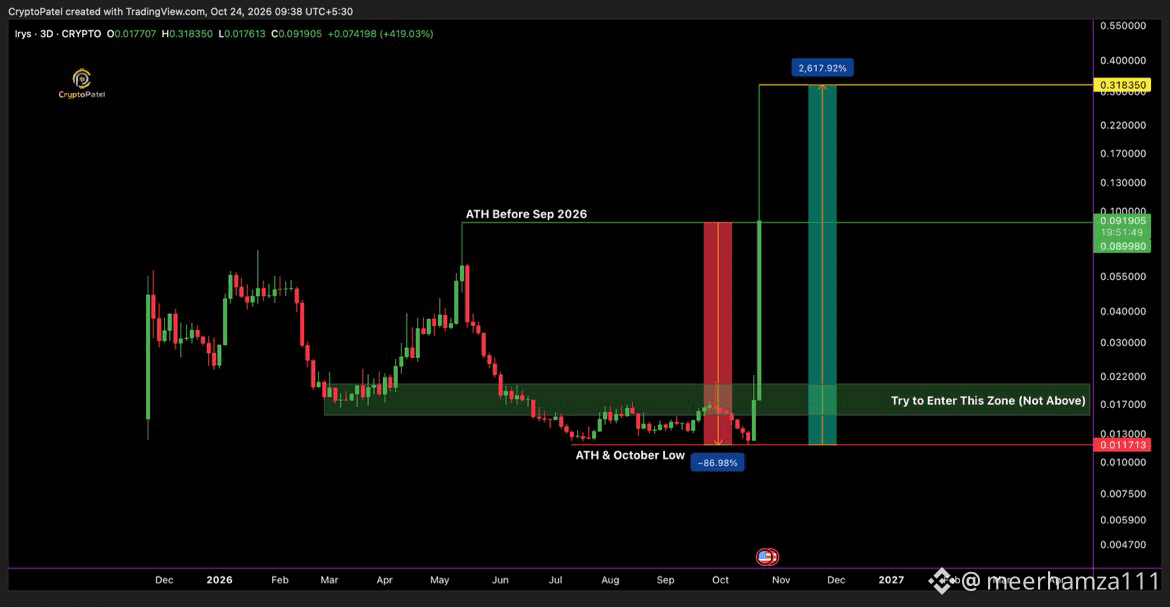
$IRYS PUMPED 2,618%… BEFORE YOU FOMO, LOOK AT THIS 80% CRASH RISK!
Another week. Another insane pump. Another potential FOMO trap.
#IRYS pumped nearly 2,618% from its October low after dumping approximately 87% from its May highs.
Oct 18: ~$0.0117 ($117M FDV)
Today: ~$0.31835 (+27X)
Today’s FDV: ~$3 BILLION+
$IRYS: 77.58M TOKENS UNLOCK TOMORROW!
→ $7.76M Supply Incoming
→ After A 2,618% Pump In One Week!
Will Insiders Take Profits Or Keep Pumping?
But here’s the problem: A massive pump doesn’t mean it’s a good entry.
Chasing vertical green candles is how retail gets trapped at the top.
My Strategy For $IRYS:
Entry Zone: $0.015–$0.020
Don’t FOMO-buy above this zone.
Let the price cool down and wait
$IRYS PUMPED 2,618%… BEFORE YOU FOMO, LOOK AT THIS 80% CRASH RISK!
Another week. Another insane pump. Another potential FOMO trap.
#IRYS pumped nearly 2,618% from its October low after dumping approximately 87% from its May highs.
Oct 18: ~$0.0117 ($117M FDV)
Today: ~$0.31835 (+27X)
Today’s FDV: ~$3 BILLION+
$IRYS : 77.58M TOKENS UNLOCK TOMORROW!
→ $7.76M Supply Incoming
→ After A 2,618% Pump In One Week!
Will Insiders Take Profits Or Keep Pumping?
But here’s the problem: A massive pump doesn’t mean it’s a good entry.
Chasing vertical green candles is how retail gets trapped at the top.
My Strategy For $IRYS :
Entry Zone: $0.015–$0.020
Don’t FOMO-buy above this zone.
Let the price cool down and wait
Another week. Another insane pump. Another potential FOMO trap.
#IRYS pumped nearly 2,618% from its October low after dumping approximately 87% from its May highs.
Oct 18: ~$0.0117 ($117M FDV)
Today: ~$0.31835 (+27X)
Today’s FDV: ~$3 BILLION+
$IRYS : 77.58M TOKENS UNLOCK TOMORROW!
→ $7.76M Supply Incoming
→ After A 2,618% Pump In One Week!
Will Insiders Take Profits Or Keep Pumping?
But here’s the problem: A massive pump doesn’t mean it’s a good entry.
Chasing vertical green candles is how retail gets trapped at the top.
My Strategy For $IRYS :
Entry Zone: $0.015–$0.020
Don’t FOMO-buy above this zone.
Let the price cool down and wait
62
·
--
Bullish
$BMT
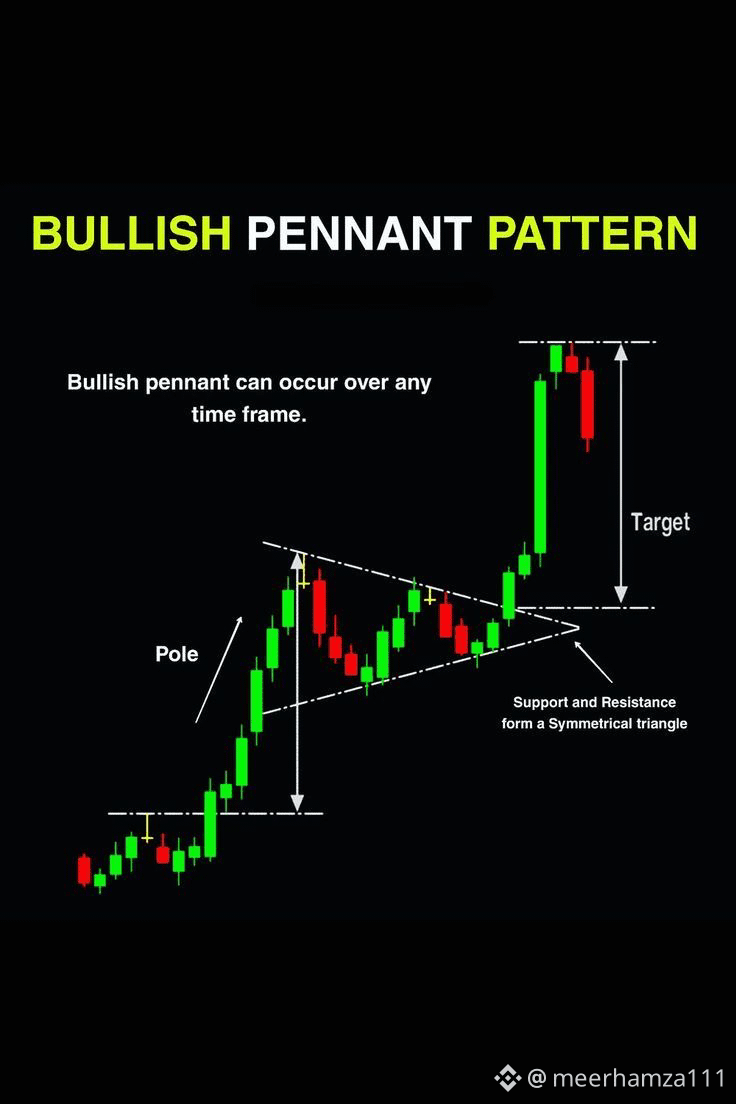
$Bullish Pennant
Strong upward move (the pole) followed by a tight symmetrical triangle consolidation.
This short pause reflects temporary profit-taking before the next leg higher.
Breakout above the upper trendline typically targets a move equal to the height of the pole.
One of the cleanest continuation patterns in a strong uptrend.
#BinancePick #EarningsSeason #TradingPatterns
$BMT
$Bullish Pennant
Strong upward move (the pole) followed by a tight symmetrical triangle consolidation.
This short pause reflects temporary profit-taking before the next leg higher.
Breakout above the upper trendline typically targets a move equal to the height of the pole.
One of the cleanest continuation patterns in a strong uptrend.
#BinancePick #EarningsSeason #TradingPatterns
$Bullish Pennant
Strong upward move (the pole) followed by a tight symmetrical triangle consolidation.
This short pause reflects temporary profit-taking before the next leg higher.
Breakout above the upper trendline typically targets a move equal to the height of the pole.
One of the cleanest continuation patterns in a strong uptrend.
#BinancePick #EarningsSeason #TradingPatterns
181
·
--
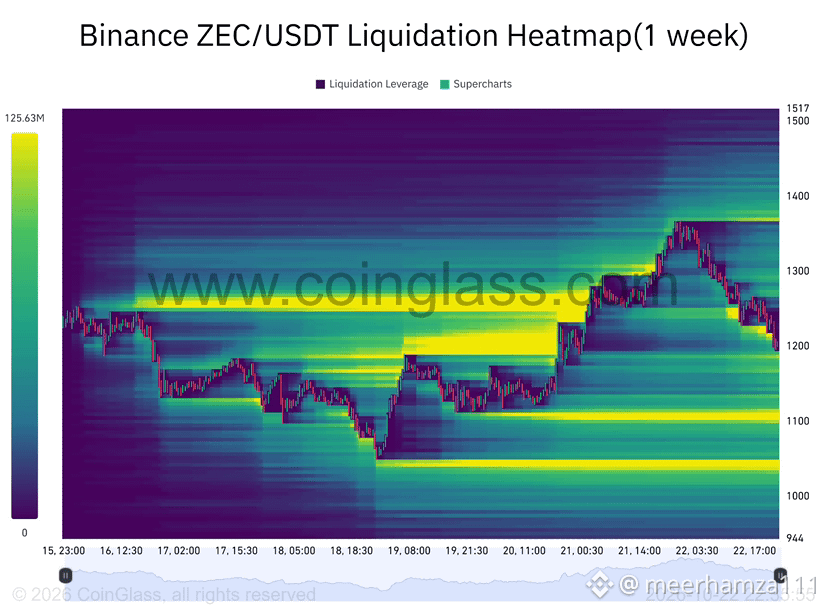
$ZEC 🔥 $ZEC/USDT Downside Liquidity Analysis
📉 Structure: Pullback from $1,380 toward $1,200 is hunting long leverage clusters.
🎯 Target 1 ($1,180): High-density liquidity zone for an initial quick sweep & bounce.
🎯 Target 2 ($1,100): Major support band with dense long liquidation pools.
🎯 Target 3 ($1,010): Psychological level & deep demand zone to clear remaining long leverage.
💡 Strategy: Look for bullish reversal signals or long-wick sweeps around $1,180 & $1,100 before taking
$ZEC 🔥 $ZEC /USDT Downside Liquidity Analysis
📉 Structure: Pullback from $1,380 toward $1,200 is hunting long leverage clusters.
🎯 Target 1 ($1,180): High-density liquidity zone for an initial quick sweep & bounce.
🎯 Target 2 ($1,100): Major support band with dense long liquidation pools.
🎯 Target 3 ($1,010): Psychological level & deep demand zone to clear remaining long leverage.
💡 Strategy: Look for bullish reversal signals or long-wick sweeps around $1,180 & $1,100 before taking
📉 Structure: Pullback from $1,380 toward $1,200 is hunting long leverage clusters.
🎯 Target 1 ($1,180): High-density liquidity zone for an initial quick sweep & bounce.
🎯 Target 2 ($1,100): Major support band with dense long liquidation pools.
🎯 Target 3 ($1,010): Psychological level & deep demand zone to clear remaining long leverage.
💡 Strategy: Look for bullish reversal signals or long-wick sweeps around $1,180 & $1,100 before taking
559
·
--
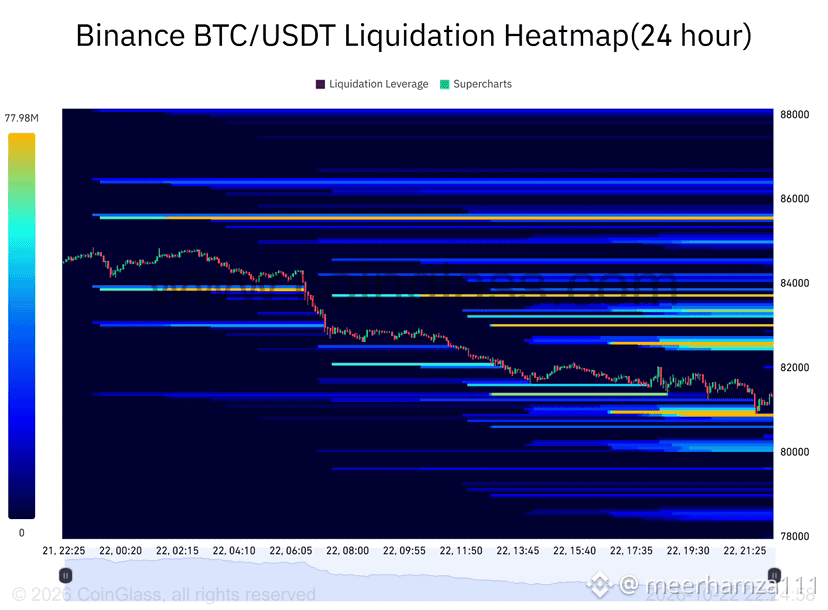
$BTC Liquidation Heatmap Analysis: Rebound or Sweep to $80K? 🚨
Bitcoin ($BTC) is currently consolidating near $81,000 after dropping from the $84,000–$85,000 range. The 24-hour Binance BTC/USDT liquidation heatmap is flashing heavy liquidity clusters on both sides.
Here is what the smart money is watching right now 👇
📊 Key Liquidity Levels to Watch
🔴 Overhead Resistance (Short Liquidation Pools):
$82,500 – $83,000: Immediate high-leverage short positions stacked above.
$84,000 – $84,200: Strong supply cluster where price broke down earlier.
$85,500 – $86,000: Massive bright liquidity pool. A sweep here could trigger a fast short squeeze!
🟢 Downside Support (Long Liquidation Pools):
$80,800 – $81,000: Immediate local demand zone currently being tested.
$80,000: Major psychological support level. A breakdown below this could trigger long liquidations down toward $78,500–$79,000.
💡 Market Insights & Bias
1. Short-Heavy Asymmetry: Dense yellow/cyan clusters are heavily stacked above current price levels ($82.5K to $86K). This indicates over-leveraged short positions during this consolidation.
2. Liquidity Magnet Effect: Price loves to hunt liquidity. If $80,800 holds, market makers may push price upward to hunt early shorts.
🎯 Trading Strategies
Bullish Outlook: Watch for a lower-timeframe double bottom or bullish divergence around $80,800–$81,000 targeting $83,000 \rightarrow $84,200 \rightarrow $85,500.
Bearish Outlook: If $80,800 breaks with heavy sell volume, wait for a sweep of $80,000 and look for a reclaim before taking long positions.
⚠️ Risk Management Note: Keep leverage low (3\text{x}–5\text{x}) to avoid volatility spikes and liquidity sweeps!
💬 What's your move next? Will $BTC sweep $80K first or squeeze shorts up to $85K? Let me know in the comments! 👇
#BTC #Bitcoin #CryptoTrading #LiquidationHeatmap #BinanceSquareFamily $BTC
$BTC Liquidation Heatmap Analysis: Rebound or Sweep to $80K? 🚨
Bitcoin ($BTC ) is currently consolidating near $81,000 after dropping from the $84,000–$85,000 range. The 24-hour Binance BTC/USDT liquidation heatmap is flashing heavy liquidity clusters on both sides.
Here is what the smart money is watching right now 👇
📊 Key Liquidity Levels to Watch
🔴 Overhead Resistance (Short Liquidation Pools):
$82,500 – $83,000: Immediate high-leverage short positions stacked above.
$84,000 – $84,200: Strong supply cluster where price broke down earlier.
$85,500 – $86,000: Massive bright liquidity pool. A sweep here could trigger a fast short squeeze!
🟢 Downside Support (Long Liquidation Pools):
$80,800 – $81,000: Immediate local demand zone currently being tested.
$80,000: Major psychological support level. A breakdown below this could trigger long liquidations down toward $78,500–$79,000.
💡 Market Insights & Bias
1. Short-Heavy Asymmetry: Dense yellow/cyan clusters are heavily stacked above current price levels ($82.5K to $86K). This indicates over-leveraged short positions during this consolidation.
2. Liquidity Magnet Effect: Price loves to hunt liquidity. If $80,800 holds, market makers may push price upward to hunt early shorts.
🎯 Trading Strategies
Bullish Outlook: Watch for a lower-timeframe double bottom or bullish divergence around $80,800–$81,000 targeting $83,000 \rightarrow $84,200 \rightarrow $85,500.
Bearish Outlook: If $80,800 breaks with heavy sell volume, wait for a sweep of $80,000 and look for a reclaim before taking long positions.
⚠️ Risk Management Note: Keep leverage low (3\text{x}–5\text{x}) to avoid volatility spikes and liquidity sweeps!
💬 What's your move next? Will $BTC sweep $80K first or squeeze shorts up to $85K? Let me know in the comments! 👇
#BTC #Bitcoin #CryptoTrading #LiquidationHeatmap #BinanceSquareFamily $BTC
Bitcoin ($BTC ) is currently consolidating near $81,000 after dropping from the $84,000–$85,000 range. The 24-hour Binance BTC/USDT liquidation heatmap is flashing heavy liquidity clusters on both sides.
Here is what the smart money is watching right now 👇
📊 Key Liquidity Levels to Watch
🔴 Overhead Resistance (Short Liquidation Pools):
$82,500 – $83,000: Immediate high-leverage short positions stacked above.
$84,000 – $84,200: Strong supply cluster where price broke down earlier.
$85,500 – $86,000: Massive bright liquidity pool. A sweep here could trigger a fast short squeeze!
🟢 Downside Support (Long Liquidation Pools):
$80,800 – $81,000: Immediate local demand zone currently being tested.
$80,000: Major psychological support level. A breakdown below this could trigger long liquidations down toward $78,500–$79,000.
💡 Market Insights & Bias
1. Short-Heavy Asymmetry: Dense yellow/cyan clusters are heavily stacked above current price levels ($82.5K to $86K). This indicates over-leveraged short positions during this consolidation.
2. Liquidity Magnet Effect: Price loves to hunt liquidity. If $80,800 holds, market makers may push price upward to hunt early shorts.
🎯 Trading Strategies
Bullish Outlook: Watch for a lower-timeframe double bottom or bullish divergence around $80,800–$81,000 targeting $83,000 \rightarrow $84,200 \rightarrow $85,500.
Bearish Outlook: If $80,800 breaks with heavy sell volume, wait for a sweep of $80,000 and look for a reclaim before taking long positions.
⚠️ Risk Management Note: Keep leverage low (3\text{x}–5\text{x}) to avoid volatility spikes and liquidity sweeps!
💬 What's your move next? Will $BTC sweep $80K first or squeeze shorts up to $85K? Let me know in the comments! 👇
#BTC #Bitcoin #CryptoTrading #LiquidationHeatmap #BinanceSquareFamily $BTC
89
Log in to explore more content
Join global crypto users on Binance Square
⚡️ Get latest and useful information about crypto.
💬 Trusted by the world’s largest crypto exchange.
👍 Discover real insights from verified creators.
Email / Phone number
Trending Topics
BinanceWithdrawalScamWarning
13,313 views
425 Discussing
Binance Warns Users of Withdrawal Scams as Services Resume: It Will Never Charge Fees, Sell Queue Spots or Ask You to Move Funds to a “Vault”
Binance News
·10 Likes
·5.2k views
USMidtermElections
563,367 views
2,994 Discussing
USOctoberNFP-AreRateCutsStillPossible
22,266 views
402 Discussing