
Jonathanliriano
48 Posts

Jonathanliriano
35 Following
34 Followers
37 Liked
Posts
All
Quotes
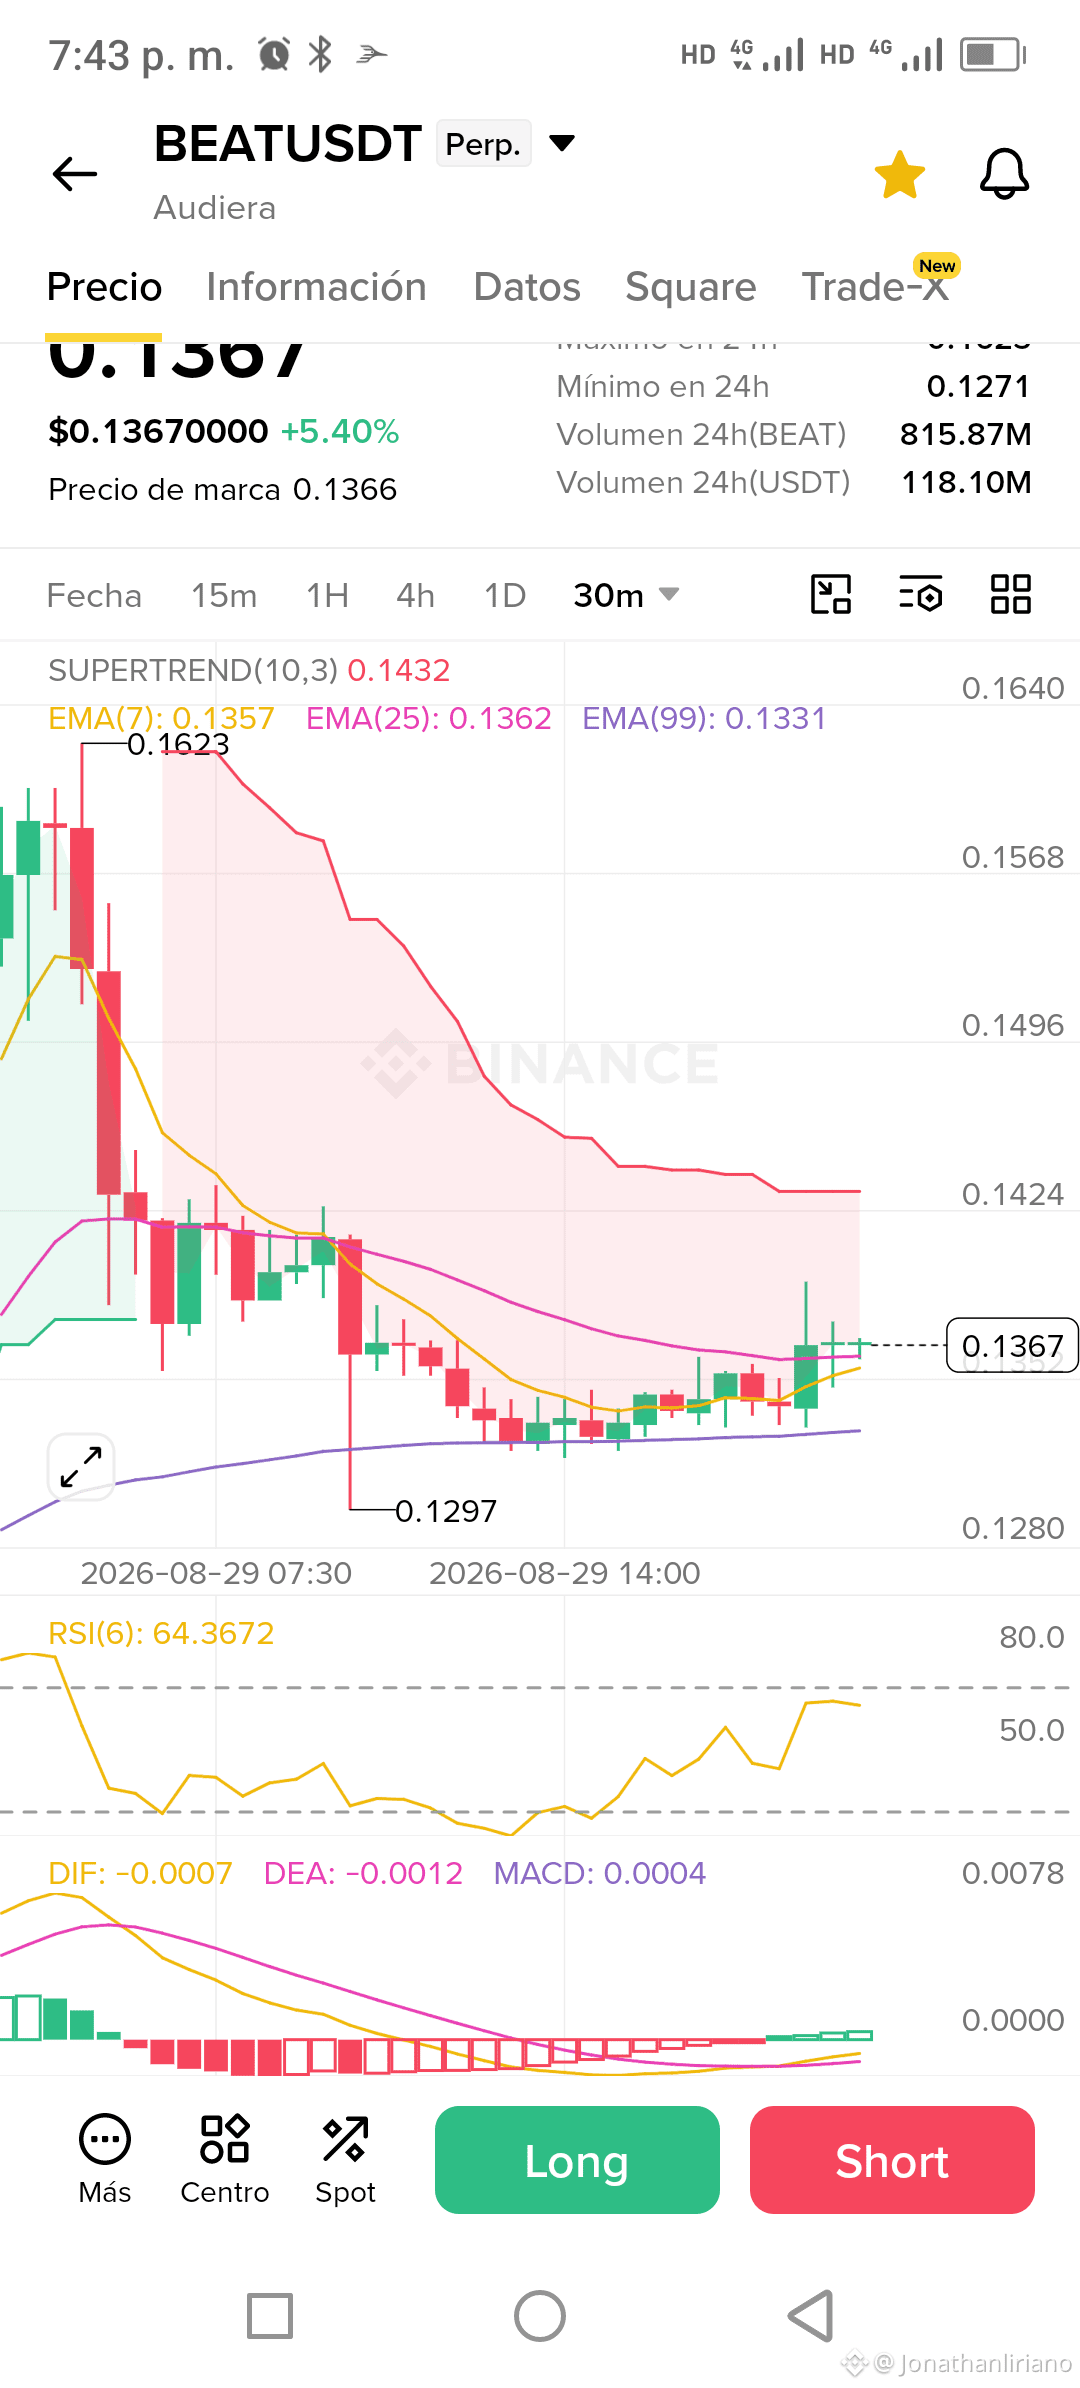
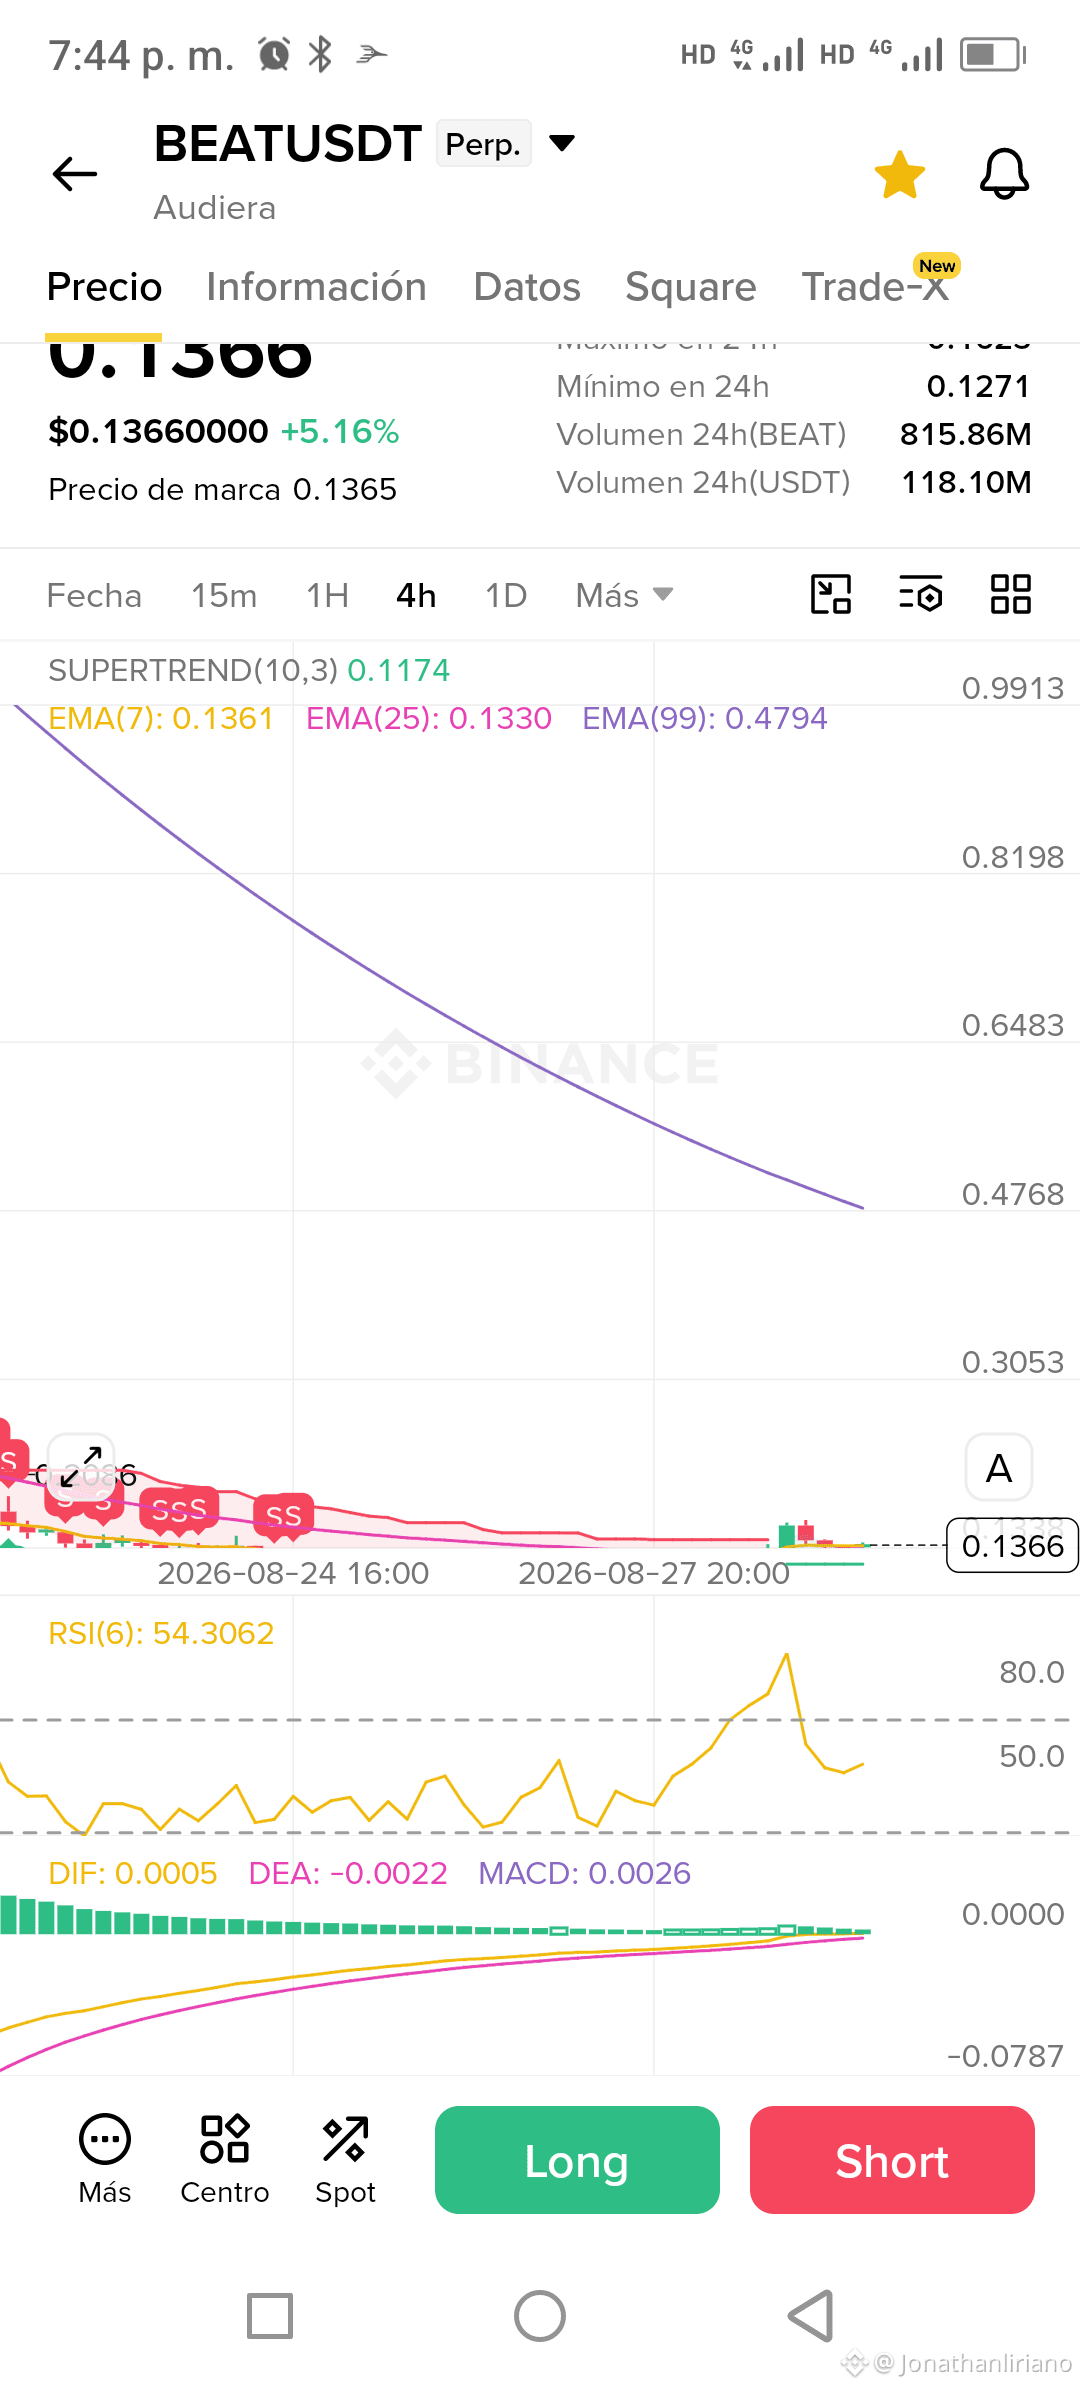
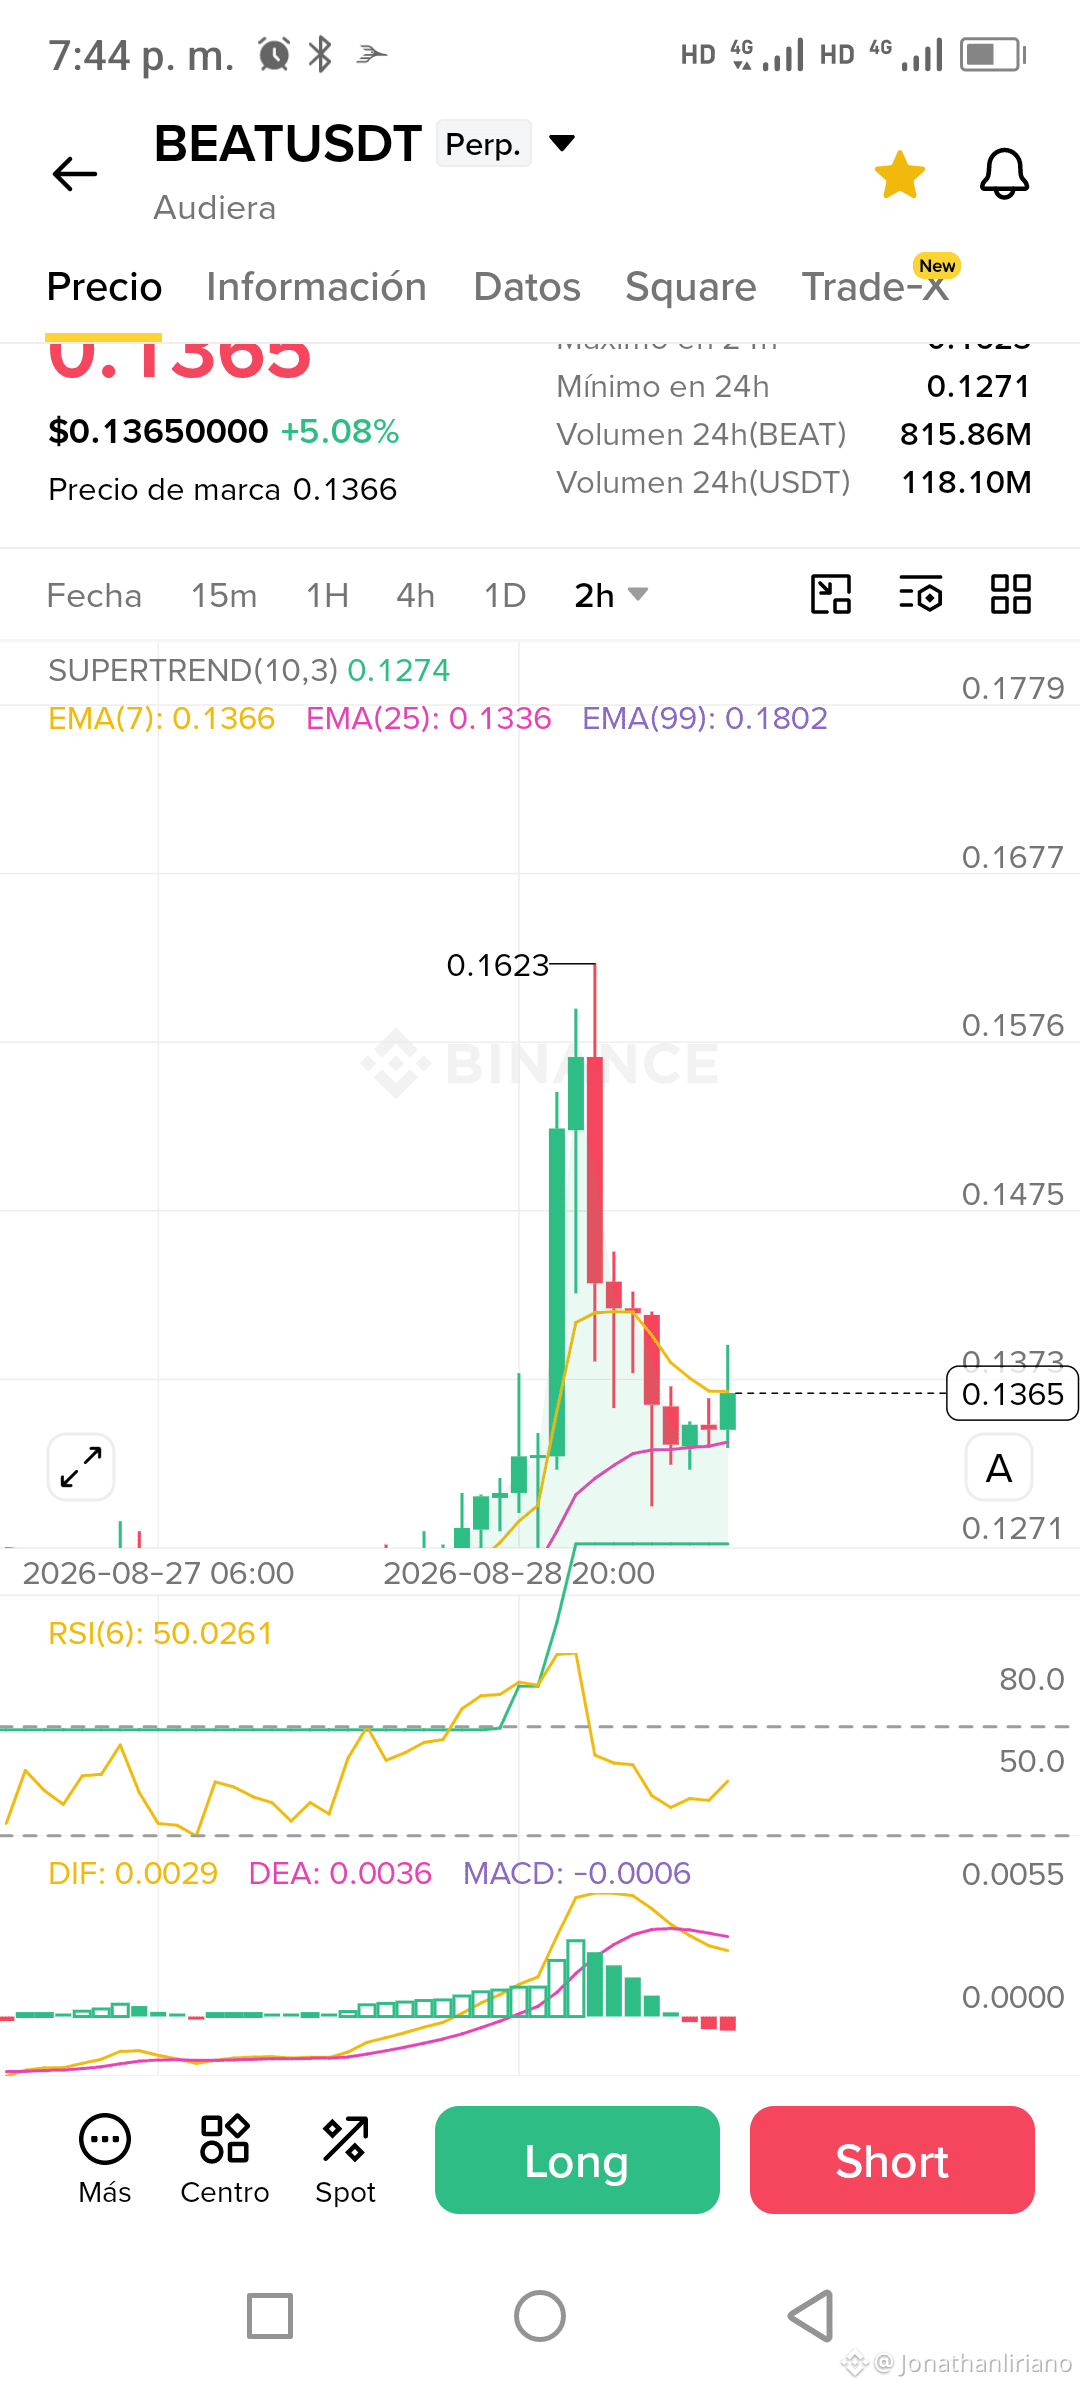
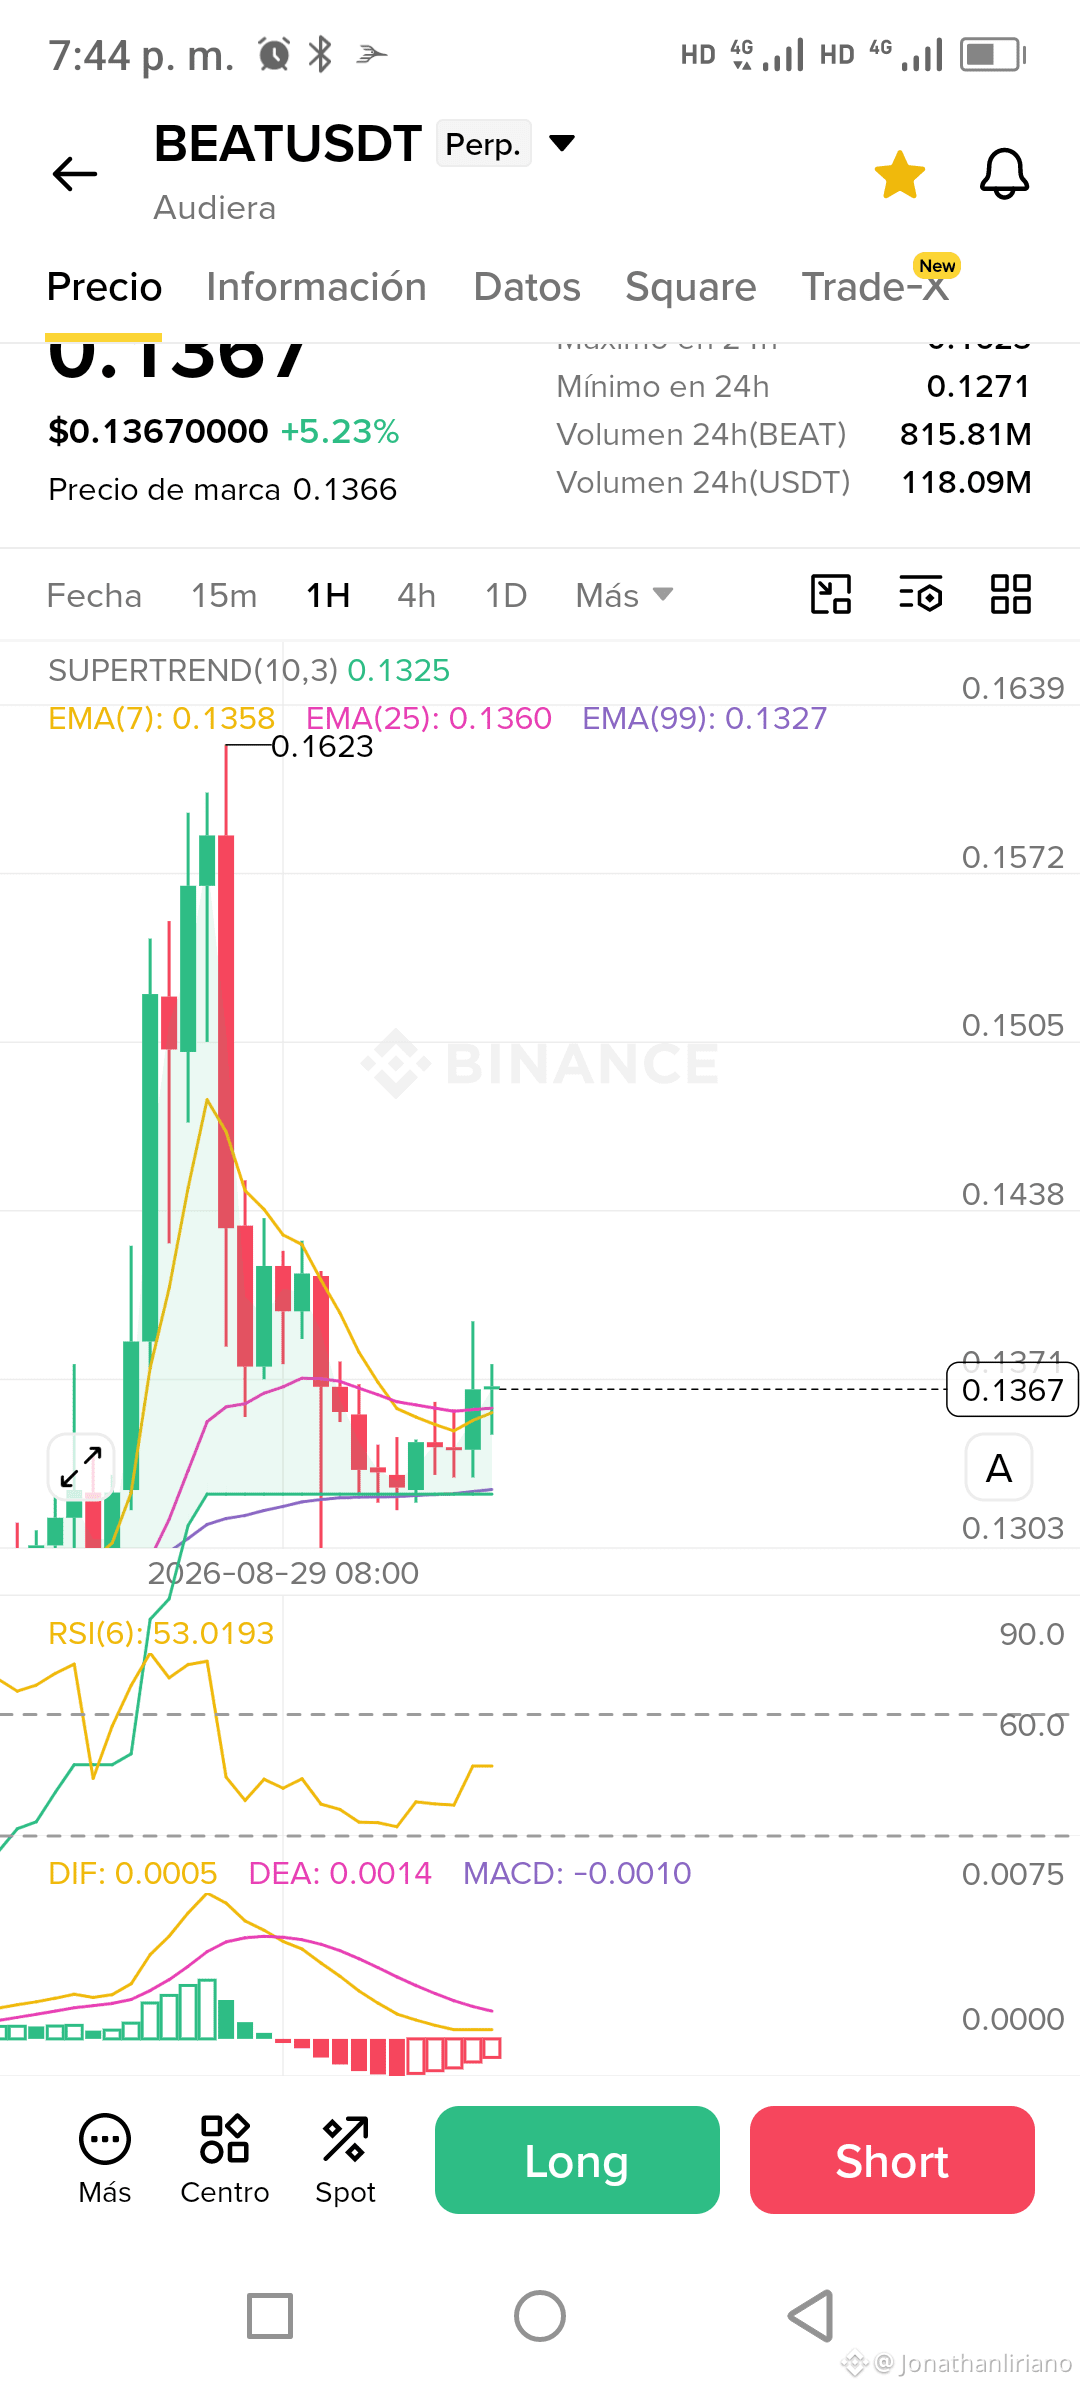
#Hello community let's stop using 10x leverage, let's use 3x, 2x and 4x; if not, it won't go up, it will continue to accumulate, thanks#beat #BTC #ETH🔥🔥🔥🔥🔥🔥 $BEAT $BTC $ETH
🟢 Signal of #AKE $AKE $BTC $ETH
Address: BUY NOW
Entry: 0.008273
Target (TP): 0.010000
Stop Loss (SL): 0.008000
Confidence: 60%
Educational analysis:
1) Asset/Timeframe: AKEUSDT on the daily chart (1D).
2) Key technical patterns:
- There is a clear upward trend from the lows on the chart.
- Price has rejected a recent support zone around 0.007661 (EMA 25) and shows bounce actions.
- The most recent candles have long lower wicks, indicating rejection of lower levels.
3) Indicator readings:
- The Supertrend is below the price, suggesting an uptrend.
- The RSI is around 48, relatively neutral but with room to turn upward.
- EMA(7) is above EMA(25), indicating a recent bullish crossover.
- The MACD shows a slight negative divergence, suggesting caution.
Address: BUY NOW
Entry: 0.008273
Target (TP): 0.010000
Stop Loss (SL): 0.008000
Confidence: 60%
Educational analysis:
1) Asset/Timeframe: AKEUSDT on the daily chart (1D).
2) Key technical patterns:
- There is a clear upward trend from the lows on the chart.
- Price has rejected a recent support zone around 0.007661 (EMA 25) and shows bounce actions.
- The most recent candles have long lower wicks, indicating rejection of lower levels.
3) Indicator readings:
- The Supertrend is below the price, suggesting an uptrend.
- The RSI is around 48, relatively neutral but with room to turn upward.
- EMA(7) is above EMA(25), indicating a recent bullish crossover.
- The MACD shows a slight negative divergence, suggesting caution.
🟢 Signal of #beat $BEAT $BTC $ETH
Address: BUY NOW
Entry: 0.1336
Target (TP): 0.1623
Protection (SL): 0.1229
Confidence: 100%
Address: BUY NOW
Entry: 0.1336
Target (TP): 0.1623
Protection (SL): 0.1229
Confidence: 100%
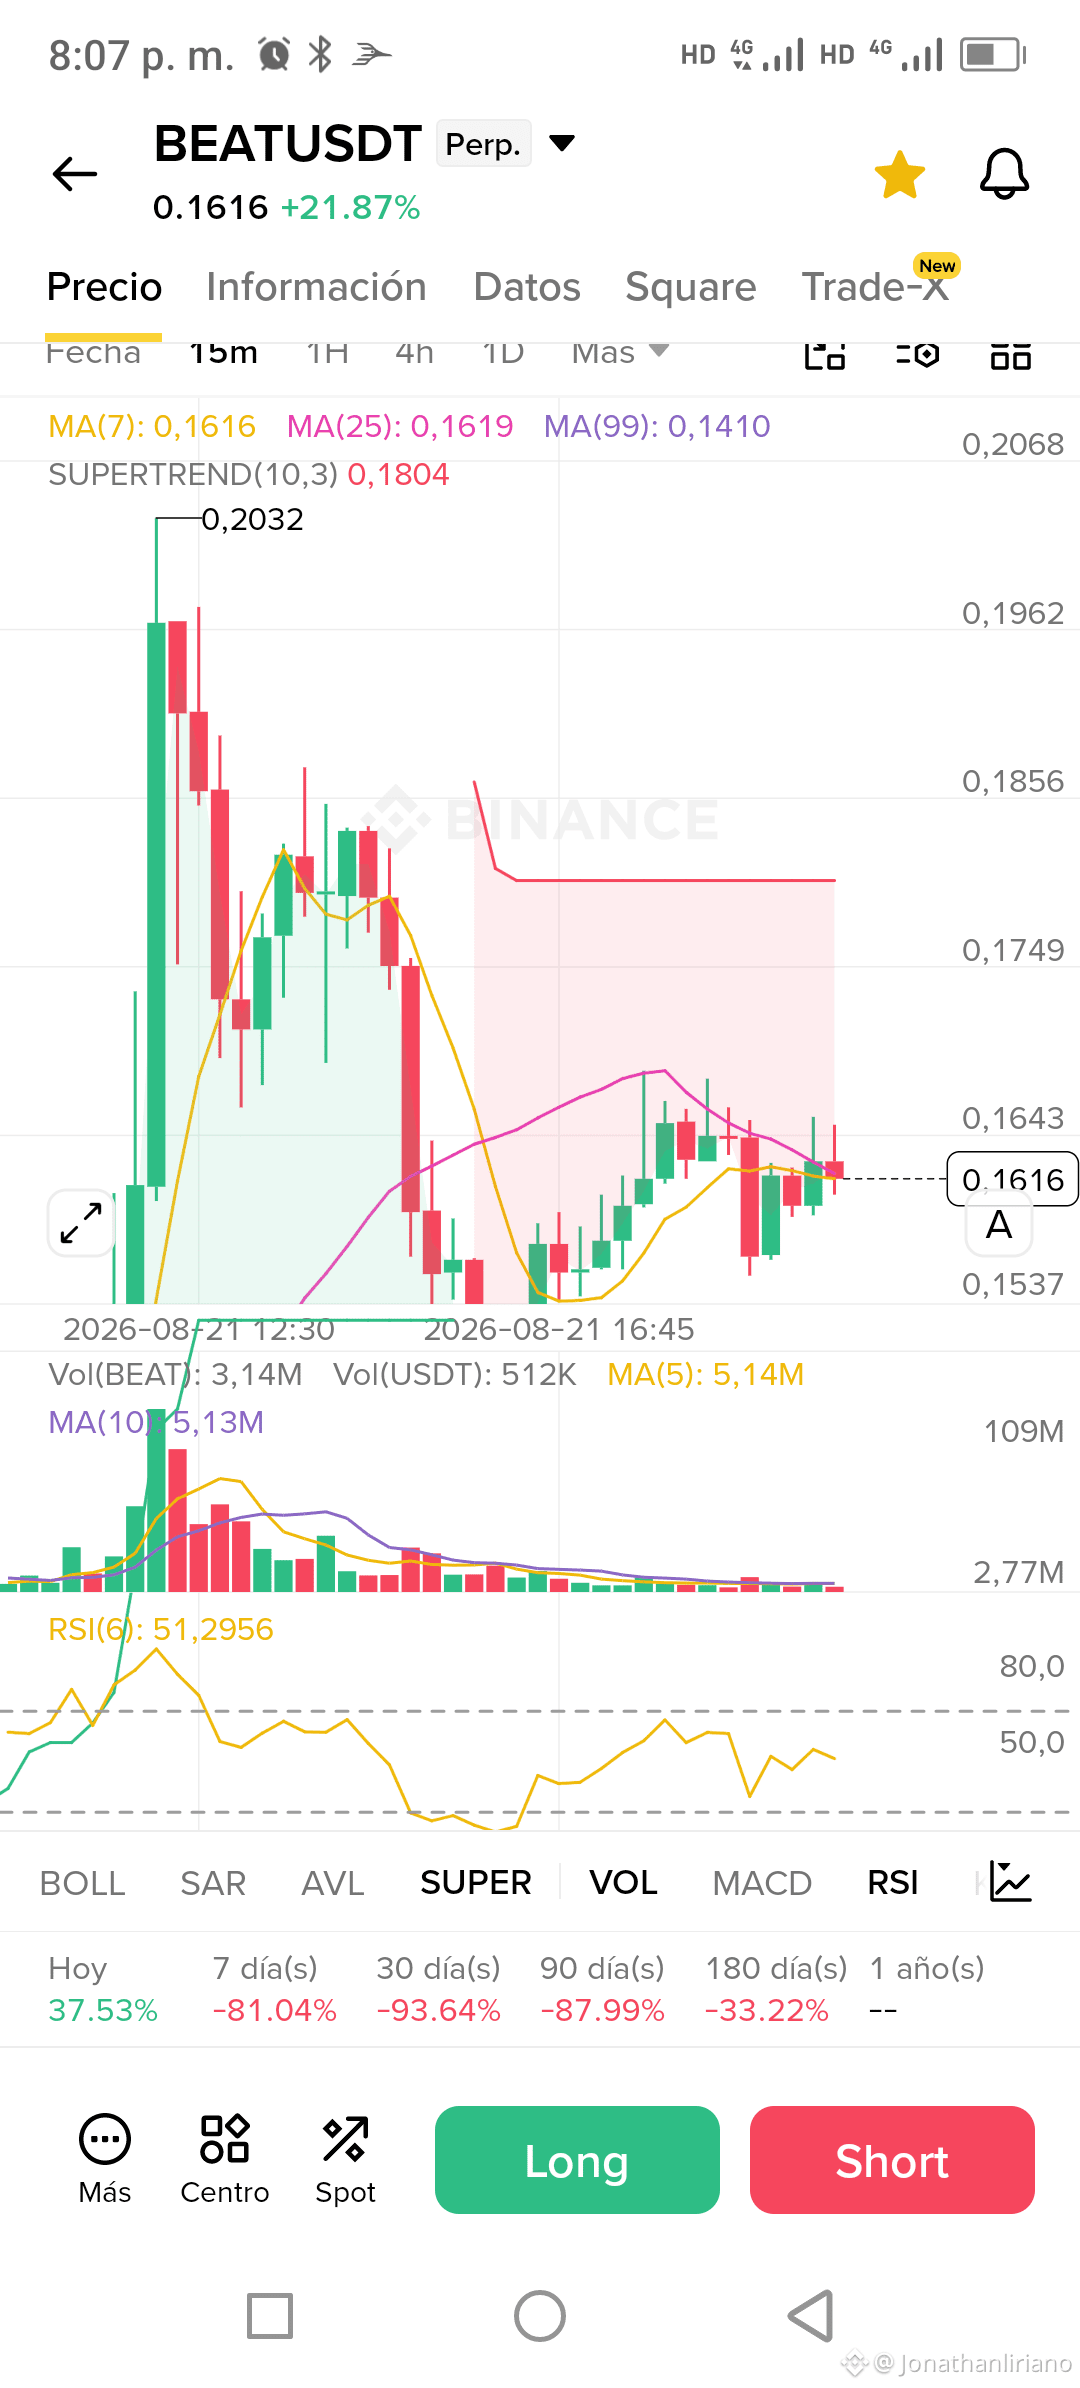
🟢 Signal of #beat $BEAT
$BEAT
Address: BUY NOW
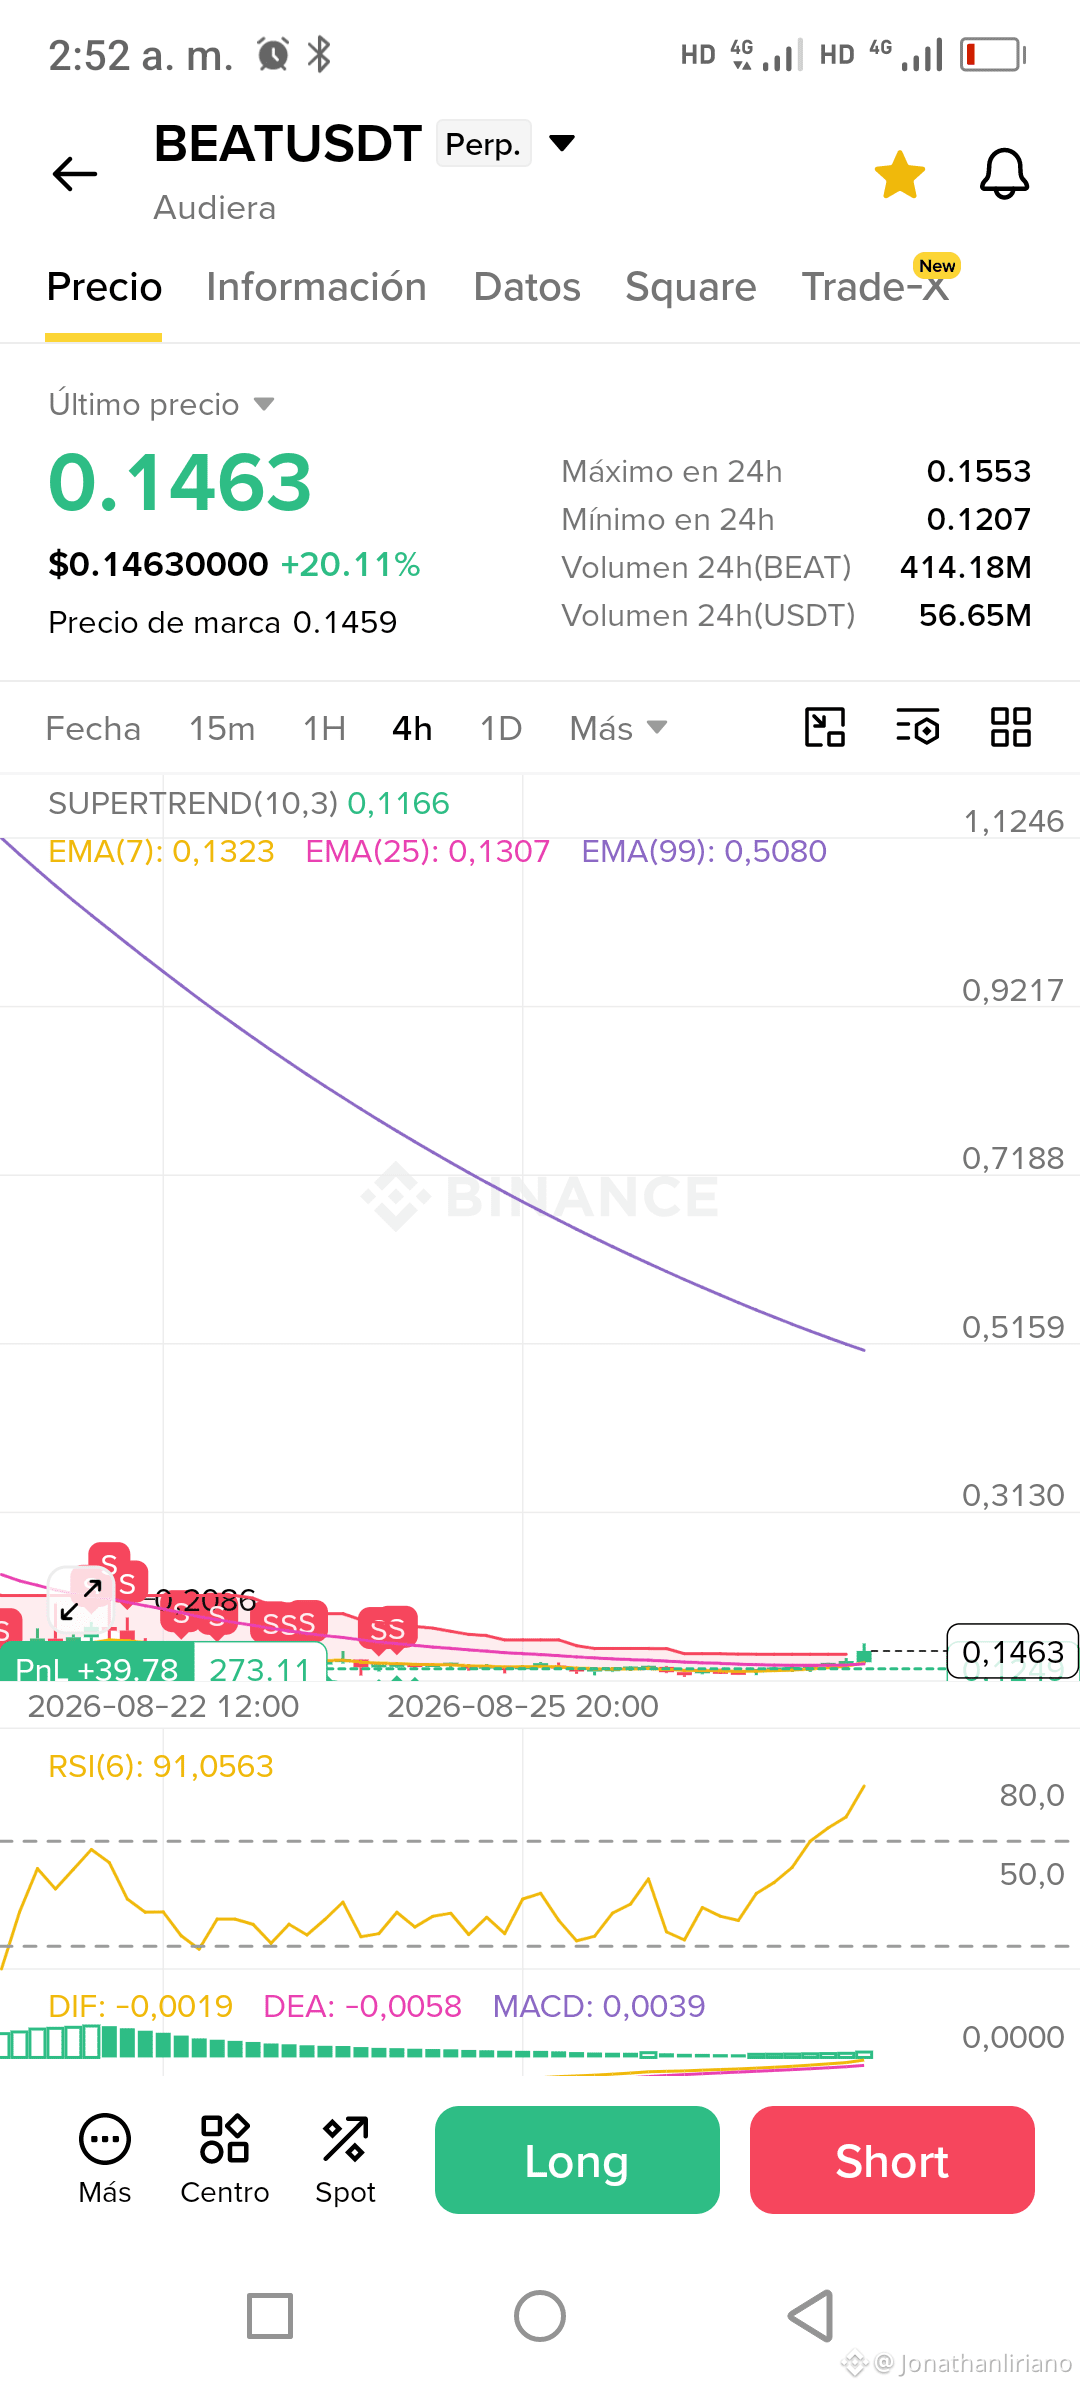
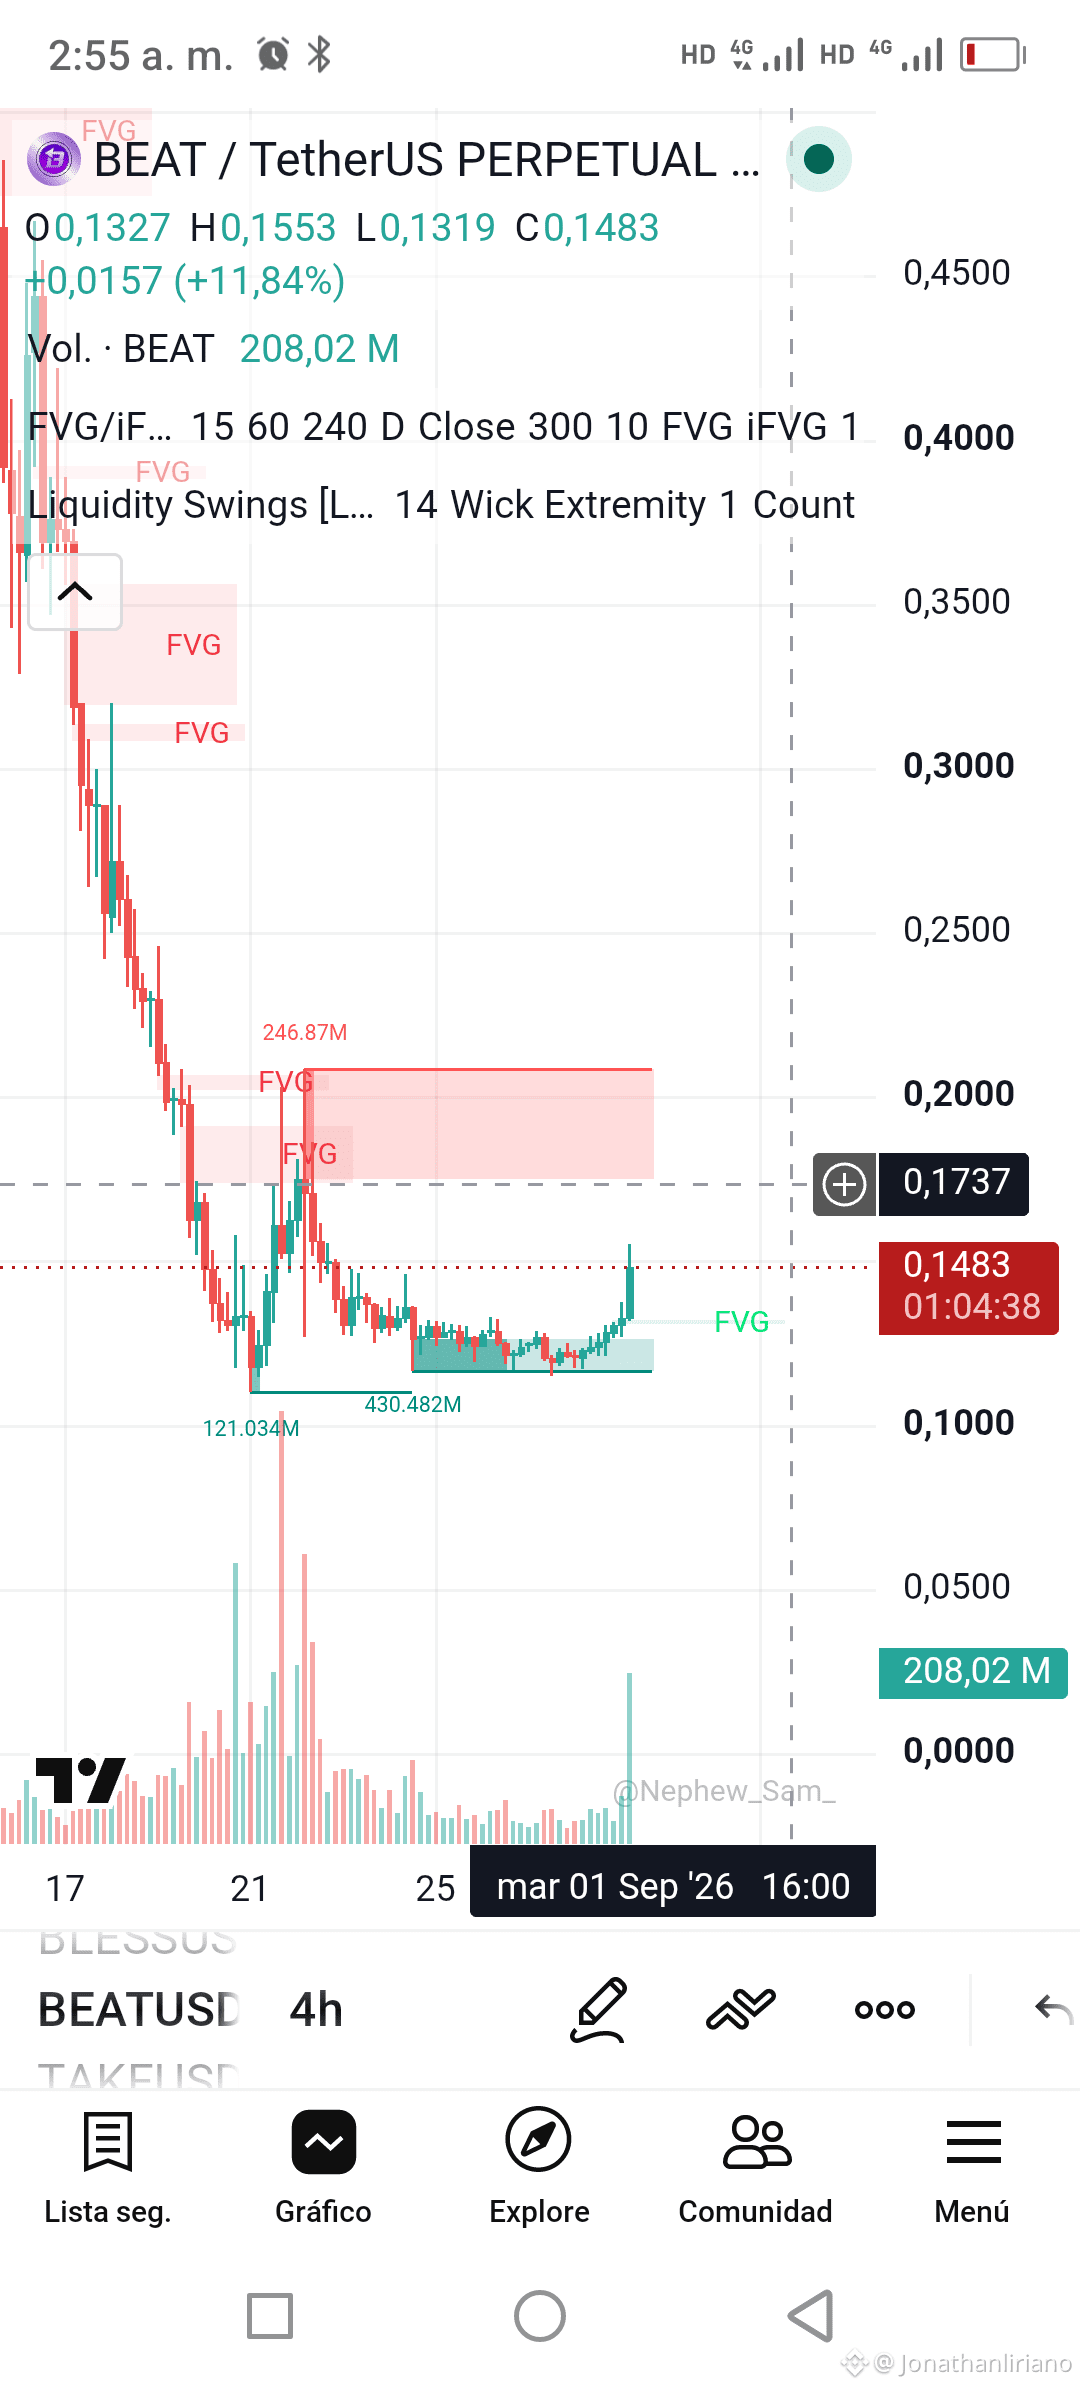
Entry: 0.1463
Target (TP): 0.1550
Protection (SL): 0.1400
Confidence: 60%
1) **Asset/Timeframe**: BEATUSDT on a 4-hour chart.
2) **Key technical patterns**: The chart shows a significant rebound with a 20.11% increase in price. There are no specific visible candles, but the recent rise suggests buying pressure.
3) **Indicator readings**:
- The 7-period EMA is at 0.1323, crossing above the 25-period EMA at 0.1307, suggesting a bullish short-term trend.
- The RSI is at 91.05, indicating overbought conditions.
- The MACD appears to have crossed upward, signaling positive momentum.
4) **Educational takeaways**:
- The EMAs crossing and the high RSI indicate strong upside momentum, but they also warn of possible overbought.
- It’s always good to set a Take Profit and Stop Loss to manage risk properly.
$BEAT
Address: BUY NOW
Entry: 0.1463
Target (TP): 0.1550
Protection (SL): 0.1400
Confidence: 60%
1) **Asset/Timeframe**: BEATUSDT on a 4-hour chart.
2) **Key technical patterns**: The chart shows a significant rebound with a 20.11% increase in price. There are no specific visible candles, but the recent rise suggests buying pressure.
3) **Indicator readings**:
- The 7-period EMA is at 0.1323, crossing above the 25-period EMA at 0.1307, suggesting a bullish short-term trend.
- The RSI is at 91.05, indicating overbought conditions.
- The MACD appears to have crossed upward, signaling positive momentum.
4) **Educational takeaways**:
- The EMAs crossing and the high RSI indicate strong upside momentum, but they also warn of possible overbought.
- It’s always good to set a Take Profit and Stop Loss to manage risk properly.

🟢 Signal of #beat $BEAT
Address: BUY NOW
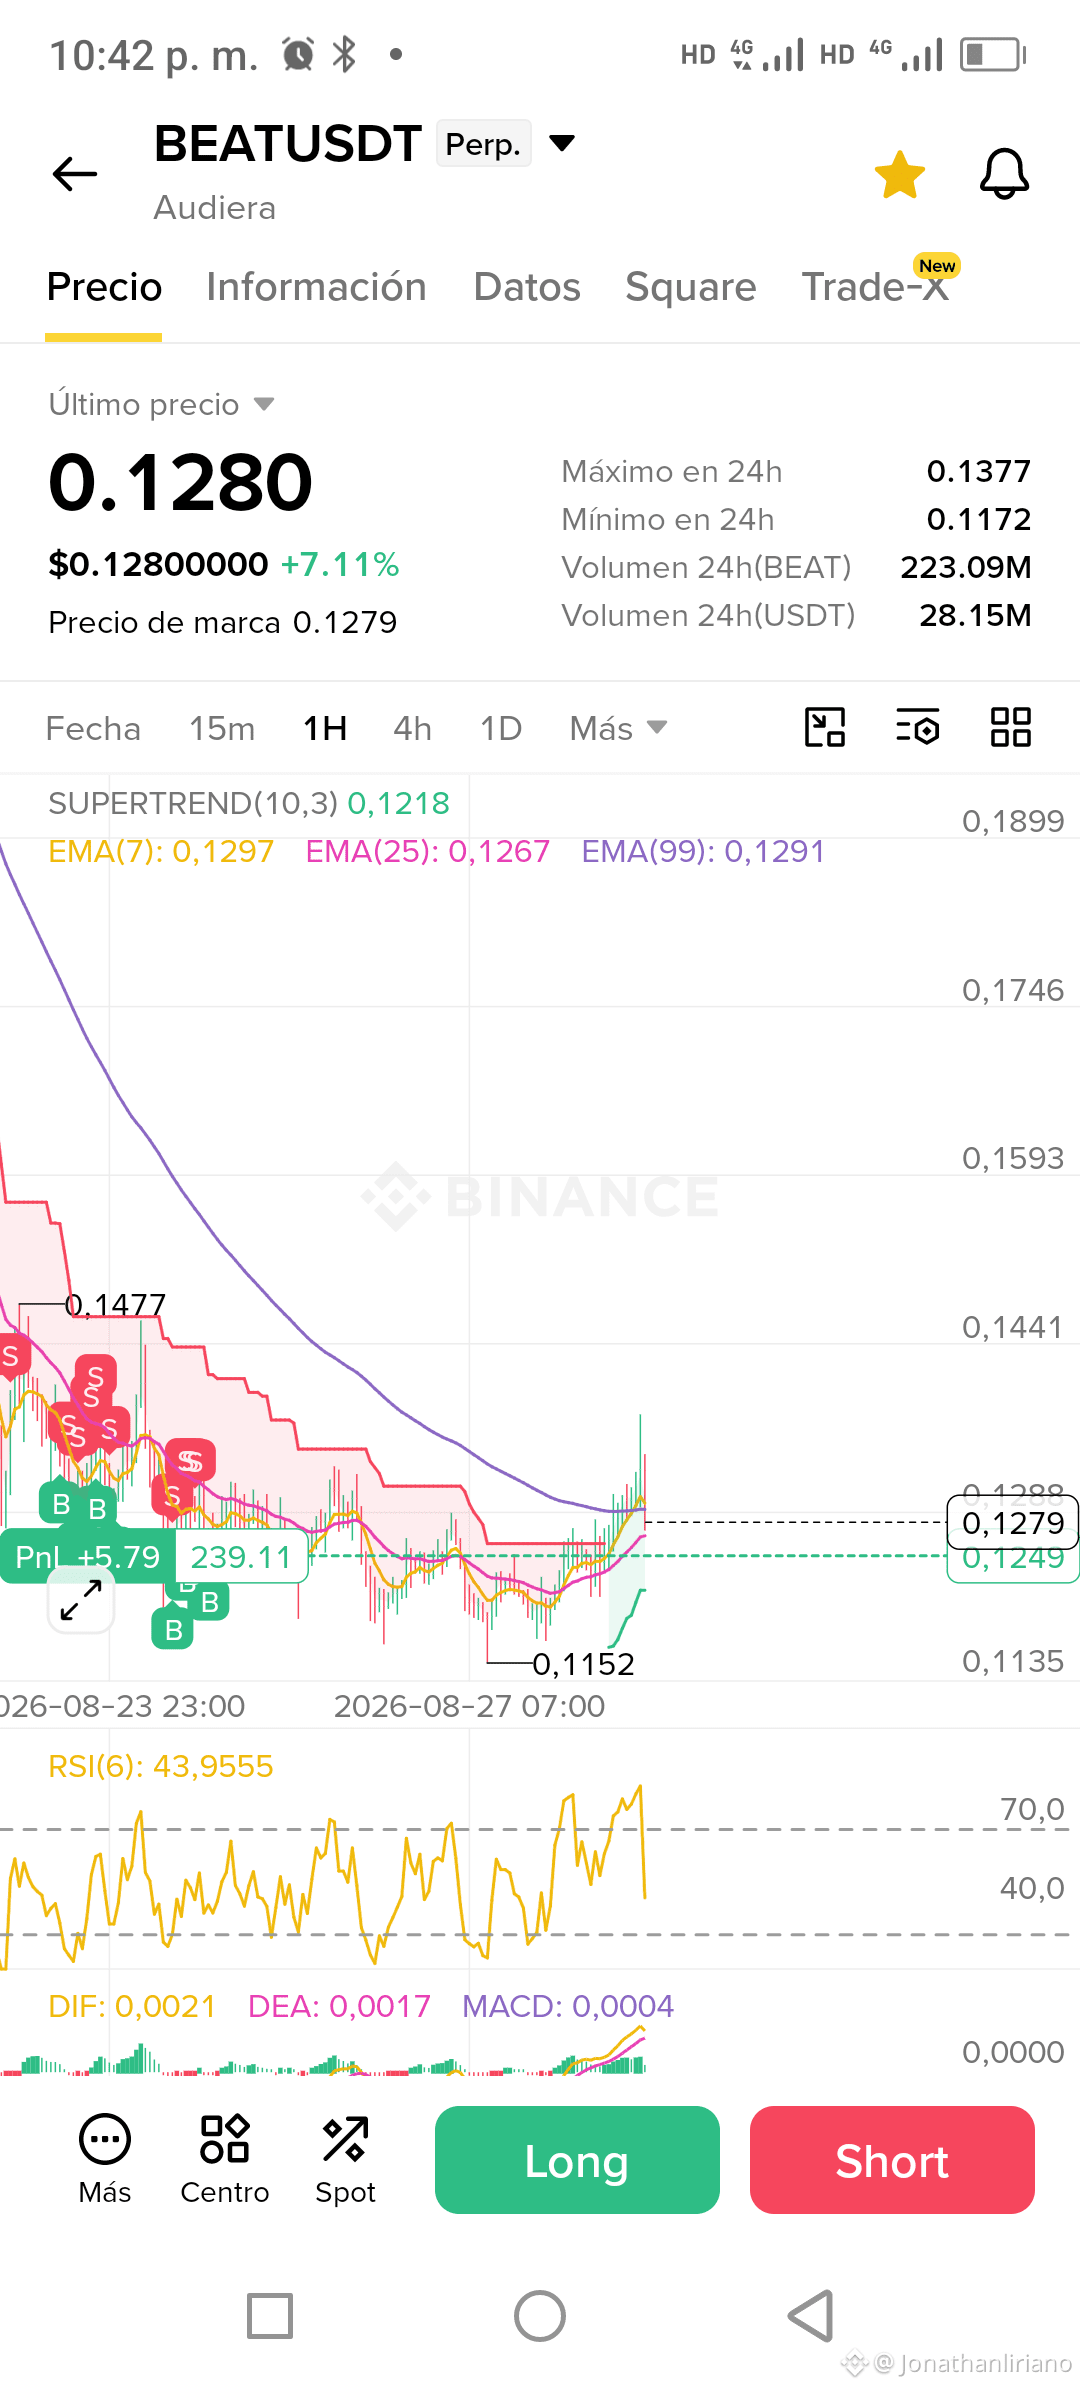
Entry: 0.1280
Target (TP): 0.1377
Protection (SL): 0.1172
Confidence: 62%
Educational Analysis:
1) Asset/Timeframe: BEATUSDT 1H
2) Key technical patterns:
- A recent bullish trend is observed after a period of decline.
- Support formed around 0.1152, serving as the foundation for the upward move.
3) Indicator readings:
- EMA (7, 25, 99) shows an upward crossover, indicating a possible trend change.
- The RSI is at 43.9555, suggesting there is room for an upward move before entering overbought.
- MACD shows a bullish signal
Address: BUY NOW
Entry: 0.1280
Target (TP): 0.1377
Protection (SL): 0.1172
Confidence: 62%
Educational Analysis:
1) Asset/Timeframe: BEATUSDT 1H
2) Key technical patterns:
- A recent bullish trend is observed after a period of decline.
- Support formed around 0.1152, serving as the foundation for the upward move.
3) Indicator readings:
- EMA (7, 25, 99) shows an upward crossover, indicating a possible trend change.
- The RSI is at 43.9555, suggesting there is room for an upward move before entering overbought.
- MACD shows a bullish signal
🟢 Signal for #beat
Address: BUY NOW
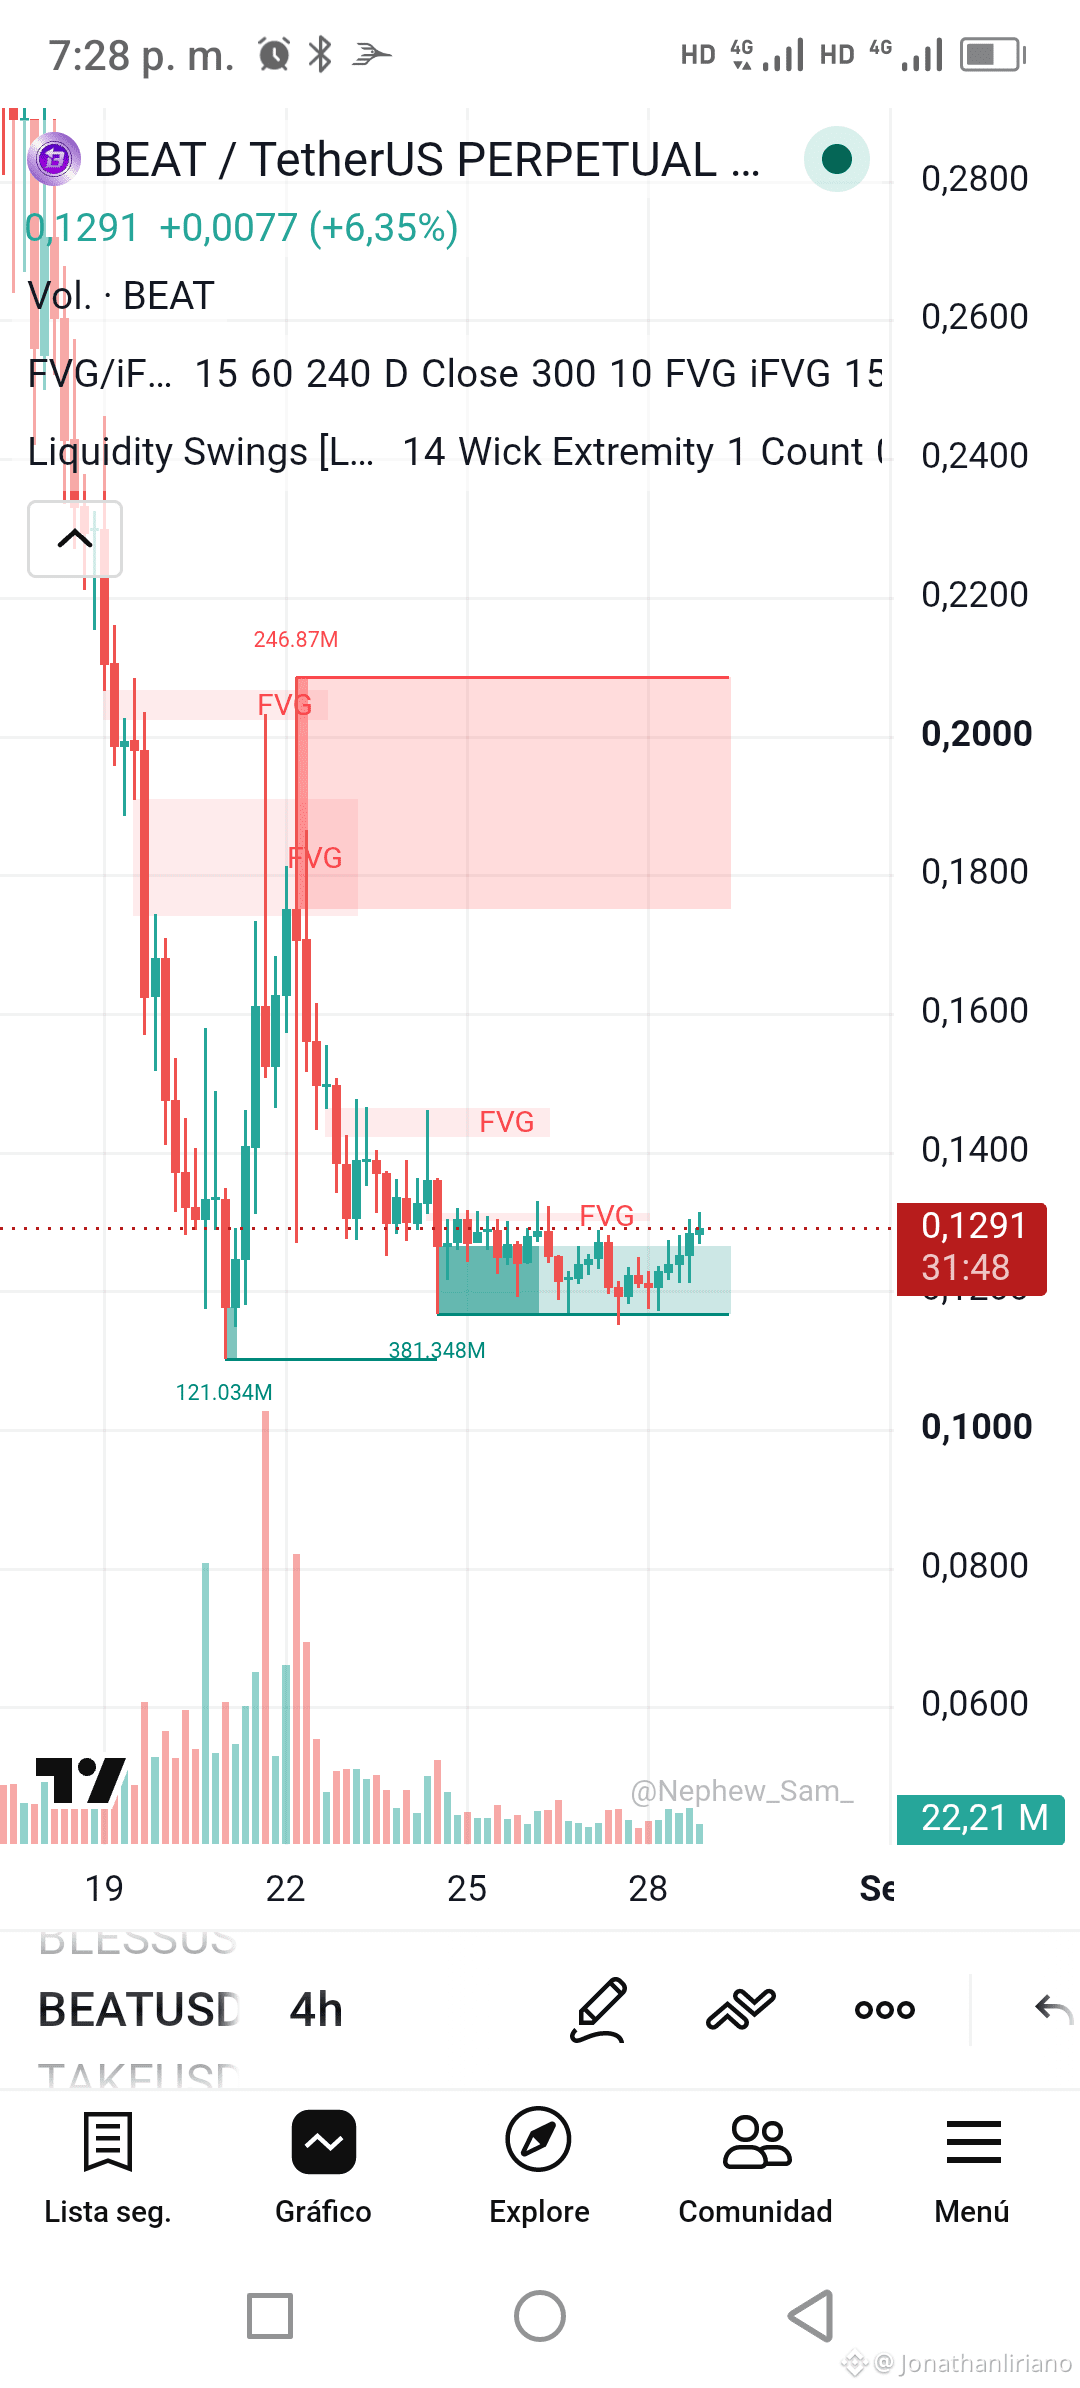
Entry: 0.1291
Target (TP): 0.1400
Protection (SL): 0.1200
Confidence: 100%💪💹
$BEAT $LAB $SOL
Address: BUY NOW
Entry: 0.1291
Target (TP): 0.1400
Protection (SL): 0.1200
Confidence: 100%💪💹
$BEAT $LAB $SOL
🔴 Signal for #beat
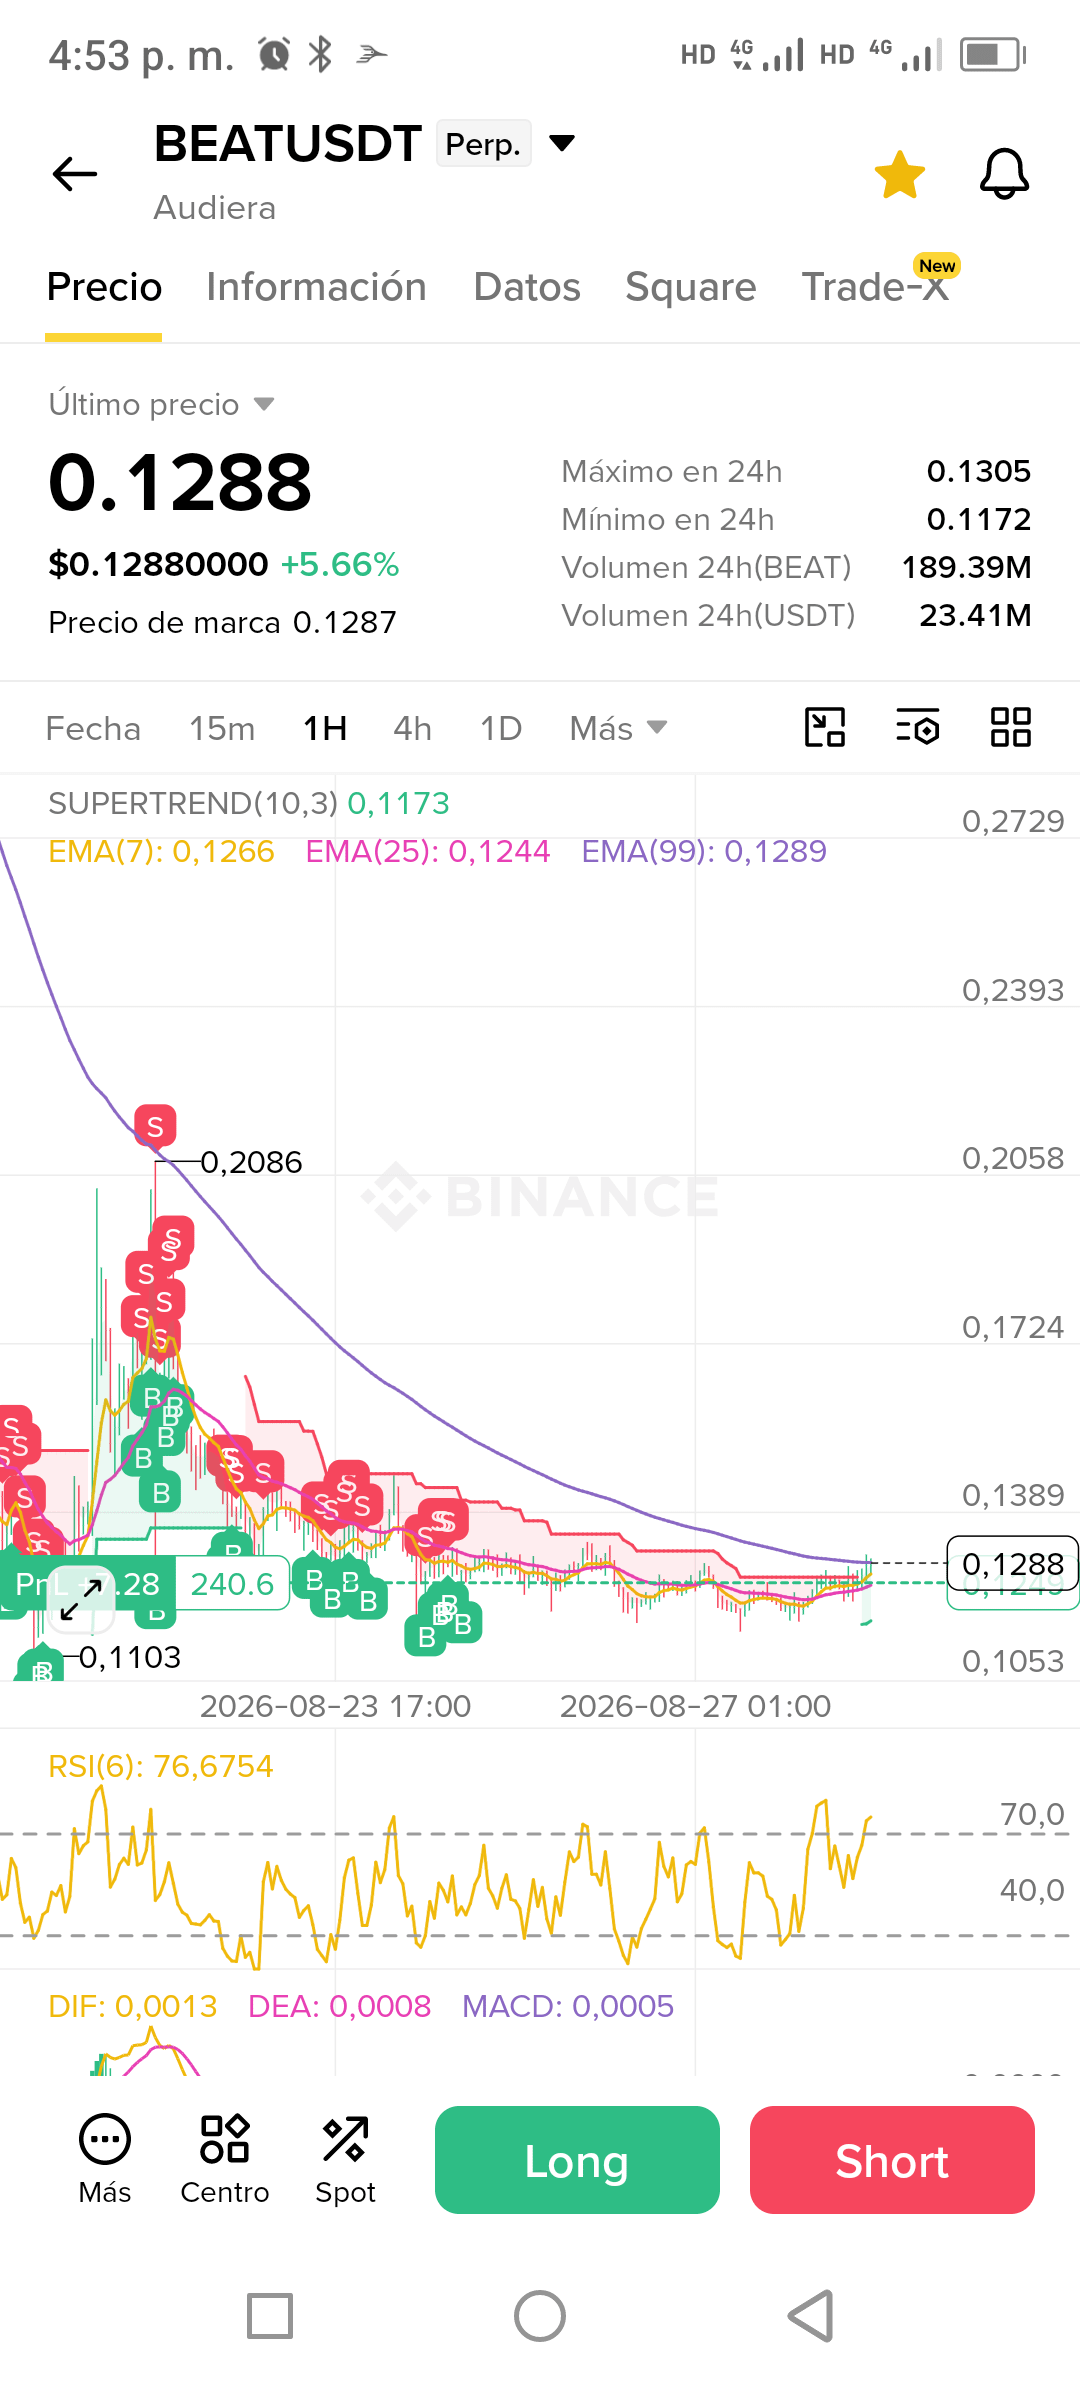
Address: BUY NOW
Entry: 0.1288
Target (TP): 0.1170
Protection (SL): 0.1305
1) Asset/timeframe: BEATUSDT, 1-hour chart.
2) Key technical patterns:
- The chart shows a prior decline with multiple sell signals (S) and some buy signals (B).
- The price seems to be in a consolidation zone after a significant drop.
- The price has been rejecting levels around 0.1305, suggesting resistance.
3) Indicator readings:
- RSI(6) is at 76.6754, indicating overbought conditions, which potentially supports a sell strategy.
- The exponential moving averages (EMA) of different periods show a slightly bearish bias, especially the EMA of 7 and 25, which are below the current price.
- Supertrend also shows a line indicating resistance from above.
Address: BUY NOW
Entry: 0.1288
Target (TP): 0.1170
Protection (SL): 0.1305
1) Asset/timeframe: BEATUSDT, 1-hour chart.
2) Key technical patterns:
- The chart shows a prior decline with multiple sell signals (S) and some buy signals (B).
- The price seems to be in a consolidation zone after a significant drop.
- The price has been rejecting levels around 0.1305, suggesting resistance.
3) Indicator readings:
- RSI(6) is at 76.6754, indicating overbought conditions, which potentially supports a sell strategy.
- The exponential moving averages (EMA) of different periods show a slightly bearish bias, especially the EMA of 7 and 25, which are below the current price.
- Supertrend also shows a line indicating resistance from above.
🟢 Signal of #beat
Address: BUY NOW
Entry: 0.1294
Target (TP): 0.1600
Protection (SL): 0.1100
Confidence: 💯
let's go with the whole community
Address: BUY NOW
Entry: 0.1294
Target (TP): 0.1600
Protection (SL): 0.1100
Confidence: 💯
let's go with the whole community
🔴 Signal #beat $BEAT
Direction: SELL NOW
Entry: 0.1270
Target (TP): 0.1100
Stop Loss (SL): 0.1300
Confidence: 60%
Educational analysis:
1) Asset/timeframe: The image shows the BEATUSDT chart in a 4-hour period.
2) Key technical patterns: The chart shows a persistent bearish trend. There are several long red candles, indicating solid selling pressure. No clear reversal patterns are observed in this time period.
3) Indicator readings:
- Moving Averages: The short-term EMA (7 periods) is below those of 25 and 99 periods, confirming a bearish trend.
- Supertrend marks a current resistance level at 0.1423, supporting the sell direction.
- RSI at 65.6, close to the overbought level, indicating possible buyer exhaustion.
4) Educational lessons:
- In a “Dynamic Zones” strategy, identifying recent highs and lows can help establish support and resistance levels. Here, the price is approaching the recent support of 0.1100, suggesting taking profits near that level.
- Analyzing moving averages and Supertrend can confirm trend directions before making an entry decision.
- It’s important to monitor indicators like RSI to detect potential overbought or oversold conditions, which can anticipate reversals in the trend.
Direction: SELL NOW
Entry: 0.1270
Target (TP): 0.1100
Stop Loss (SL): 0.1300
Confidence: 60%
Educational analysis:
1) Asset/timeframe: The image shows the BEATUSDT chart in a 4-hour period.
2) Key technical patterns: The chart shows a persistent bearish trend. There are several long red candles, indicating solid selling pressure. No clear reversal patterns are observed in this time period.
3) Indicator readings:
- Moving Averages: The short-term EMA (7 periods) is below those of 25 and 99 periods, confirming a bearish trend.
- Supertrend marks a current resistance level at 0.1423, supporting the sell direction.
- RSI at 65.6, close to the overbought level, indicating possible buyer exhaustion.
4) Educational lessons:
- In a “Dynamic Zones” strategy, identifying recent highs and lows can help establish support and resistance levels. Here, the price is approaching the recent support of 0.1100, suggesting taking profits near that level.
- Analyzing moving averages and Supertrend can confirm trend directions before making an entry decision.
- It’s important to monitor indicators like RSI to detect potential overbought or oversold conditions, which can anticipate reversals in the trend.
stay alert the market 💹 in the early hours of today, a 50% move—we’re going to 0.50, 1.50, 2.50 #Beat
we need to buy, we need to buy so that the market gains momentum and we can break the 0.20; we break 0.20 and we’re going to $5; let’s go, community, let’s save those who are trapped up here #beat $BEAT
keep your tokens for no reason and under no circumstances sell them; that's what the market wants. they have to keep their touch up to date#beat $BEAT
Three days are missing; in those three days, the market has to rise 200% so that the new tokens can be purchased at an estimated value of $4. #beat Buy, it will reach $5
🟡 Signal #BEATS 🚧
Address: WAIT
Entry: 0.1220
Confidence: 50%
Educational analysis:
1) Asset/Timeframe: BEATUSDT on a 15-minute timeframe.
2) Key technical patterns:
- The price has shown a recent low at 0.1152 and a high at 0.1288, forming extreme support and resistance zones.
- The recent trend appears to be trying to reverse downwards and then upwards cautiously, with no clear direction defined.
3) Indicator readings:
- The exponential moving averages (EMAs) show slight convergence around the current price, indicating possible indecision.
- Supertrend at 0.1179, suggesting a low resurgence within the recent bearish trend.
- RSI at 55.73, indicating neutral momentum—not in overbought or oversold.
- MACD near zero, showing little momentum strength.
4) Educational takeaways:
- It’s important to identify extreme support and resistance zones to evaluate possible reversal or exhaustion points.
Address: WAIT
Entry: 0.1220
Confidence: 50%
Educational analysis:
1) Asset/Timeframe: BEATUSDT on a 15-minute timeframe.
2) Key technical patterns:
- The price has shown a recent low at 0.1152 and a high at 0.1288, forming extreme support and resistance zones.
- The recent trend appears to be trying to reverse downwards and then upwards cautiously, with no clear direction defined.
3) Indicator readings:
- The exponential moving averages (EMAs) show slight convergence around the current price, indicating possible indecision.
- Supertrend at 0.1179, suggesting a low resurgence within the recent bearish trend.
- RSI at 55.73, indicating neutral momentum—not in overbought or oversold.
- MACD near zero, showing little momentum strength.
4) Educational takeaways:
- It’s important to identify extreme support and resistance zones to evaluate possible reversal or exhaustion points.
🟢 Signal #beat $BEAT
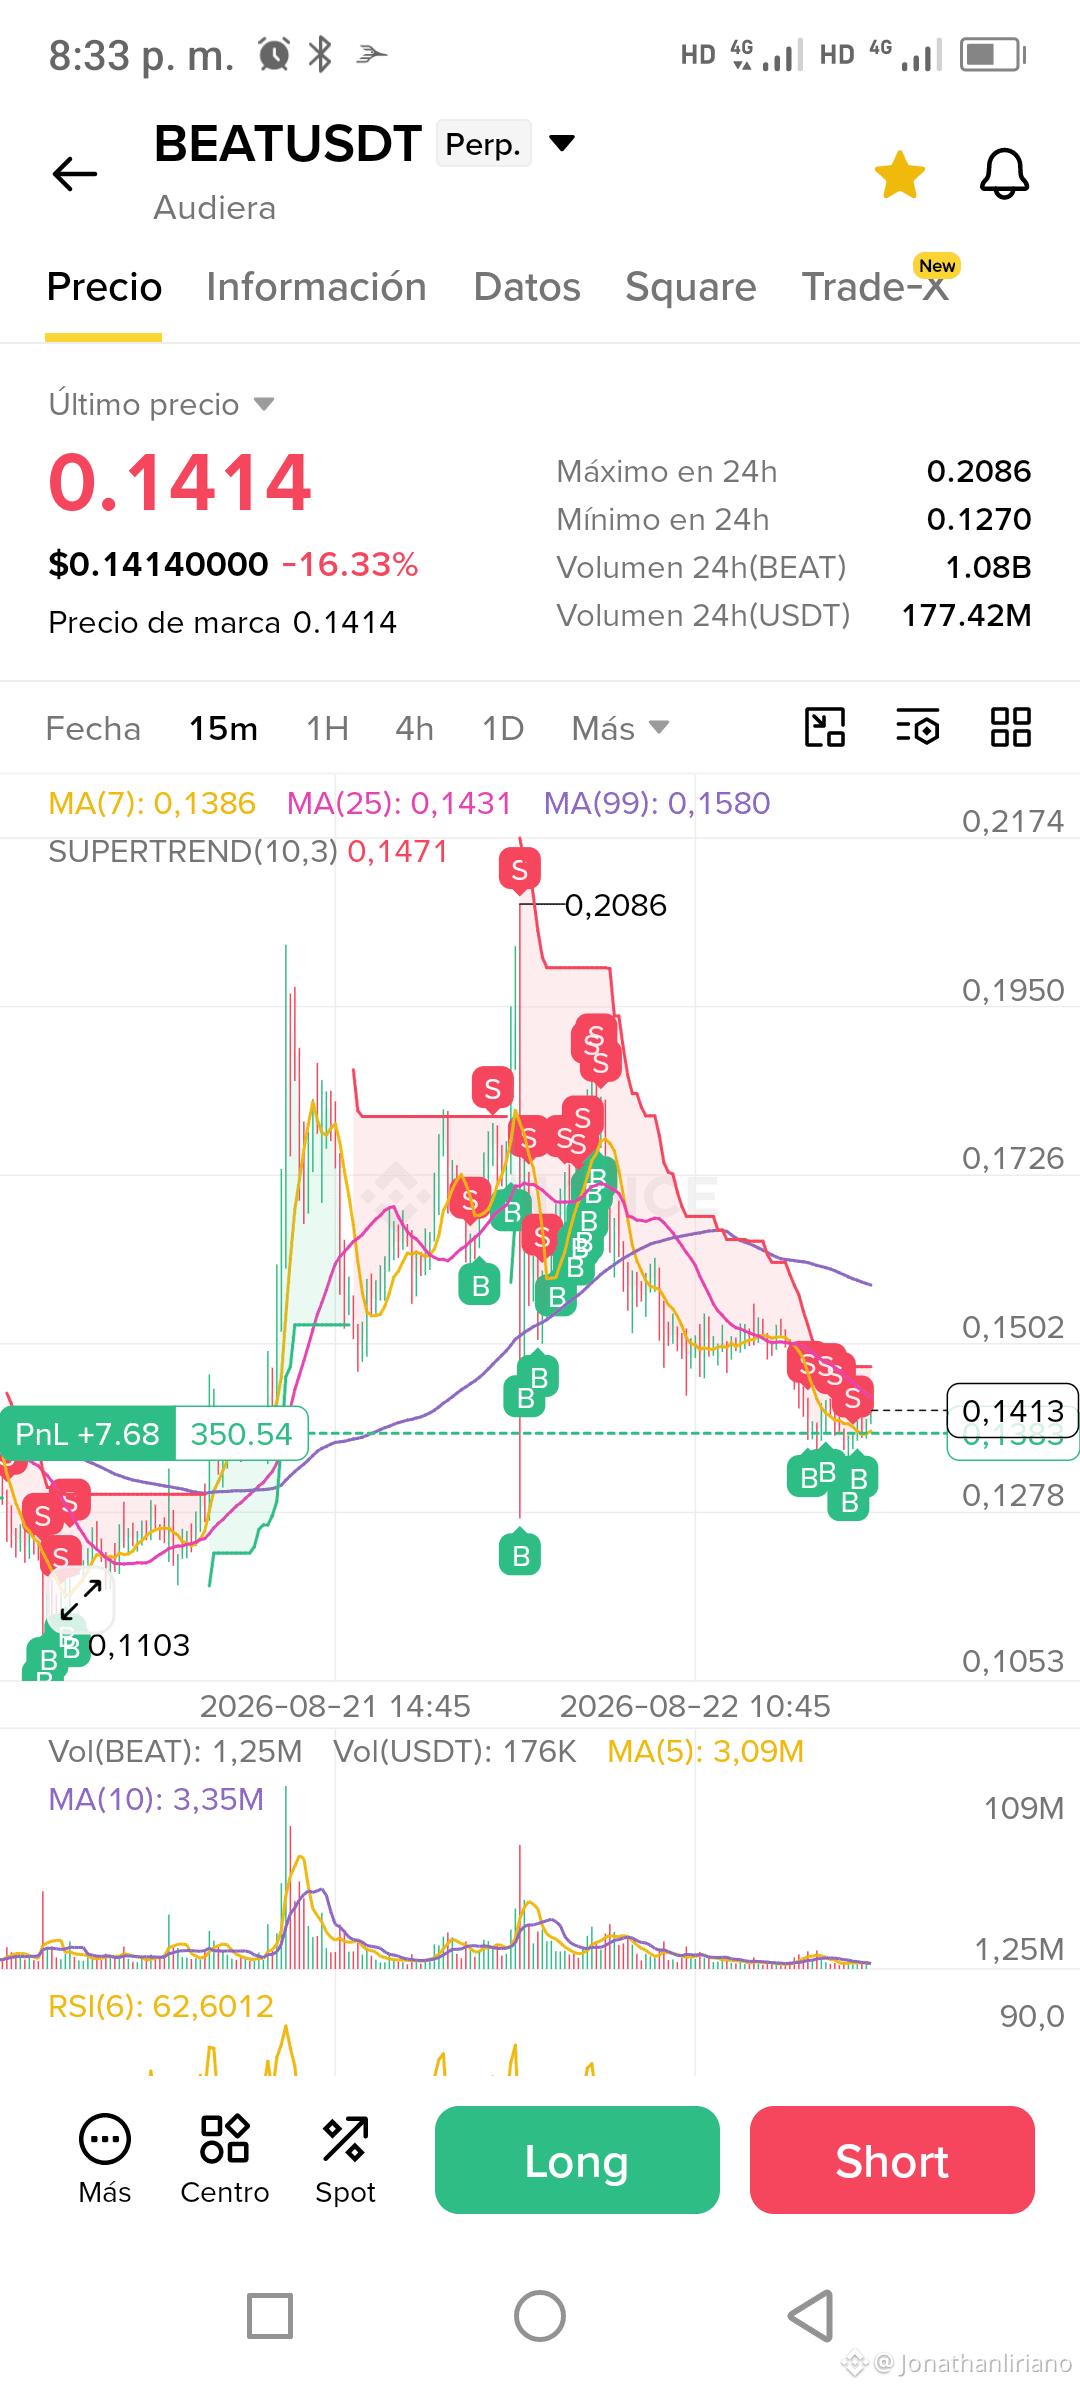
Address: BUY NOW
Entry: 0.1414
Target (TP): 0.1500
Protection (SL): 0.1370
Confidence: 60% (moderate) ██████░░░░
Educational analysis:
1) **Asset/Timeframe**: BEATUSDT, 15 minutes.
2) **Key technical patterns**: The chart shows a recent bearish trend after reaching a high at 0.2086. Currently, the price is near a possible support in the 0.1270 - 0.1414 area, where it could bounce.
3) **Indicator readings**:
- The moving averages (MA) of 7, 25, and 99 periods indicate convergence, which may signal a trend change.
- The Supertrend also reflects a nearby level, which may act as dynamic support.
- The RSI shows a value of 62.60, indicating there is still room before overbought conditions.
4) **Educational takeaways**:
- The convergence of moving averages can indicate a potential trend change.
- Identifying support/resistance zones is crucial for anticipating bounces.
- The RSI is useful for measuring momentum and overbought/oversold conditions.
⚠️ Educational only, not financial advice.
Address: BUY NOW
Entry: 0.1414
Target (TP): 0.1500
Protection (SL): 0.1370
Confidence: 60% (moderate) ██████░░░░
Educational analysis:
1) **Asset/Timeframe**: BEATUSDT, 15 minutes.
2) **Key technical patterns**: The chart shows a recent bearish trend after reaching a high at 0.2086. Currently, the price is near a possible support in the 0.1270 - 0.1414 area, where it could bounce.
3) **Indicator readings**:
- The moving averages (MA) of 7, 25, and 99 periods indicate convergence, which may signal a trend change.
- The Supertrend also reflects a nearby level, which may act as dynamic support.
- The RSI shows a value of 62.60, indicating there is still room before overbought conditions.
4) **Educational takeaways**:
- The convergence of moving averages can indicate a potential trend change.
- Identifying support/resistance zones is crucial for anticipating bounces.
- The RSI is useful for measuring momentum and overbought/oversold conditions.
⚠️ Educational only, not financial advice.
currently the market is stable, it is in an accumulation phase. remember something very important: patience is everything. invest wisely with patience. everyone is looking for a cheaper market. this is the time to buy. don’t miss the moment. stay calm and patient. come on, teammates #BEATS #BTC走势分析 #bitcoin
Log in to explore more content