
Idrees Official
9 Posts

Idrees Official
Report
Block User
Web3 Growth Engine || Driving narratives, TGE campaigns, and market analysis for protocols.
2 Following
5 Followers
16 Liked
Posts
Verified
Article
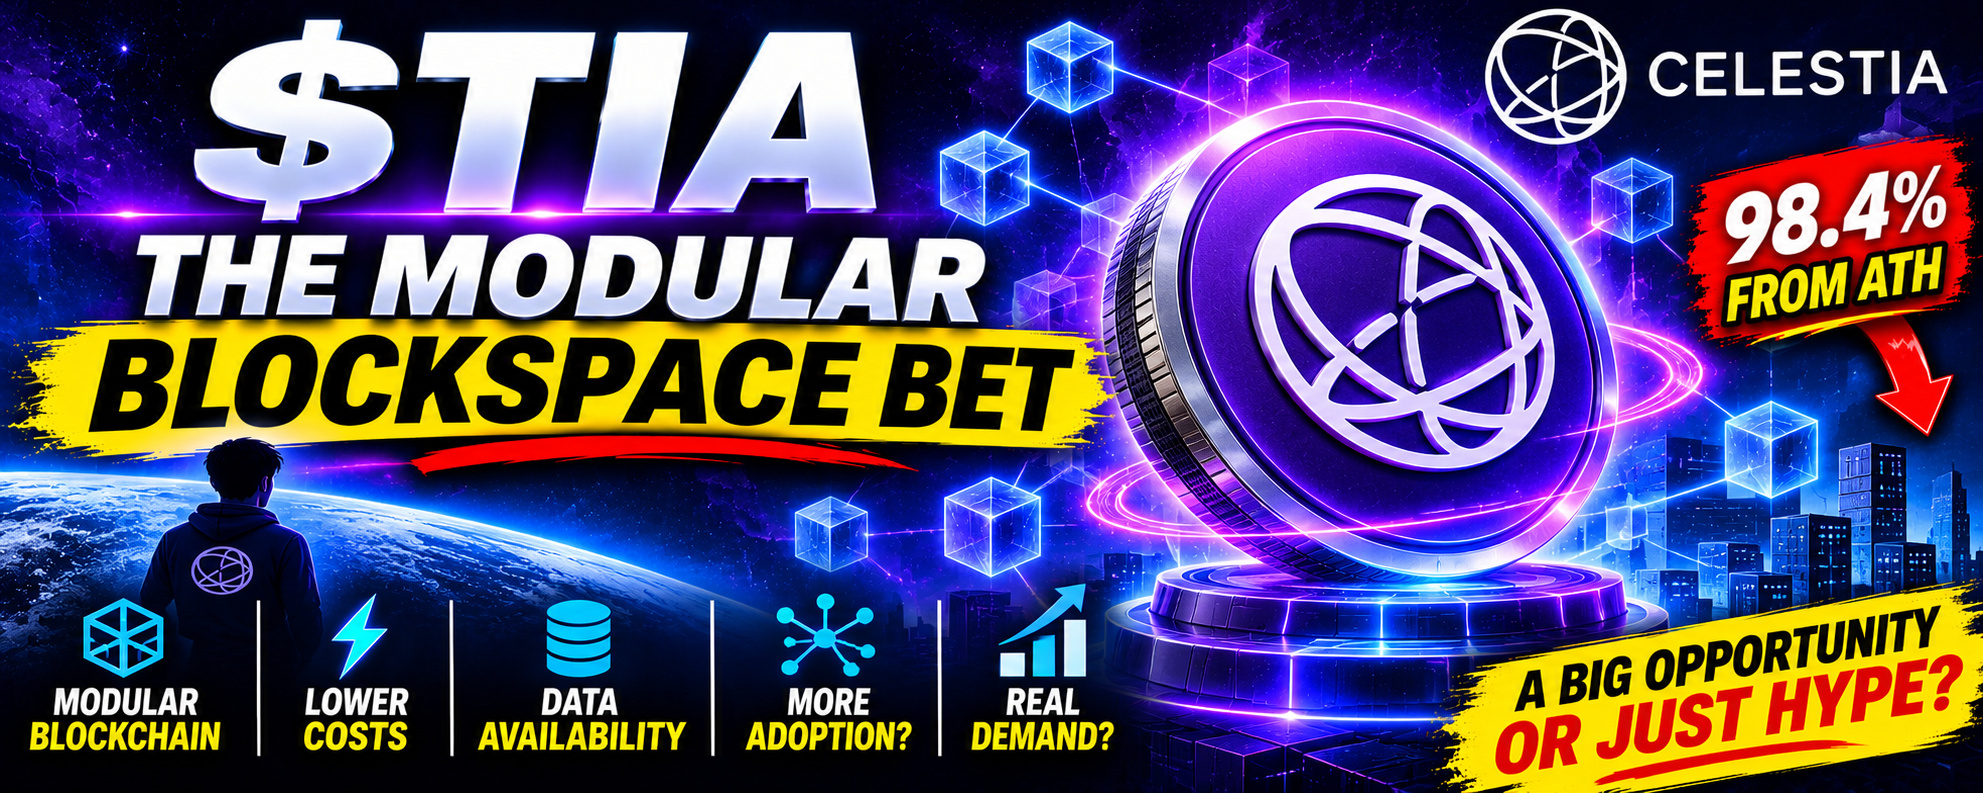
🌚$TIA — THE MODULAR BLOCKSPACE BET👀A roughly $342 MILLION cryptocurrency.
⠀
Nearly 993 MILLION tokens circulating.
⠀
Infrastructure designed to supply data availability to other blockchains.
⠀
And a token trading approximately 98.4% below its all-time high.
⠀
But here's the contradiction.
⠀
Celestia wants blockspace to become dramatically cheaper and more abundant.
⠀
$TIA investors still need that abundant capacity to generate meaningful economic demand.
⠀
More data does not automatically mean more revenue.
⠀
Is $TIA an overlooked bet on the next generation of blockchain infrastructure?
⠀
Or does cheap blockspace remain a difficult business for token holders?
⠀
Let's examine the numbers.
⠀
01 | WHAT IS CELESTIA?
⠀
Celestia is a modular data availability network.
⠀
Its central function is helping other chains publish data that participants can verify is available.
⠀
Execution and settlement can operate elsewhere.
⠀
This lets developers build application-specific chains without recreating every infrastructure component.
⠀
Data availability sampling allows light nodes to check availability without downloading entire blocks.
⠀
However, availability is different from permanent archival storage.
⠀
Applications still need to consider how older data remains retrievable.
⠀
The investment thesis is that many independent chains could purchase a shared infrastructure service.
⠀
The challenge is making that service economically valuable at scale.
⠀
02 | THE NUMBERS THAT MATTER
⠀
November 20, 2026 snapshot:
⠀
TIA Price: ~$0.3450
Market Cap: ~$342.5M
Reported FDV: ~$407.8M
Circulating Supply: ~992.7M TIA
Current Total Supply: ~1.182B TIA
Circulating / Current Total Supply: ~84.0%
Genesis Supply: 1B TIA
Maximum Supply: No fixed cap
24H Trading Volume: ~$18.7M
All-Time High: ~$20.91
Decline From ATH: ~98.4%
⠀
NETWORK ECONOMICS:
⠀
DefiLlama Tracked Chain Fees, 24H: ~$46
Post-v6 Inflation Framework: ~2.5% initially, declining annually
Long-Term Scheduled Inflation Floor: 1.5%
⠀
Exchange trading volume is not customer spending on Celestia.
⠀
The reported FDV uses currently issued supply.
⠀
It does not include every token that could be created through future inflation.
⠀
03 | THE CUSTOMER IS ANOTHER CHAIN
⠀
Celestia's customer relationship differs from that of a consumer trading application.
⠀
Rollups and infrastructure operators purchase data availability.
⠀
Their users may never interact directly with Celestia.
⠀
That can create efficient distribution.
⠀
One successful customer could bring substantial recurring demand.
⠀
But it also makes customer quality important.
⠀
A list of integrations does not reveal how many customers publish data consistently.
⠀
Investors should examine recurring paying namespaces, spending concentration, and customer retention.
⠀
Ten experimental chains can be less valuable than one durable production customer.
⠀
04 | THE FIBRE CHANGE
⠀
Fibre materially expands Celestia's technical ambitions.
⠀
The team reported an end-to-end benchmark sustaining approximately 3.07 terabits per second across 120 validators.
⠀
Its October 29 announcement also confirmed that Fibre had gone live on mainnet the previous week.
⠀
That moves the discussion beyond an entirely future roadmap.
⠀
However, benchmark throughput is capacity.
⠀
It is not customer utilization.
⠀
Nor is it fee revenue.
⠀
Fibre separates bulk data distribution from the commitments recorded onchain.
⠀
The investment question is whether applications actually need and pay for that capacity.
⠀
05 | THE VOYAGER OPPORTUNITY
⠀
Celestia introduced Voyager as an execution architecture targeting high-volume payments.
⠀
Its initial benchmark reported 21 million transactions per second.
⠀
The proposed market includes agents making small payments for content, data, and services.
⠀
That is a plausible reason applications might demand much more bandwidth.
⠀
But a benchmark payment is not a paying customer.
⠀
And the value transferred by an application is not automatically Celestia revenue.
⠀
The useful evidence would be production applications, recurring funded usage, and fees attributable to their data requirements.
⠀
The commercial opportunity remains separate from the performance demonstration.
⠀
06 | HOW TIA CAPTURES VALUE
⠀
Publishing conventional blobs on Celestia requires fees denominated in TIA.
⠀
That creates a direct utility connection.
⠀
TIA also supports staking and governance.
⠀
Developers can choose to use TIA as their own chain's gas token.
⠀
That additional role is optional.
⠀
A rollup using Celestia does not automatically require every user to hold TIA.
⠀
An operator can acquire the tokens needed for its publishing costs.
⠀
Consequently, the relevant demand is the amount of TIA customers need to purchase, hold, or commit.
⠀
An integration count alone cannot establish that amount.
⠀
07 | THE CHEAP BLOCKSPACE PARADOX
⠀
Lower costs make Celestia more attractive to developers.
⠀
But lower revenue per unit means usage must grow enough to compensate.
⠀
Compression can reduce the data required for each transaction.
⠀
Batching can spread publishing costs across more users.
⠀
These improvements benefit applications.
⠀
They can also weaken the relationship between application transaction counts and Celestia fees.
⠀
The latest tracked daily chain fees were approximately $46.
⠀
That is a single-day observation, not a complete revenue forecast or independently audited Fibre business statement.
⠀
Nevertheless, it illustrates why a capacity headline cannot substitute for evidence of monetization.
⠀
08 | THE INFLATION FRAMEWORK CHANGED
⠀
Repeating Celestia's original 8% inflation schedule would misdescribe its current framework.
⠀
The July 2025 Lotus upgrade reduced inflation to approximately 5%.
⠀
The November 2025 v6 upgrade reduced it again to approximately 2.5%.
⠀
The revised schedule decreases the rate by 6.7% annually toward a 1.5% floor.
⠀
These changes reduce ongoing issuance relative to the original design.
⠀
They do not create a fixed supply.
⠀
Lower inflation means slower dilution.
⠀
Deflation would require total supply to decline.
⠀
Those are different outcomes.
⠀
09 | THE UNLOCK STORY HAS ALSO CHANGED
⠀
The original vesting schedule placed early-backer completion in October 2025 and initial core-contributor completion in October 2026.
⠀
R&D and ecosystem vesting continues into October 2027.
⠀
The remaining scheduled R&D release is approximately 183,562 TIA daily.
⠀
That means old narratives about every initial investor allocation still vesting are outdated.
⠀
However, unlocked tokens can remain in custody and be distributed later.
⠀
Transferability is different from selling.
⠀
Staking issuance is also separate from allocation unlocks.
⠀
The relevant analysis combines actual circulation changes, treasury distributions, and new issuance without counting the same tokens twice.
⠀
10 | THE VALUATION QUESTION
⠀
Using approximately 1.182 billion current total tokens:
⠀
$0.50 TIA implies ~$591M total-supply valuation.
$1.00 implies ~$1.18B.
$2.00 implies ~$2.36B.
$5.00 implies ~$5.91B.
$10.00 implies ~$11.82B.
$20.91 implies ~$24.72B.
⠀
These are valuation illustrations, not price targets.
⠀
Future issuance changes the denominator.
⠀
The old price high is therefore not a shortcut to fair value.
⠀
Likewise, conventional DeFi TVL is a weak standalone measure for a network selling data availability.
⠀
A better valuation discussion starts with recurring customer spending, competitive pricing, and the security costs required to deliver the service.
⠀
11 | THE BULL AND BEAR CASE
⠀
THE BULL CASE:
⠀
Fibre attracts applications that existing infrastructure struggles to serve.
⠀
Production customers publish substantially more paid data.
⠀
Demand grows faster than improvements reduce cost per transaction.
⠀
Customer spending becomes broader and more durable.
⠀
And reduced issuance improves the balance between token demand and supply.
⠀
THE BEAR CASE:
⠀
Technical capacity grows faster than commercial demand.
⠀
Competing data availability services compress pricing.
⠀
Customers optimize away much of their publishing expense.
⠀
Activity remains concentrated in a few subsidized applications.
⠀
And issuance continues while fee demand stays small.
⠀
The network can become more useful without the token becoming proportionately more valuable.
⠀
12 | THE FINAL VERDICT
⠀
Celestia has a specific product and a clear customer category.
⠀
Fibre is now a deployed development.
⠀
The inflation framework is materially less aggressive than the original schedule.
⠀
And much of the initial backer and contributor vesting period has passed.
⠀
Those changes deserve recognition.
⠀
But the central investment question remains unresolved.
⠀
Can cheap, abundant data availability produce enough recurring economic demand to support TIA's valuation?
⠀
My assessment:
⠀
TIA is a bet on future paid infrastructure demand whose commercial evidence must catch up with its technical progress.
⠀
A roughly $342 million market capitalization creates a different starting valuation from the previous cycle.
⠀
It does not prove the token is cheap.
⠀
More capacity creates an opportunity.
⠀
Retained customers create recurring usage.
⠀
Paid publishing creates TIA demand.
⠀
Demand relative to issuance determines how much of that progress benefits holders.
⠀
Bookmark this analysis before the next modular infrastructure rotation.
⠀
Which has the strongest long-term data availability thesis?
⠀
TIA , $AVAIL , or $EIGEN?
⠀
And can Celestia turn abundant blockspace into sustainable token value?
⠀
Drop your view below.
#tia #Avail #eigen
🌚$TIA — THE MODULAR BLOCKSPACE BET👀
A roughly $342 MILLION cryptocurrency.
⠀
Nearly 993 MILLION tokens circulating.
⠀
Infrastructure designed to supply data availability to other blockchains.
⠀
And a token trading approximately 98.4% below its all-time high.
⠀
But here's the contradiction.
⠀
Celestia wants blockspace to become dramatically cheaper and more abundant.
⠀
$TIA investors still need that abundant capacity to generate meaningful economic demand.
⠀
More data does not automatically mean more revenue.
⠀
Is $TIA an overlooked bet on the next generation of blockchain infrastructure?
⠀
Or does cheap blockspace remain a difficult business for token holders?
⠀
Let's examine the numbers.
⠀
01 | WHAT IS CELESTIA?
⠀
Celestia is a modular data availability network.
⠀
Its central function is helping other chains publish data that participants can verify is available.
⠀
Execution and settlement can operate elsewhere.
⠀
This lets developers build application-specific chains without recreating every infrastructure component.
⠀
Data availability sampling allows light nodes to check availability without downloading entire blocks.
⠀
However, availability is different from permanent archival storage.
⠀
Applications still need to consider how older data remains retrievable.
⠀
The investment thesis is that many independent chains could purchase a shared infrastructure service.
⠀
The challenge is making that service economically valuable at scale.
⠀
02 | THE NUMBERS THAT MATTER
⠀
November 20, 2026 snapshot:
⠀
TIA Price: ~$0.3450
Market Cap: ~$342.5M
Reported FDV: ~$407.8M
Circulating Supply: ~992.7M TIA
Current Total Supply: ~1.182B TIA
Circulating / Current Total Supply: ~84.0%
Genesis Supply: 1B TIA
Maximum Supply: No fixed cap
24H Trading Volume: ~$18.7M
All-Time High: ~$20.91
Decline From ATH: ~98.4%
⠀
NETWORK ECONOMICS:
⠀
DefiLlama Tracked Chain Fees, 24H: ~$46
Post-v6 Inflation Framework: ~2.5% initially, declining annually
Long-Term Scheduled Inflation Floor: 1.5%
⠀
Exchange trading volume is not customer spending on Celestia.
⠀
The reported FDV uses currently issued supply.
⠀
It does not include every token that could be created through future inflation.
⠀
03 | THE CUSTOMER IS ANOTHER CHAIN
⠀
Celestia's customer relationship differs from that of a consumer trading application.
⠀
Rollups and infrastructure operators purchase data availability.
⠀
Their users may never interact directly with Celestia.
⠀
That can create efficient distribution.
⠀
One successful customer could bring substantial recurring demand.
⠀
But it also makes customer quality important.
⠀
A list of integrations does not reveal how many customers publish data consistently.
⠀
Investors should examine recurring paying namespaces, spending concentration, and customer retention.
⠀
Ten experimental chains can be less valuable than one durable production customer.
⠀
04 | THE FIBRE CHANGE
⠀
Fibre materially expands Celestia's technical ambitions.
⠀
The team reported an end-to-end benchmark sustaining approximately 3.07 terabits per second across 120 validators.
⠀
Its October 29 announcement also confirmed that Fibre had gone live on mainnet the previous week.
⠀
That moves the discussion beyond an entirely future roadmap.
⠀
However, benchmark throughput is capacity.
⠀
It is not customer utilization.
⠀
Nor is it fee revenue.
⠀
Fibre separates bulk data distribution from the commitments recorded onchain.
⠀
The investment question is whether applications actually need and pay for that capacity.
⠀
05 | THE VOYAGER OPPORTUNITY
⠀
Celestia introduced Voyager as an execution architecture targeting high-volume payments.
⠀
Its initial benchmark reported 21 million transactions per second.
⠀
The proposed market includes agents making small payments for content, data, and services.
⠀
That is a plausible reason applications might demand much more bandwidth.
⠀
But a benchmark payment is not a paying customer.
⠀
And the value transferred by an application is not automatically Celestia revenue.
⠀
The useful evidence would be production applications, recurring funded usage, and fees attributable to their data requirements.
⠀
The commercial opportunity remains separate from the performance demonstration.
⠀
06 | HOW TIA CAPTURES VALUE
⠀
Publishing conventional blobs on Celestia requires fees denominated in TIA.
⠀
That creates a direct utility connection.
⠀
TIA also supports staking and governance.
⠀
Developers can choose to use TIA as their own chain's gas token.
⠀
That additional role is optional.
⠀
A rollup using Celestia does not automatically require every user to hold TIA.
⠀
An operator can acquire the tokens needed for its publishing costs.
⠀
Consequently, the relevant demand is the amount of TIA customers need to purchase, hold, or commit.
⠀
An integration count alone cannot establish that amount.
⠀
07 | THE CHEAP BLOCKSPACE PARADOX
⠀
Lower costs make Celestia more attractive to developers.
⠀
But lower revenue per unit means usage must grow enough to compensate.
⠀
Compression can reduce the data required for each transaction.
⠀
Batching can spread publishing costs across more users.
⠀
These improvements benefit applications.
⠀
They can also weaken the relationship between application transaction counts and Celestia fees.
⠀
The latest tracked daily chain fees were approximately $46.
⠀
That is a single-day observation, not a complete revenue forecast or independently audited Fibre business statement.
⠀
Nevertheless, it illustrates why a capacity headline cannot substitute for evidence of monetization.
⠀
08 | THE INFLATION FRAMEWORK CHANGED
⠀
Repeating Celestia's original 8% inflation schedule would misdescribe its current framework.
⠀
The July 2025 Lotus upgrade reduced inflation to approximately 5%.
⠀
The November 2025 v6 upgrade reduced it again to approximately 2.5%.
⠀
The revised schedule decreases the rate by 6.7% annually toward a 1.5% floor.
⠀
These changes reduce ongoing issuance relative to the original design.
⠀
They do not create a fixed supply.
⠀
Lower inflation means slower dilution.
⠀
Deflation would require total supply to decline.
⠀
Those are different outcomes.
⠀
09 | THE UNLOCK STORY HAS ALSO CHANGED
⠀
The original vesting schedule placed early-backer completion in October 2025 and initial core-contributor completion in October 2026.
⠀
R&D and ecosystem vesting continues into October 2027.
⠀
The remaining scheduled R&D release is approximately 183,562 TIA daily.
⠀
That means old narratives about every initial investor allocation still vesting are outdated.
⠀
However, unlocked tokens can remain in custody and be distributed later.
⠀
Transferability is different from selling.
⠀
Staking issuance is also separate from allocation unlocks.
⠀
The relevant analysis combines actual circulation changes, treasury distributions, and new issuance without counting the same tokens twice.
⠀
10 | THE VALUATION QUESTION
⠀
Using approximately 1.182 billion current total tokens:
⠀
$0.50 TIA implies ~$591M total-supply valuation.
$1.00 implies ~$1.18B.
$2.00 implies ~$2.36B.
$5.00 implies ~$5.91B.
$10.00 implies ~$11.82B.
$20.91 implies ~$24.72B.
⠀
These are valuation illustrations, not price targets.
⠀
Future issuance changes the denominator.
⠀
The old price high is therefore not a shortcut to fair value.
⠀
Likewise, conventional DeFi TVL is a weak standalone measure for a network selling data availability.
⠀
A better valuation discussion starts with recurring customer spending, competitive pricing, and the security costs required to deliver the service.
⠀
11 | THE BULL AND BEAR CASE
⠀
THE BULL CASE:
⠀
Fibre attracts applications that existing infrastructure struggles to serve.
⠀
Production customers publish substantially more paid data.
⠀
Demand grows faster than improvements reduce cost per transaction.
⠀
Customer spending becomes broader and more durable.
⠀
And reduced issuance improves the balance between token demand and supply.
⠀
THE BEAR CASE:
⠀
Technical capacity grows faster than commercial demand.
⠀
Competing data availability services compress pricing.
⠀
Customers optimize away much of their publishing expense.
⠀
Activity remains concentrated in a few subsidized applications.
⠀
And issuance continues while fee demand stays small.
⠀
The network can become more useful without the token becoming proportionately more valuable.
⠀
12 | THE FINAL VERDICT
⠀
Celestia has a specific product and a clear customer category.
⠀
Fibre is now a deployed development.
⠀
The inflation framework is materially less aggressive than the original schedule.
⠀
And much of the initial backer and contributor vesting period has passed.
⠀
Those changes deserve recognition.
⠀
But the central investment question remains unresolved.
⠀
Can cheap, abundant data availability produce enough recurring economic demand to support TIA's valuation?
⠀
My assessment:
⠀
TIA is a bet on future paid infrastructure demand whose commercial evidence must catch up with its technical progress.
⠀
A roughly $342 million market capitalization creates a different starting valuation from the previous cycle.
⠀
It does not prove the token is cheap.
⠀
More capacity creates an opportunity.
⠀
Retained customers create recurring usage.
⠀
Paid publishing creates TIA demand.
⠀
Demand relative to issuance determines how much of that progress benefits holders.
⠀
Bookmark this analysis before the next modular infrastructure rotation.
⠀
Which has the strongest long-term data availability thesis?
⠀
TIA , $AVAIL , or $EIGEN?
⠀
And can Celestia turn abundant blockspace into sustainable token value?
⠀
Drop your view below.
#tia #Avail #eigen
⠀
Nearly 993 MILLION tokens circulating.
⠀
Infrastructure designed to supply data availability to other blockchains.
⠀
And a token trading approximately 98.4% below its all-time high.
⠀
But here's the contradiction.
⠀
Celestia wants blockspace to become dramatically cheaper and more abundant.
⠀
$TIA investors still need that abundant capacity to generate meaningful economic demand.
⠀
More data does not automatically mean more revenue.
⠀
Is $TIA an overlooked bet on the next generation of blockchain infrastructure?
⠀
Or does cheap blockspace remain a difficult business for token holders?
⠀
Let's examine the numbers.
⠀
01 | WHAT IS CELESTIA?
⠀
Celestia is a modular data availability network.
⠀
Its central function is helping other chains publish data that participants can verify is available.
⠀
Execution and settlement can operate elsewhere.
⠀
This lets developers build application-specific chains without recreating every infrastructure component.
⠀
Data availability sampling allows light nodes to check availability without downloading entire blocks.
⠀
However, availability is different from permanent archival storage.
⠀
Applications still need to consider how older data remains retrievable.
⠀
The investment thesis is that many independent chains could purchase a shared infrastructure service.
⠀
The challenge is making that service economically valuable at scale.
⠀
02 | THE NUMBERS THAT MATTER
⠀
November 20, 2026 snapshot:
⠀
TIA Price: ~$0.3450
Market Cap: ~$342.5M
Reported FDV: ~$407.8M
Circulating Supply: ~992.7M TIA
Current Total Supply: ~1.182B TIA
Circulating / Current Total Supply: ~84.0%
Genesis Supply: 1B TIA
Maximum Supply: No fixed cap
24H Trading Volume: ~$18.7M
All-Time High: ~$20.91
Decline From ATH: ~98.4%
⠀
NETWORK ECONOMICS:
⠀
DefiLlama Tracked Chain Fees, 24H: ~$46
Post-v6 Inflation Framework: ~2.5% initially, declining annually
Long-Term Scheduled Inflation Floor: 1.5%
⠀
Exchange trading volume is not customer spending on Celestia.
⠀
The reported FDV uses currently issued supply.
⠀
It does not include every token that could be created through future inflation.
⠀
03 | THE CUSTOMER IS ANOTHER CHAIN
⠀
Celestia's customer relationship differs from that of a consumer trading application.
⠀
Rollups and infrastructure operators purchase data availability.
⠀
Their users may never interact directly with Celestia.
⠀
That can create efficient distribution.
⠀
One successful customer could bring substantial recurring demand.
⠀
But it also makes customer quality important.
⠀
A list of integrations does not reveal how many customers publish data consistently.
⠀
Investors should examine recurring paying namespaces, spending concentration, and customer retention.
⠀
Ten experimental chains can be less valuable than one durable production customer.
⠀
04 | THE FIBRE CHANGE
⠀
Fibre materially expands Celestia's technical ambitions.
⠀
The team reported an end-to-end benchmark sustaining approximately 3.07 terabits per second across 120 validators.
⠀
Its October 29 announcement also confirmed that Fibre had gone live on mainnet the previous week.
⠀
That moves the discussion beyond an entirely future roadmap.
⠀
However, benchmark throughput is capacity.
⠀
It is not customer utilization.
⠀
Nor is it fee revenue.
⠀
Fibre separates bulk data distribution from the commitments recorded onchain.
⠀
The investment question is whether applications actually need and pay for that capacity.
⠀
05 | THE VOYAGER OPPORTUNITY
⠀
Celestia introduced Voyager as an execution architecture targeting high-volume payments.
⠀
Its initial benchmark reported 21 million transactions per second.
⠀
The proposed market includes agents making small payments for content, data, and services.
⠀
That is a plausible reason applications might demand much more bandwidth.
⠀
But a benchmark payment is not a paying customer.
⠀
And the value transferred by an application is not automatically Celestia revenue.
⠀
The useful evidence would be production applications, recurring funded usage, and fees attributable to their data requirements.
⠀
The commercial opportunity remains separate from the performance demonstration.
⠀
06 | HOW TIA CAPTURES VALUE
⠀
Publishing conventional blobs on Celestia requires fees denominated in TIA.
⠀
That creates a direct utility connection.
⠀
TIA also supports staking and governance.
⠀
Developers can choose to use TIA as their own chain's gas token.
⠀
That additional role is optional.
⠀
A rollup using Celestia does not automatically require every user to hold TIA.
⠀
An operator can acquire the tokens needed for its publishing costs.
⠀
Consequently, the relevant demand is the amount of TIA customers need to purchase, hold, or commit.
⠀
An integration count alone cannot establish that amount.
⠀
07 | THE CHEAP BLOCKSPACE PARADOX
⠀
Lower costs make Celestia more attractive to developers.
⠀
But lower revenue per unit means usage must grow enough to compensate.
⠀
Compression can reduce the data required for each transaction.
⠀
Batching can spread publishing costs across more users.
⠀
These improvements benefit applications.
⠀
They can also weaken the relationship between application transaction counts and Celestia fees.
⠀
The latest tracked daily chain fees were approximately $46.
⠀
That is a single-day observation, not a complete revenue forecast or independently audited Fibre business statement.
⠀
Nevertheless, it illustrates why a capacity headline cannot substitute for evidence of monetization.
⠀
08 | THE INFLATION FRAMEWORK CHANGED
⠀
Repeating Celestia's original 8% inflation schedule would misdescribe its current framework.
⠀
The July 2025 Lotus upgrade reduced inflation to approximately 5%.
⠀
The November 2025 v6 upgrade reduced it again to approximately 2.5%.
⠀
The revised schedule decreases the rate by 6.7% annually toward a 1.5% floor.
⠀
These changes reduce ongoing issuance relative to the original design.
⠀
They do not create a fixed supply.
⠀
Lower inflation means slower dilution.
⠀
Deflation would require total supply to decline.
⠀
Those are different outcomes.
⠀
09 | THE UNLOCK STORY HAS ALSO CHANGED
⠀
The original vesting schedule placed early-backer completion in October 2025 and initial core-contributor completion in October 2026.
⠀
R&D and ecosystem vesting continues into October 2027.
⠀
The remaining scheduled R&D release is approximately 183,562 TIA daily.
⠀
That means old narratives about every initial investor allocation still vesting are outdated.
⠀
However, unlocked tokens can remain in custody and be distributed later.
⠀
Transferability is different from selling.
⠀
Staking issuance is also separate from allocation unlocks.
⠀
The relevant analysis combines actual circulation changes, treasury distributions, and new issuance without counting the same tokens twice.
⠀
10 | THE VALUATION QUESTION
⠀
Using approximately 1.182 billion current total tokens:
⠀
$0.50 TIA implies ~$591M total-supply valuation.
$1.00 implies ~$1.18B.
$2.00 implies ~$2.36B.
$5.00 implies ~$5.91B.
$10.00 implies ~$11.82B.
$20.91 implies ~$24.72B.
⠀
These are valuation illustrations, not price targets.
⠀
Future issuance changes the denominator.
⠀
The old price high is therefore not a shortcut to fair value.
⠀
Likewise, conventional DeFi TVL is a weak standalone measure for a network selling data availability.
⠀
A better valuation discussion starts with recurring customer spending, competitive pricing, and the security costs required to deliver the service.
⠀
11 | THE BULL AND BEAR CASE
⠀
THE BULL CASE:
⠀
Fibre attracts applications that existing infrastructure struggles to serve.
⠀
Production customers publish substantially more paid data.
⠀
Demand grows faster than improvements reduce cost per transaction.
⠀
Customer spending becomes broader and more durable.
⠀
And reduced issuance improves the balance between token demand and supply.
⠀
THE BEAR CASE:
⠀
Technical capacity grows faster than commercial demand.
⠀
Competing data availability services compress pricing.
⠀
Customers optimize away much of their publishing expense.
⠀
Activity remains concentrated in a few subsidized applications.
⠀
And issuance continues while fee demand stays small.
⠀
The network can become more useful without the token becoming proportionately more valuable.
⠀
12 | THE FINAL VERDICT
⠀
Celestia has a specific product and a clear customer category.
⠀
Fibre is now a deployed development.
⠀
The inflation framework is materially less aggressive than the original schedule.
⠀
And much of the initial backer and contributor vesting period has passed.
⠀
Those changes deserve recognition.
⠀
But the central investment question remains unresolved.
⠀
Can cheap, abundant data availability produce enough recurring economic demand to support TIA's valuation?
⠀
My assessment:
⠀
TIA is a bet on future paid infrastructure demand whose commercial evidence must catch up with its technical progress.
⠀
A roughly $342 million market capitalization creates a different starting valuation from the previous cycle.
⠀
It does not prove the token is cheap.
⠀
More capacity creates an opportunity.
⠀
Retained customers create recurring usage.
⠀
Paid publishing creates TIA demand.
⠀
Demand relative to issuance determines how much of that progress benefits holders.
⠀
Bookmark this analysis before the next modular infrastructure rotation.
⠀
Which has the strongest long-term data availability thesis?
⠀
TIA , $AVAIL , or $EIGEN?
⠀
And can Celestia turn abundant blockspace into sustainable token value?
⠀
Drop your view below.
#tia #Avail #eigen
1
1
104

Article
$ICP — THE PAID COMPUTE AND SUPPLY BALANCE BETA roughly $1.18 BILLION cryptocurrency.
More than 559 MILLION tokens circulating.
⠀A network where applications purchase computing resources by converting ICP into cycles.
⠀And a token trading approximately 99.7% below its recorded all-time high.
⠀But here's the contradiction.
⠀ICP has a direct connection between computing expenditure and token destruction.
⠀
That does not automatically mean the network destroys more tokens than it issues.
⠀
Is $ICP an overlooked bet on decentralized application hosting?
{future}(ICPUSDT)
⠀
Or does its computing infrastructure still need much greater paid demand?
⠀
Let's examine the numbers.
⠀
01 | WHAT IS THE INTERNET COMPUTER?
⠀
The Internet Computer is a blockchain-based computing network.
⠀
Its canister smart contracts combine application code with persistent data.
⠀
The ambition extends beyond transferring assets.
⠀
Applications can use the network for hosting, storage, and computation.
⠀
ICP supports governance and is converted into cycles to fund those resources.
⠀
The investment thesis is that developers will pay for capabilities they cannot obtain as effectively elsewhere.
⠀
But a broad technical ambition is not a customer base.
⠀
The relevant evidence is useful software that remains active and funded.
⠀
Infrastructure creates capacity.
⠀
Customers establish its commercial value.
⠀
02 | THE NUMBERS THAT MATTER
⠀
November 20, 2026 retrieved snapshot:
⠀
ICP Price: ~$2.11
Market Cap: ~$1.18B
Reported FDV: ~$1.18B
Circulating Supply: ~559.05M ICP
Reported Current Total Supply: ~559.05M ICP
Maximum Supply: No fixed cap
Circulating / Reported Current Total: ~100%
24H ICP Trading Volume: ~$39.72M
Recorded All-Time High: ~$750.73
Decline From Recorded ATH: ~99.72%
⠀
Similar market capitalization and reported FDV do not mean future issuance has ended.
⠀
The current total is a measurement, not a lifetime supply ceiling.
⠀
The recorded ATH is also not a fair-value benchmark.
⠀
The stronger operating comparison is tokens issued against tokens destroyed over the same period.
⠀
That comparison requires consistent definitions and complete data.
⠀
03 | THE CYCLE CONVERSION MECHANISM
⠀
Applications need cycles to purchase network resources.
⠀
Converting ICP into cycles destroys ICP.
⠀
Those cycles are then consumed as applications operate.
⠀
The token conversion and later cycle consumption are different stages of the same funding process.
⠀
They should not be counted as two separate ICP burns.
⠀
Timing matters too.
⠀
An application can spend a previously funded cycle balance without purchasing an identical amount of new cycles that day.
⠀
Therefore, computing activity and fresh token destruction need not move together in every short window.
⠀
The useful analysis follows both balances and flows.
⠀
04 | THE REVERSE-GAS OPPORTUNITY
⠀
Applications can fund their own operating resources rather than requiring every visitor to acquire tokens.
⠀
That can reduce onboarding friction.
⠀
A user may interact with a service without first managing a crypto balance.
⠀
For investors, that creates a different demand model.
⠀
The application operator becomes the resource purchaser.
⠀
The important question is whether operators continue funding useful services.
⠀
A large number of visits can produce modest spending if each interaction is inexpensive.
⠀
A smaller number of resource-intensive workloads can produce more.
⠀
User count alone does not establish computing revenue.
⠀
05 | STABLE PRICING CHANGES THE BURN MATH
⠀
Cycle pricing is anchored to the IMF's SDR.
⠀
That helps keep resource costs from moving directly with ICP's market price.
⠀
It also means token quantity and real spending can diverge.
⠀
At unchanged spending, a lower ICP price generally requires more tokens for the same cycle budget.
⠀
A higher price generally requires fewer.
⠀
Therefore, an increase in ICP destroyed does not automatically prove an equivalent increase in customer expenditure.
⠀
Investors should examine both the token amount and its value at conversion.
⠀
The customer buys computing resources.
⠀
The holder needs to understand how that purchase affects supply.
⠀
06 | THE ISSUANCE SIDE OF THE EQUATION
⠀
The network compensates node providers and governance participants.
⠀
These mechanisms can create new ICP.
⠀
Conversion into cycles and transaction-fee burns reduce supply.
⠀
The net result depends on the relationship between those flows.
⠀
A network can report growing burns while supply continues expanding.
⠀
Likewise, lower issuance can improve supply dynamics without establishing stronger customer demand.
⠀
Both are relevant.
⠀
They answer different questions.
⠀
A simplified framework:
⠀
New tokens issued minus tokens destroyed equals the net change from those mechanisms.
⠀
“ICP burns” describes a feature.
⠀
“ICP is net deflationary” requires measured evidence.
⠀
07 | NODE ECONOMICS NEED UTILIZATION
⠀
Node providers operate the hardware supporting applications.
⠀
Compensating them supports network availability.
⠀
But hardware availability alone does not establish economic efficiency.
⠀
The commercial question is how much useful demand that infrastructure serves.
⠀
Adding capacity can improve resilience and room for growth.
⠀
It can also increase the resources the network must support.
⠀
My assessment:
⠀
Expansion becomes more compelling when retained workloads and external spending justify it.
⠀
The useful measurements include utilization, resource consumption, and the cost of maintaining service.
⠀
Infrastructure scale is an input.
⠀
Productive demand determines the return on that input.
⠀
08 | CAFFEINE EXPANDS THE BUILDER FUNNEL
⠀
Caffeine allows users to create applications through conversation.
⠀
That can reduce the effort required to move from an idea to deployed software.
⠀
But application creation is not the same as application retention.
⠀
A generated project can remain unused.
⠀
A popular project can consume relatively little compute.
⠀
And a subsidized project may stop when support ends.
⠀
The stronger evidence is software that people continue using and someone continues paying to operate.
⠀
AI can increase the number of builders.
⠀
It cannot guarantee that their output becomes commercially useful.
⠀
The funding and retention data matter more than creation counts alone.
⠀
09 | MISSION 70 REQUIRES AN OUTCOME CHECK
⠀
DFINITY's Mission 70 paper targets at least a 70% reduction in ICP inflation by the end of 2026.
⠀
The framework combines supply-side adjustments with demand growth.
⠀
That is an important objective.
⠀
It should not be presented as a completed result without corresponding measurements.
⠀
Governance approval, implementation, and observed supply effects are separate checkpoints.
⠀
The baseline also matters.
⠀
Gross issuance and net supply growth can produce different reduction percentages.
⠀
A useful assessment compares the same measure over consistent periods.
⠀
A target explains the intended direction.
⠀
Onchain outcomes establish how much was delivered.
⠀
10 | THE VALUATION QUESTION
⠀
Using approximately 559.05 million current tokens:
⠀
$5 ICP implies ~$2.80B current-supply valuation.
$10 implies ~$5.59B.
$20 implies ~$11.18B.
$50 implies ~$27.95B.
$100 implies ~$55.91B.
⠀
Applying the recorded $750.73 ATH to today's supply implies approximately $419.7 billion.
⠀
These are valuation illustrations, not price targets.
⠀
Future net issuance or destruction changes the denominator.
⠀
The arithmetic shows why a historical peak is not a simple recovery destination.
⠀
At roughly $1.18 billion, the thesis depends on future utility, demand, and monetary value.
⠀
The drawdown alone cannot establish those expectations.
⠀
11 | THE BULL AND BEAR CASE
⠀
THE BULL CASE:
⠀
Developers maintain applications with retained users.
⠀
AI tools create more useful deployed software.
⠀
Organizations purchase recurring computing resources.
⠀
Infrastructure costs become more efficient.
⠀
And economic reforms improve the balance between issuance and destruction.
⠀
THE BEAR CASE:
⠀
Application creation produces limited repeat usage.
⠀
Customer expenditure remains modest.
⠀
Network compensation exceeds the supply effect of paid demand.
⠀
Competing infrastructure offers a better operating experience.
⠀
And token economics improve less than investors expect.
⠀
Technical differentiation can attract experimentation.
⠀
Sustained paid workloads provide stronger commercial evidence.
⠀
12 | THE FINAL VERDICT
⠀
ICP has an identifiable token-demand mechanism.
⠀
Applications require cycles.
⠀
ICP conversion funds those cycles and destroys tokens.
⠀
The network also provides a broader application-hosting environment.
⠀
But the investment case remains conditional.
⠀
A roughly $1.18 billion market capitalization.
⠀
No fixed maximum supply.
⠀
Continuing network compensation.
⠀
And a need for verified evidence that paid demand is improving the overall economics.
⠀
My assessment:
⠀
ICP is a computing commercialization thesis with a measurable supply-balance test.
⠀
The strongest evidence combines retained workloads, recurring external spending, and efficient participant compensation.
⠀
More applications create possibilities.
⠀
Retained users demonstrate usefulness.
⠀
Funded computing creates expenditure.
⠀
The balance between token destruction and issuance determines the supply outcome.
⠀
A 99.72% drawdown does not prove that balance is favorable.
⠀
Neither does a high transaction count.
⠀
Bookmark this analysis before the next decentralized computing rotation.
⠀
Which would change your view first?
⠀
Stronger recurring compute expenditure or verified improvement in net issuance?
⠀
And can ICP turn useful software into sustainable token demand?
⠀
Drop your view below.
#icp #BTC
$ICP — THE PAID COMPUTE AND SUPPLY BALANCE BET
A roughly $1.18 BILLION cryptocurrency.
More than 559 MILLION tokens circulating.
⠀A network where applications purchase computing resources by converting ICP into cycles.
⠀And a token trading approximately 99.7% below its recorded all-time high.
⠀But here's the contradiction.
⠀ICP has a direct connection between computing expenditure and token destruction.
⠀
That does not automatically mean the network destroys more tokens than it issues.
⠀
Is $ICP an overlooked bet on decentralized application hosting?
⠀
Or does its computing infrastructure still need much greater paid demand?
⠀
Let's examine the numbers.
⠀
01 | WHAT IS THE INTERNET COMPUTER?
⠀
The Internet Computer is a blockchain-based computing network.
⠀
Its canister smart contracts combine application code with persistent data.
⠀
The ambition extends beyond transferring assets.
⠀
Applications can use the network for hosting, storage, and computation.
⠀
ICP supports governance and is converted into cycles to fund those resources.
⠀
The investment thesis is that developers will pay for capabilities they cannot obtain as effectively elsewhere.
⠀
But a broad technical ambition is not a customer base.
⠀
The relevant evidence is useful software that remains active and funded.
⠀
Infrastructure creates capacity.
⠀
Customers establish its commercial value.
⠀
02 | THE NUMBERS THAT MATTER
⠀
November 20, 2026 retrieved snapshot:
⠀
ICP Price: ~$2.11
Market Cap: ~$1.18B
Reported FDV: ~$1.18B
Circulating Supply: ~559.05M ICP
Reported Current Total Supply: ~559.05M ICP
Maximum Supply: No fixed cap
Circulating / Reported Current Total: ~100%
24H ICP Trading Volume: ~$39.72M
Recorded All-Time High: ~$750.73
Decline From Recorded ATH: ~99.72%
⠀
Similar market capitalization and reported FDV do not mean future issuance has ended.
⠀
The current total is a measurement, not a lifetime supply ceiling.
⠀
The recorded ATH is also not a fair-value benchmark.
⠀
The stronger operating comparison is tokens issued against tokens destroyed over the same period.
⠀
That comparison requires consistent definitions and complete data.
⠀
03 | THE CYCLE CONVERSION MECHANISM
⠀
Applications need cycles to purchase network resources.
⠀
Converting ICP into cycles destroys ICP.
⠀
Those cycles are then consumed as applications operate.
⠀
The token conversion and later cycle consumption are different stages of the same funding process.
⠀
They should not be counted as two separate ICP burns.
⠀
Timing matters too.
⠀
An application can spend a previously funded cycle balance without purchasing an identical amount of new cycles that day.
⠀
Therefore, computing activity and fresh token destruction need not move together in every short window.
⠀
The useful analysis follows both balances and flows.
⠀
04 | THE REVERSE-GAS OPPORTUNITY
⠀
Applications can fund their own operating resources rather than requiring every visitor to acquire tokens.
⠀
That can reduce onboarding friction.
⠀
A user may interact with a service without first managing a crypto balance.
⠀
For investors, that creates a different demand model.
⠀
The application operator becomes the resource purchaser.
⠀
The important question is whether operators continue funding useful services.
⠀
A large number of visits can produce modest spending if each interaction is inexpensive.
⠀
A smaller number of resource-intensive workloads can produce more.
⠀
User count alone does not establish computing revenue.
⠀
05 | STABLE PRICING CHANGES THE BURN MATH
⠀
Cycle pricing is anchored to the IMF's SDR.
⠀
That helps keep resource costs from moving directly with ICP's market price.
⠀
It also means token quantity and real spending can diverge.
⠀
At unchanged spending, a lower ICP price generally requires more tokens for the same cycle budget.
⠀
A higher price generally requires fewer.
⠀
Therefore, an increase in ICP destroyed does not automatically prove an equivalent increase in customer expenditure.
⠀
Investors should examine both the token amount and its value at conversion.
⠀
The customer buys computing resources.
⠀
The holder needs to understand how that purchase affects supply.
⠀
06 | THE ISSUANCE SIDE OF THE EQUATION
⠀
The network compensates node providers and governance participants.
⠀
These mechanisms can create new ICP.
⠀
Conversion into cycles and transaction-fee burns reduce supply.
⠀
The net result depends on the relationship between those flows.
⠀
A network can report growing burns while supply continues expanding.
⠀
Likewise, lower issuance can improve supply dynamics without establishing stronger customer demand.
⠀
Both are relevant.
⠀
They answer different questions.
⠀
A simplified framework:
⠀
New tokens issued minus tokens destroyed equals the net change from those mechanisms.
⠀
“ICP burns” describes a feature.
⠀
“ICP is net deflationary” requires measured evidence.
⠀
07 | NODE ECONOMICS NEED UTILIZATION
⠀
Node providers operate the hardware supporting applications.
⠀
Compensating them supports network availability.
⠀
But hardware availability alone does not establish economic efficiency.
⠀
The commercial question is how much useful demand that infrastructure serves.
⠀
Adding capacity can improve resilience and room for growth.
⠀
It can also increase the resources the network must support.
⠀
My assessment:
⠀
Expansion becomes more compelling when retained workloads and external spending justify it.
⠀
The useful measurements include utilization, resource consumption, and the cost of maintaining service.
⠀
Infrastructure scale is an input.
⠀
Productive demand determines the return on that input.
⠀
08 | CAFFEINE EXPANDS THE BUILDER FUNNEL
⠀
Caffeine allows users to create applications through conversation.
⠀
That can reduce the effort required to move from an idea to deployed software.
⠀
But application creation is not the same as application retention.
⠀
A generated project can remain unused.
⠀
A popular project can consume relatively little compute.
⠀
And a subsidized project may stop when support ends.
⠀
The stronger evidence is software that people continue using and someone continues paying to operate.
⠀
AI can increase the number of builders.
⠀
It cannot guarantee that their output becomes commercially useful.
⠀
The funding and retention data matter more than creation counts alone.
⠀
09 | MISSION 70 REQUIRES AN OUTCOME CHECK
⠀
DFINITY's Mission 70 paper targets at least a 70% reduction in ICP inflation by the end of 2026.
⠀
The framework combines supply-side adjustments with demand growth.
⠀
That is an important objective.
⠀
It should not be presented as a completed result without corresponding measurements.
⠀
Governance approval, implementation, and observed supply effects are separate checkpoints.
⠀
The baseline also matters.
⠀
Gross issuance and net supply growth can produce different reduction percentages.
⠀
A useful assessment compares the same measure over consistent periods.
⠀
A target explains the intended direction.
⠀
Onchain outcomes establish how much was delivered.
⠀
10 | THE VALUATION QUESTION
⠀
Using approximately 559.05 million current tokens:
⠀
$5 ICP implies ~$2.80B current-supply valuation.
$10 implies ~$5.59B.
$20 implies ~$11.18B.
$50 implies ~$27.95B.
$100 implies ~$55.91B.
⠀
Applying the recorded $750.73 ATH to today's supply implies approximately $419.7 billion.
⠀
These are valuation illustrations, not price targets.
⠀
Future net issuance or destruction changes the denominator.
⠀
The arithmetic shows why a historical peak is not a simple recovery destination.
⠀
At roughly $1.18 billion, the thesis depends on future utility, demand, and monetary value.
⠀
The drawdown alone cannot establish those expectations.
⠀
11 | THE BULL AND BEAR CASE
⠀
THE BULL CASE:
⠀
Developers maintain applications with retained users.
⠀
AI tools create more useful deployed software.
⠀
Organizations purchase recurring computing resources.
⠀
Infrastructure costs become more efficient.
⠀
And economic reforms improve the balance between issuance and destruction.
⠀
THE BEAR CASE:
⠀
Application creation produces limited repeat usage.
⠀
Customer expenditure remains modest.
⠀
Network compensation exceeds the supply effect of paid demand.
⠀
Competing infrastructure offers a better operating experience.
⠀
And token economics improve less than investors expect.
⠀
Technical differentiation can attract experimentation.
⠀
Sustained paid workloads provide stronger commercial evidence.
⠀
12 | THE FINAL VERDICT
⠀
ICP has an identifiable token-demand mechanism.
⠀
Applications require cycles.
⠀
ICP conversion funds those cycles and destroys tokens.
⠀
The network also provides a broader application-hosting environment.
⠀
But the investment case remains conditional.
⠀
A roughly $1.18 billion market capitalization.
⠀
No fixed maximum supply.
⠀
Continuing network compensation.
⠀
And a need for verified evidence that paid demand is improving the overall economics.
⠀
My assessment:
⠀
ICP is a computing commercialization thesis with a measurable supply-balance test.
⠀
The strongest evidence combines retained workloads, recurring external spending, and efficient participant compensation.
⠀
More applications create possibilities.
⠀
Retained users demonstrate usefulness.
⠀
Funded computing creates expenditure.
⠀
The balance between token destruction and issuance determines the supply outcome.
⠀
A 99.72% drawdown does not prove that balance is favorable.
⠀
Neither does a high transaction count.
⠀
Bookmark this analysis before the next decentralized computing rotation.
⠀
Which would change your view first?
⠀
Stronger recurring compute expenditure or verified improvement in net issuance?
⠀
And can ICP turn useful software into sustainable token demand?
⠀
Drop your view below.
#icp #BTC
More than 559 MILLION tokens circulating.
⠀A network where applications purchase computing resources by converting ICP into cycles.
⠀And a token trading approximately 99.7% below its recorded all-time high.
⠀But here's the contradiction.
⠀ICP has a direct connection between computing expenditure and token destruction.
⠀
That does not automatically mean the network destroys more tokens than it issues.
⠀
Is $ICP an overlooked bet on decentralized application hosting?
⠀
Or does its computing infrastructure still need much greater paid demand?
⠀
Let's examine the numbers.
⠀
01 | WHAT IS THE INTERNET COMPUTER?
⠀
The Internet Computer is a blockchain-based computing network.
⠀
Its canister smart contracts combine application code with persistent data.
⠀
The ambition extends beyond transferring assets.
⠀
Applications can use the network for hosting, storage, and computation.
⠀
ICP supports governance and is converted into cycles to fund those resources.
⠀
The investment thesis is that developers will pay for capabilities they cannot obtain as effectively elsewhere.
⠀
But a broad technical ambition is not a customer base.
⠀
The relevant evidence is useful software that remains active and funded.
⠀
Infrastructure creates capacity.
⠀
Customers establish its commercial value.
⠀
02 | THE NUMBERS THAT MATTER
⠀
November 20, 2026 retrieved snapshot:
⠀
ICP Price: ~$2.11
Market Cap: ~$1.18B
Reported FDV: ~$1.18B
Circulating Supply: ~559.05M ICP
Reported Current Total Supply: ~559.05M ICP
Maximum Supply: No fixed cap
Circulating / Reported Current Total: ~100%
24H ICP Trading Volume: ~$39.72M
Recorded All-Time High: ~$750.73
Decline From Recorded ATH: ~99.72%
⠀
Similar market capitalization and reported FDV do not mean future issuance has ended.
⠀
The current total is a measurement, not a lifetime supply ceiling.
⠀
The recorded ATH is also not a fair-value benchmark.
⠀
The stronger operating comparison is tokens issued against tokens destroyed over the same period.
⠀
That comparison requires consistent definitions and complete data.
⠀
03 | THE CYCLE CONVERSION MECHANISM
⠀
Applications need cycles to purchase network resources.
⠀
Converting ICP into cycles destroys ICP.
⠀
Those cycles are then consumed as applications operate.
⠀
The token conversion and later cycle consumption are different stages of the same funding process.
⠀
They should not be counted as two separate ICP burns.
⠀
Timing matters too.
⠀
An application can spend a previously funded cycle balance without purchasing an identical amount of new cycles that day.
⠀
Therefore, computing activity and fresh token destruction need not move together in every short window.
⠀
The useful analysis follows both balances and flows.
⠀
04 | THE REVERSE-GAS OPPORTUNITY
⠀
Applications can fund their own operating resources rather than requiring every visitor to acquire tokens.
⠀
That can reduce onboarding friction.
⠀
A user may interact with a service without first managing a crypto balance.
⠀
For investors, that creates a different demand model.
⠀
The application operator becomes the resource purchaser.
⠀
The important question is whether operators continue funding useful services.
⠀
A large number of visits can produce modest spending if each interaction is inexpensive.
⠀
A smaller number of resource-intensive workloads can produce more.
⠀
User count alone does not establish computing revenue.
⠀
05 | STABLE PRICING CHANGES THE BURN MATH
⠀
Cycle pricing is anchored to the IMF's SDR.
⠀
That helps keep resource costs from moving directly with ICP's market price.
⠀
It also means token quantity and real spending can diverge.
⠀
At unchanged spending, a lower ICP price generally requires more tokens for the same cycle budget.
⠀
A higher price generally requires fewer.
⠀
Therefore, an increase in ICP destroyed does not automatically prove an equivalent increase in customer expenditure.
⠀
Investors should examine both the token amount and its value at conversion.
⠀
The customer buys computing resources.
⠀
The holder needs to understand how that purchase affects supply.
⠀
06 | THE ISSUANCE SIDE OF THE EQUATION
⠀
The network compensates node providers and governance participants.
⠀
These mechanisms can create new ICP.
⠀
Conversion into cycles and transaction-fee burns reduce supply.
⠀
The net result depends on the relationship between those flows.
⠀
A network can report growing burns while supply continues expanding.
⠀
Likewise, lower issuance can improve supply dynamics without establishing stronger customer demand.
⠀
Both are relevant.
⠀
They answer different questions.
⠀
A simplified framework:
⠀
New tokens issued minus tokens destroyed equals the net change from those mechanisms.
⠀
“ICP burns” describes a feature.
⠀
“ICP is net deflationary” requires measured evidence.
⠀
07 | NODE ECONOMICS NEED UTILIZATION
⠀
Node providers operate the hardware supporting applications.
⠀
Compensating them supports network availability.
⠀
But hardware availability alone does not establish economic efficiency.
⠀
The commercial question is how much useful demand that infrastructure serves.
⠀
Adding capacity can improve resilience and room for growth.
⠀
It can also increase the resources the network must support.
⠀
My assessment:
⠀
Expansion becomes more compelling when retained workloads and external spending justify it.
⠀
The useful measurements include utilization, resource consumption, and the cost of maintaining service.
⠀
Infrastructure scale is an input.
⠀
Productive demand determines the return on that input.
⠀
08 | CAFFEINE EXPANDS THE BUILDER FUNNEL
⠀
Caffeine allows users to create applications through conversation.
⠀
That can reduce the effort required to move from an idea to deployed software.
⠀
But application creation is not the same as application retention.
⠀
A generated project can remain unused.
⠀
A popular project can consume relatively little compute.
⠀
And a subsidized project may stop when support ends.
⠀
The stronger evidence is software that people continue using and someone continues paying to operate.
⠀
AI can increase the number of builders.
⠀
It cannot guarantee that their output becomes commercially useful.
⠀
The funding and retention data matter more than creation counts alone.
⠀
09 | MISSION 70 REQUIRES AN OUTCOME CHECK
⠀
DFINITY's Mission 70 paper targets at least a 70% reduction in ICP inflation by the end of 2026.
⠀
The framework combines supply-side adjustments with demand growth.
⠀
That is an important objective.
⠀
It should not be presented as a completed result without corresponding measurements.
⠀
Governance approval, implementation, and observed supply effects are separate checkpoints.
⠀
The baseline also matters.
⠀
Gross issuance and net supply growth can produce different reduction percentages.
⠀
A useful assessment compares the same measure over consistent periods.
⠀
A target explains the intended direction.
⠀
Onchain outcomes establish how much was delivered.
⠀
10 | THE VALUATION QUESTION
⠀
Using approximately 559.05 million current tokens:
⠀
$5 ICP implies ~$2.80B current-supply valuation.
$10 implies ~$5.59B.
$20 implies ~$11.18B.
$50 implies ~$27.95B.
$100 implies ~$55.91B.
⠀
Applying the recorded $750.73 ATH to today's supply implies approximately $419.7 billion.
⠀
These are valuation illustrations, not price targets.
⠀
Future net issuance or destruction changes the denominator.
⠀
The arithmetic shows why a historical peak is not a simple recovery destination.
⠀
At roughly $1.18 billion, the thesis depends on future utility, demand, and monetary value.
⠀
The drawdown alone cannot establish those expectations.
⠀
11 | THE BULL AND BEAR CASE
⠀
THE BULL CASE:
⠀
Developers maintain applications with retained users.
⠀
AI tools create more useful deployed software.
⠀
Organizations purchase recurring computing resources.
⠀
Infrastructure costs become more efficient.
⠀
And economic reforms improve the balance between issuance and destruction.
⠀
THE BEAR CASE:
⠀
Application creation produces limited repeat usage.
⠀
Customer expenditure remains modest.
⠀
Network compensation exceeds the supply effect of paid demand.
⠀
Competing infrastructure offers a better operating experience.
⠀
And token economics improve less than investors expect.
⠀
Technical differentiation can attract experimentation.
⠀
Sustained paid workloads provide stronger commercial evidence.
⠀
12 | THE FINAL VERDICT
⠀
ICP has an identifiable token-demand mechanism.
⠀
Applications require cycles.
⠀
ICP conversion funds those cycles and destroys tokens.
⠀
The network also provides a broader application-hosting environment.
⠀
But the investment case remains conditional.
⠀
A roughly $1.18 billion market capitalization.
⠀
No fixed maximum supply.
⠀
Continuing network compensation.
⠀
And a need for verified evidence that paid demand is improving the overall economics.
⠀
My assessment:
⠀
ICP is a computing commercialization thesis with a measurable supply-balance test.
⠀
The strongest evidence combines retained workloads, recurring external spending, and efficient participant compensation.
⠀
More applications create possibilities.
⠀
Retained users demonstrate usefulness.
⠀
Funded computing creates expenditure.
⠀
The balance between token destruction and issuance determines the supply outcome.
⠀
A 99.72% drawdown does not prove that balance is favorable.
⠀
Neither does a high transaction count.
⠀
Bookmark this analysis before the next decentralized computing rotation.
⠀
Which would change your view first?
⠀
Stronger recurring compute expenditure or verified improvement in net issuance?
⠀
And can ICP turn useful software into sustainable token demand?
⠀
Drop your view below.
#icp #BTC
1
318
Article
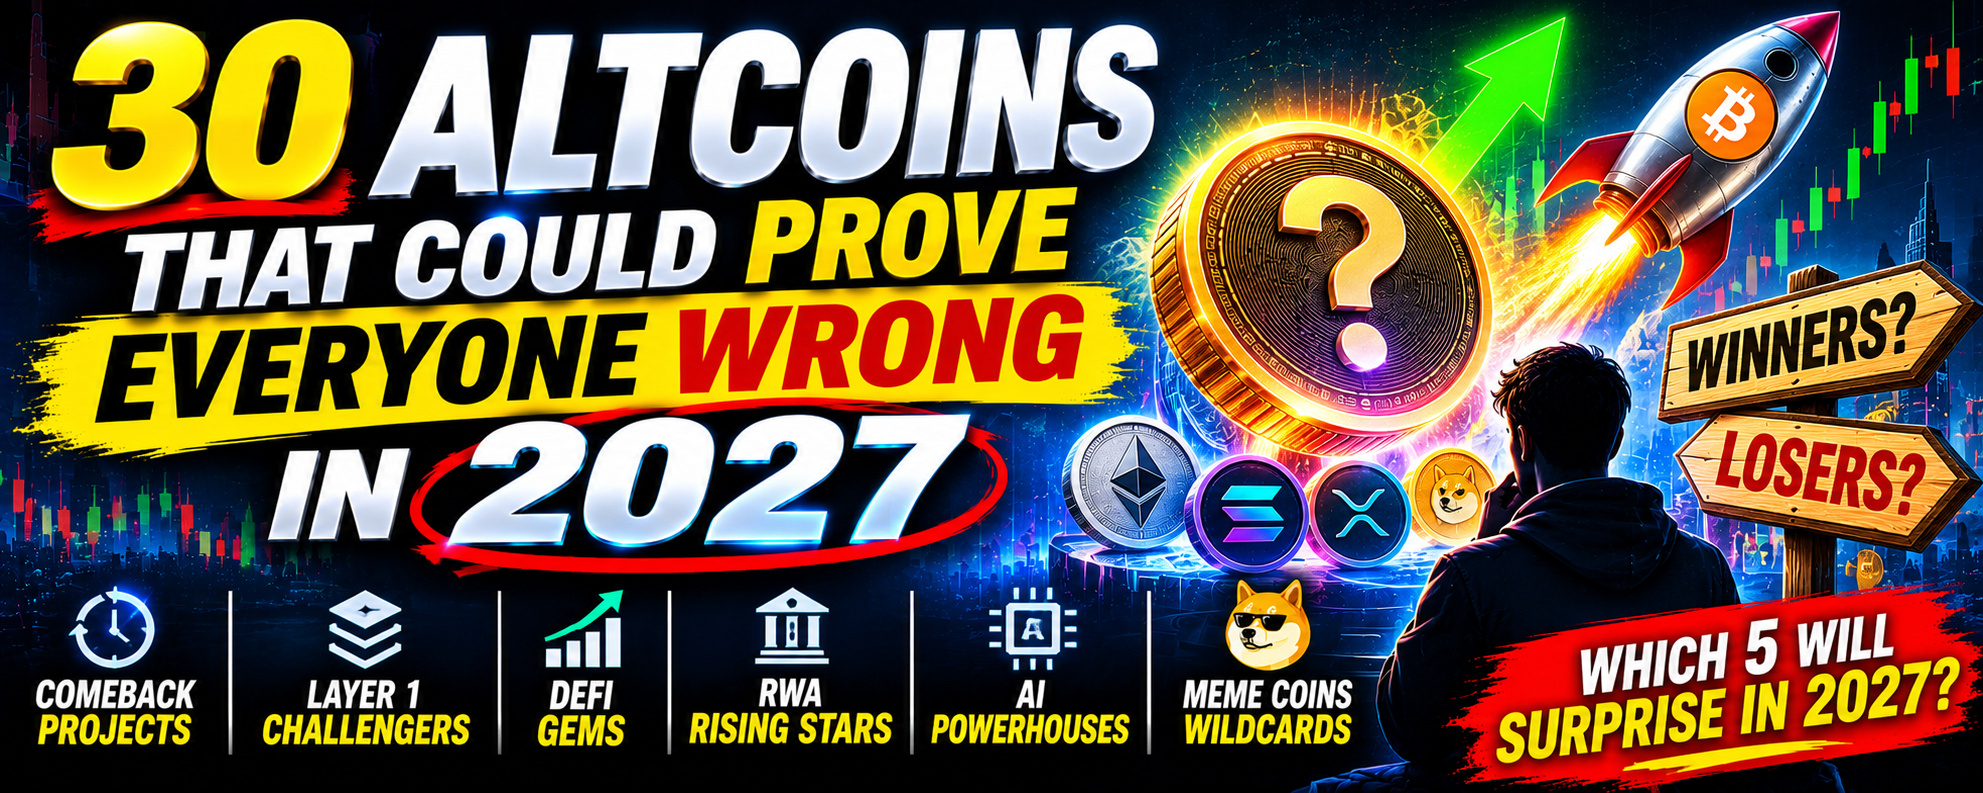
30 ALTCOINS THAT COULD PROVE EVERYONE WRONG IN 2027The market thinks it already knows which altcoins will win.
⠀
But what if it's WRONG?
⠀
Some of today's forgotten projects could stage unexpected comebacks.
⠀
Some of the most popular tokens could struggle to meet expectations.
⠀
And some overlooked ecosystems could become the biggest surprises of 2027.
⠀
Because crypto markets don't reward popularity alone.
⠀
They reward changes in expectations, capital flows, adoption, and demand.
⠀
Here are 30 altcoins that could challenge the market's assumptions in 2027.
⠀
FORGOTTEN GIANTS — THE COMEBACK TEST
$ADA — Can ecosystem development translate into a major revival?
$DOT — Can its evolving infrastructure attract renewed demand?
$ATOM — Can interchain adoption strengthen ATOM's economic role?
$ALGO — Can real-world adoption bring investors back?
$XTZ — Can its technology and ecosystem regain market attention?
⠀
LAYER 1 CHALLENGERS — THE NEXT POWER SHIFT
$SUI — Can ecosystem expansion exceed already high expectations?
$APT — Can sustained adoption change its competitive position?
$SEI — Can trading-focused infrastructure capture meaningful market share?
$AVAX — Can customizable blockchain networks unlock new demand?
$NEAR — Can chain abstraction become a major adoption driver?
⠀
DEFI — THE REVENUE REVOLUTION
$AAVE — Can lending demand strengthen its long-term economic position?
$UNI — Can token economics better reflect the success of its exchange ecosystem?
$MORPHO — Can on-chain lending growth exceed market expectations?
$PENDLE — Can yield trading become a durable financial market?
$CRV — Can stablecoin liquidity demand support a major comeback?
⠀
RWA — THE INSTITUTIONAL ADOPTION TEST
$ONDO — Can tokenized financial products achieve broader adoption?
$LINK — Can oracle and cross-chain infrastructure capture more economic value?
$XLM — Can payment and asset-tokenization demand surprise investors?
$HBAR — Can enterprise activity translate into stronger network economics?
$CFG — Can real-world asset financing generate sustainable token demand?
⠀
AI — HYPE VS. REAL DEMAND
$TAO — Can decentralized AI networks prove their economic value?
$RENDER — Can real GPU demand exceed speculative expectations?
$FET — Can AI agent adoption generate meaningful token utility?
$VIRTUAL — Can its AI ecosystem sustain growth beyond narrative-driven speculation?
$AKT — Can decentralized cloud computing win real customers?
⠀
HIGH-RISK WILDCARDS — EXPECTATIONS VS. REALITY
$DOGE — Can its cultural dominance translate into another major market cycle?
$PEPE — Can community momentum survive changing investor preferences?
$PENGU — Can brand expansion create lasting economic demand?
$WIF — Can speculative attention return despite intense competition?
$BONK — Can ecosystem integration support demand beyond memecoin speculation?
⠀
BUT HERE'S WHAT MOST INVESTORS OVERLOOK:
⠀
A forgotten project isn't automatically undervalued.
⠀
A popular project isn't automatically overvalued.
⠀
And a strong narrative doesn't guarantee strong token performance.
⠀
The biggest surprises often happen when actual results diverge from what investors already expect.
⠀
A struggling ecosystem can recover if adoption improves faster than anticipated.
⠀
A fast-growing project can disappoint if its valuation already assumes exceptional success.
⠀
And a token can outperform even when its underlying project isn't the strongest in its category.
⠀
By 2027, the most important question may not be which project has the best technology.
⠀
It may be which project delivers results that the market hasn't priced in.
⠀
Some of these 30 altcoins could exceed expectations.
⠀
Others may reveal that investor optimism was too aggressive.
⠀
This is an expectations-based watchlist, not a prediction that all 30 projects will outperform.
⠀
Save this list and revisit it in 2027.
⠀
Which FIVE altcoins will prove the market completely wrong in 2027?
⠀
And which popular project do you think investors are expecting too much from?
30 ALTCOINS THAT COULD PROVE EVERYONE WRONG IN 2027
The market thinks it already knows which altcoins will win.
⠀
But what if it's WRONG?
⠀
Some of today's forgotten projects could stage unexpected comebacks.
⠀
Some of the most popular tokens could struggle to meet expectations.
⠀
And some overlooked ecosystems could become the biggest surprises of 2027.
⠀
Because crypto markets don't reward popularity alone.
⠀
They reward changes in expectations, capital flows, adoption, and demand.
⠀
Here are 30 altcoins that could challenge the market's assumptions in 2027.
⠀
FORGOTTEN GIANTS — THE COMEBACK TEST
$ADA — Can ecosystem development translate into a major revival?
$DOT — Can its evolving infrastructure attract renewed demand?
$ATOM — Can interchain adoption strengthen ATOM's economic role?
$ALGO — Can real-world adoption bring investors back?
$XTZ — Can its technology and ecosystem regain market attention?
⠀
LAYER 1 CHALLENGERS — THE NEXT POWER SHIFT
$SUI — Can ecosystem expansion exceed already high expectations?
$APT — Can sustained adoption change its competitive position?
$SEI — Can trading-focused infrastructure capture meaningful market share?
$AVAX — Can customizable blockchain networks unlock new demand?
$NEAR — Can chain abstraction become a major adoption driver?
⠀
DEFI — THE REVENUE REVOLUTION
$AAVE — Can lending demand strengthen its long-term economic position?
$UNI — Can token economics better reflect the success of its exchange ecosystem?
$MORPHO — Can on-chain lending growth exceed market expectations?
$PENDLE — Can yield trading become a durable financial market?
$CRV — Can stablecoin liquidity demand support a major comeback?
⠀
RWA — THE INSTITUTIONAL ADOPTION TEST
$ONDO — Can tokenized financial products achieve broader adoption?
$LINK — Can oracle and cross-chain infrastructure capture more economic value?
$XLM — Can payment and asset-tokenization demand surprise investors?
$HBAR — Can enterprise activity translate into stronger network economics?
$CFG — Can real-world asset financing generate sustainable token demand?
⠀
AI — HYPE VS. REAL DEMAND
$TAO — Can decentralized AI networks prove their economic value?
$RENDER — Can real GPU demand exceed speculative expectations?
$FET — Can AI agent adoption generate meaningful token utility?
$VIRTUAL — Can its AI ecosystem sustain growth beyond narrative-driven speculation?
$AKT — Can decentralized cloud computing win real customers?
⠀
HIGH-RISK WILDCARDS — EXPECTATIONS VS. REALITY
$DOGE — Can its cultural dominance translate into another major market cycle?
$PEPE — Can community momentum survive changing investor preferences?
$PENGU — Can brand expansion create lasting economic demand?
$WIF — Can speculative attention return despite intense competition?
$BONK — Can ecosystem integration support demand beyond memecoin speculation?
⠀
BUT HERE'S WHAT MOST INVESTORS OVERLOOK:
⠀
A forgotten project isn't automatically undervalued.
⠀
A popular project isn't automatically overvalued.
⠀
And a strong narrative doesn't guarantee strong token performance.
⠀
The biggest surprises often happen when actual results diverge from what investors already expect.
⠀
A struggling ecosystem can recover if adoption improves faster than anticipated.
⠀
A fast-growing project can disappoint if its valuation already assumes exceptional success.
⠀
And a token can outperform even when its underlying project isn't the strongest in its category.
⠀
By 2027, the most important question may not be which project has the best technology.
⠀
It may be which project delivers results that the market hasn't priced in.
⠀
Some of these 30 altcoins could exceed expectations.
⠀
Others may reveal that investor optimism was too aggressive.
⠀
This is an expectations-based watchlist, not a prediction that all 30 projects will outperform.
⠀
Save this list and revisit it in 2027.
⠀
Which FIVE altcoins will prove the market completely wrong in 2027?
⠀
And which popular project do you think investors are expecting too much from?
⠀
But what if it's WRONG?
⠀
Some of today's forgotten projects could stage unexpected comebacks.
⠀
Some of the most popular tokens could struggle to meet expectations.
⠀
And some overlooked ecosystems could become the biggest surprises of 2027.
⠀
Because crypto markets don't reward popularity alone.
⠀
They reward changes in expectations, capital flows, adoption, and demand.
⠀
Here are 30 altcoins that could challenge the market's assumptions in 2027.
⠀
FORGOTTEN GIANTS — THE COMEBACK TEST
$ADA — Can ecosystem development translate into a major revival?
$DOT — Can its evolving infrastructure attract renewed demand?
$ATOM — Can interchain adoption strengthen ATOM's economic role?
$ALGO — Can real-world adoption bring investors back?
$XTZ — Can its technology and ecosystem regain market attention?
⠀
LAYER 1 CHALLENGERS — THE NEXT POWER SHIFT
$SUI — Can ecosystem expansion exceed already high expectations?
$APT — Can sustained adoption change its competitive position?
$SEI — Can trading-focused infrastructure capture meaningful market share?
$AVAX — Can customizable blockchain networks unlock new demand?
$NEAR — Can chain abstraction become a major adoption driver?
⠀
DEFI — THE REVENUE REVOLUTION
$AAVE — Can lending demand strengthen its long-term economic position?
$UNI — Can token economics better reflect the success of its exchange ecosystem?
$MORPHO — Can on-chain lending growth exceed market expectations?
$PENDLE — Can yield trading become a durable financial market?
$CRV — Can stablecoin liquidity demand support a major comeback?
⠀
RWA — THE INSTITUTIONAL ADOPTION TEST
$ONDO — Can tokenized financial products achieve broader adoption?
$LINK — Can oracle and cross-chain infrastructure capture more economic value?
$XLM — Can payment and asset-tokenization demand surprise investors?
$HBAR — Can enterprise activity translate into stronger network economics?
$CFG — Can real-world asset financing generate sustainable token demand?
⠀
AI — HYPE VS. REAL DEMAND
$TAO — Can decentralized AI networks prove their economic value?
$RENDER — Can real GPU demand exceed speculative expectations?
$FET — Can AI agent adoption generate meaningful token utility?
$VIRTUAL — Can its AI ecosystem sustain growth beyond narrative-driven speculation?
$AKT — Can decentralized cloud computing win real customers?
⠀
HIGH-RISK WILDCARDS — EXPECTATIONS VS. REALITY
$DOGE — Can its cultural dominance translate into another major market cycle?
$PEPE — Can community momentum survive changing investor preferences?
$PENGU — Can brand expansion create lasting economic demand?
$WIF — Can speculative attention return despite intense competition?
$BONK — Can ecosystem integration support demand beyond memecoin speculation?
⠀
BUT HERE'S WHAT MOST INVESTORS OVERLOOK:
⠀
A forgotten project isn't automatically undervalued.
⠀
A popular project isn't automatically overvalued.
⠀
And a strong narrative doesn't guarantee strong token performance.
⠀
The biggest surprises often happen when actual results diverge from what investors already expect.
⠀
A struggling ecosystem can recover if adoption improves faster than anticipated.
⠀
A fast-growing project can disappoint if its valuation already assumes exceptional success.
⠀
And a token can outperform even when its underlying project isn't the strongest in its category.
⠀
By 2027, the most important question may not be which project has the best technology.
⠀
It may be which project delivers results that the market hasn't priced in.
⠀
Some of these 30 altcoins could exceed expectations.
⠀
Others may reveal that investor optimism was too aggressive.
⠀
This is an expectations-based watchlist, not a prediction that all 30 projects will outperform.
⠀
Save this list and revisit it in 2027.
⠀
Which FIVE altcoins will prove the market completely wrong in 2027?
⠀
And which popular project do you think investors are expecting too much from?
3
3
1.8k
Verified
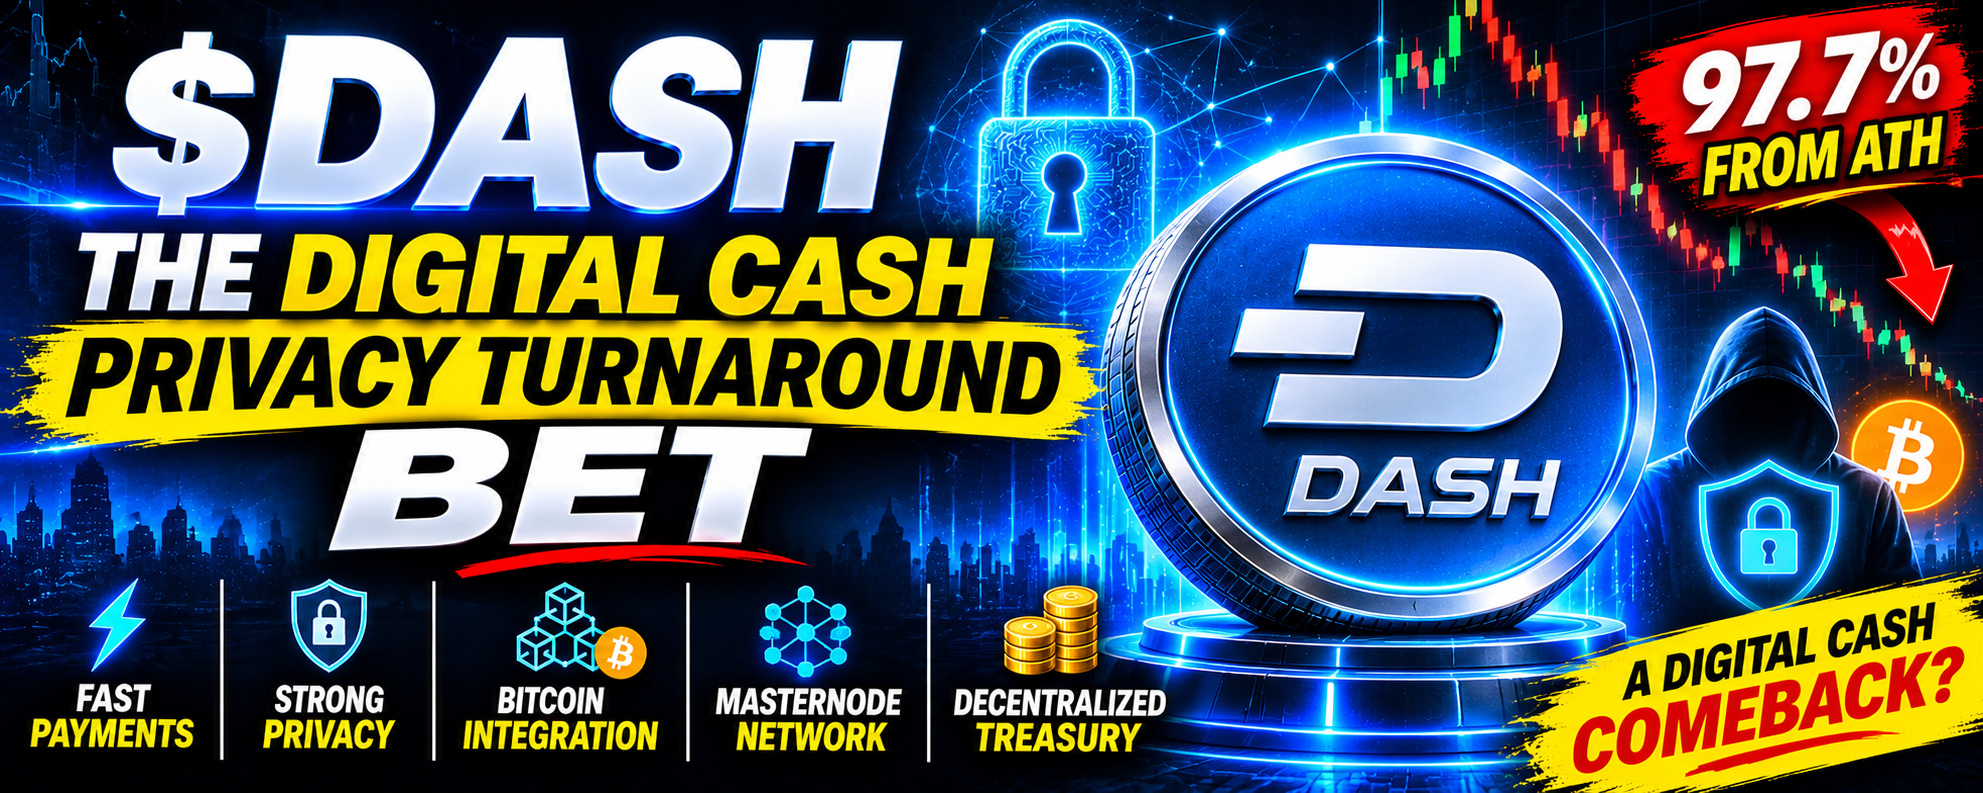
Article
👀$DASH — THE DIGITAL CASH PRIVACY TURNAROUND BETA roughly $480 MILLION cryptocurrency.
⠀
Fewer than 13 MILLION coins circulating.
⠀
A payment network combining miners, masternodes, and a development treasury.
⠀
And a coin trading approximately 97.7% below its all-time high.
⠀
But here's the contradiction.
⠀
Dash has spent years building digital cash infrastructure.
⠀
Useful payment features still need users who repeatedly choose them.
⠀
Is $DASH an overlooked payments and privacy turnaround?
⠀
Or does an established network still struggle to create lasting monetary demand?
⠀
Let's examine the numbers.
⠀
01 | WHAT IS DASH?
⠀
Dash is a payments-focused cryptocurrency.
⠀
Its Core network combines proof-of-work mining with a second tier of masternodes.
⠀
InstantSend supports rapid transaction locking.
⠀
ChainLocks adds quorum-based protection against blockchain reorganizations.
⠀
The investment thesis is that digital cash should be fast, usable, and resilient.
⠀
But those qualities do not automatically establish an advantage customers will pay for.
⠀
Users already have alternatives.
⠀
The relevant question is why someone chooses DASH repeatedly, rather than merely testing a wallet.
⠀
Technical functionality creates an option.
⠀
Retained usage gives that option economic significance.
⠀
02 | THE NUMBERS THAT MATTER
⠀
November 19, 2026 snapshot:
⠀
DASH Price: ~$37.24
Market Cap: ~$480.43M
Reported FDV: ~$703.99M
Circulating Supply: ~12.898M DASH
Reported Current Total Supply: ~12.898M DASH
Tracker Maximum Supply: 18.9M DASH
Circulating / Tracker Maximum: ~68.2%
24H DASH Trading Volume: ~$42.23M
All-Time High: ~$1,642.22
Decline From ATH: ~97.7%
⠀
SUPPLY AND NETWORK FRAMEWORK:
⠀
Official documentation describes approximately 17.74M–18.92M eventual supply.
⠀
Budget utilization affects the final amount.
⠀
The documented block subsidy declines approximately 7.14% per year.
⠀
A regular masternode requires 1,000 DASH in collateral.
⠀
At the snapshot price, that represents approximately $37,240.
⠀
Exchange volume is not merchant payment volume.
⠀
Current total supply is not the same as final lifetime supply.
⠀
Those distinctions matter more than the unit price.
⠀
03 | PAYMENTS NEED MORE THAN SPEED
⠀
Fast confirmation improves the payment experience.
⠀
It does not solve every problem involved in spending cryptocurrency.
⠀
A customer still needs access to DASH.
⠀
A merchant needs reliable acceptance and settlement.
⠀
Both need a reason to prefer that process.
⠀
A volatile payment asset also creates a practical question:
⠀
How much exposure do users actually want to hold between transactions?
⠀
A network can facilitate payments while users minimize the time they hold its coin.
⠀
Therefore, rising payment activity does not guarantee proportional growth in monetary demand.
⠀
The stronger evidence is recurring usage alongside durable demand to hold or deploy DASH.
⠀
04 | THE PRIVACY THESIS HAS CHANGED
⠀
Dash's established Core privacy feature is CoinJoin.
⠀
That should not be confused with making every Core transaction confidential by default.
⠀
The newer development is Evolution.
⠀
An August 4 official announcement reported shielded transactions live on the Evolution mainnet, using Orchard-based zero-knowledge technology.
⠀
This materially updates the old description of Dash as offering only transaction mixing.
⠀
However, Core transactions, CoinJoin, and Evolution shielded activity remain distinct.
⠀
Investors should examine which payment path a wallet actually supports.
⠀
A privacy label is too broad to explain the implementation.
⠀
The user experience depends on the specific product.
⠀
05 | PRIVACY CAPABILITY IS NOT PRIVACY ADOPTION
⠀
Shipping confidential transactions is a technical milestone.
⠀
Commercial adoption requires additional evidence.
⠀
Are wallets making the feature accessible?
⠀
Do users return?
⠀
Can people fund and exit the system conveniently?
⠀
And does the experience remain usable under realistic conditions?
⠀
The August announcement itself distinguished mainnet availability from wallet support.
⠀
That illustrates why a network release should not be treated as universal product availability.
⠀
The investment case improves when confidential payments become a repeatable user habit.
⠀
A capability can be important without immediately changing the economics.
⠀
06 | WHAT MASTERNODE REWARDS REPRESENT
⠀
Masternodes provide network services and receive compensation.
⠀
They also participate in governance.
⠀
Collateral creates an incentive to maintain a valuable network.
⠀
But masternode income is not automatically profit funded by external customers.
⠀
It includes protocol subsidy.
⠀
An operator must also account for infrastructure expenses and the value of the collateral.
⠀
More DASH received can coexist with a decline in the position's dollar value.
⠀
Likewise, collateral is not permanently destroyed.
⠀
Official documentation states that moving it stops the node's participation and payments.
⠀
Investors should separate service compensation, operating costs, and total investment return.
⠀
A reward percentage cannot answer all three questions.
⠀
07 | THE TREASURY MODEL
⠀
Dash allocates part of its subsidy to a decentralized budget system.
⠀
The documented framework is approximately:
⠀
20% for miners.
⠀
60% for masternode rewards, including the Platform allocation.
⠀
20% for the governance budget.
⠀
Actual issuance depends partly on budget utilization.
⠀
This creates a recurring mechanism to fund development and ecosystem work.
⠀
It also creates a capital-allocation obligation.
⠀
Funding a proposal is an expense or investment by the network.
⠀
It is not evidence that the funded activity produced equivalent economic value.
⠀
The relevant questions are what was delivered, how much it cost, and whether users stayed.
⠀
Self-funding provides continuity.
⠀
Accountability determines its effectiveness.
⠀
08 | THE EVOLUTION EXPANSION
⠀
Dash Platform extends the project beyond basic coin transfers.
⠀
The Platform 5.0 release announcement described shielded token pools, application monetization, and expanded data-contract functionality.
⠀
That broadens the potential product set.
⠀
It also changes what investors need to monitor.
⠀
A release is different from activation.
⠀
Activation is different from wallet integration.
⠀
And integration is different from sustained usage.
⠀
The published 5.0 rollout explicitly depended on evonode signaling and epoch boundaries.
⠀
That is why a planned release date alone cannot prove every advertised capability is widely available.
⠀
The commercial test is whether applications attract recurring customers.
⠀
09 | THE NEXT PRODUCT TEST
⠀
The official roadmap listed further work on private contact requests, username payments, and application infrastructure.
⠀
Those directions address a real usability issue:
⠀
People generally prefer recognizable payment experiences to managing long addresses.
⠀
But roadmaps describe intended development.
⠀
They do not establish shipped functionality or adoption.
⠀
Investors should look for live releases, supported wallets, and repeat usage.
⠀
The most useful progress is a complete payment journey that works consistently.
⠀
A username can simplify the interface.
⠀
It cannot, by itself, create a reason to choose DASH over an existing payment method.
⠀
10 | THE VALUATION QUESTION
⠀
Using approximately 12.898 million current coins:
⠀
$50 DASH implies ~$645M current-supply valuation.
$100 implies ~$1.29B.
$250 implies ~$3.22B.
$500 implies ~$6.45B.
⠀
A return to $1,642.22 would imply approximately $21.18 billion.
⠀
These are valuation illustrations, not price targets.
⠀
Future issuance increases the denominator.
⠀
An old price peak therefore cannot be treated as a simple recovery destination.
⠀
The current thesis needs assumptions about monetary demand, payment adoption, and competitive relevance.
⠀
A low coin count does not make the asset inexpensive.
⠀
Scarcity matters only alongside demand.
⠀
11 | THE BULL AND BEAR CASE
⠀
THE BULL CASE:
⠀
Dash turns its payment features into recurring usage.
⠀
Evolution makes confidential transactions easier to access.
⠀
Applications create additional reasons to use the network.
⠀
Treasury spending produces measurable results.
⠀
And demand grows faster than circulating supply.
⠀
THE BEAR CASE:
⠀
Users prefer alternatives with stronger distribution.
⠀
Privacy capabilities attract attention but limited repeat activity.
⠀
Masternode incentives remain heavily dependent on subsidy.
⠀
Development funding produces insufficient commercial traction.
⠀
And the legacy brand fails to regain relevance.
⠀
Longevity demonstrates persistence.
⠀
It does not guarantee future market share.
⠀
12 | THE FINAL VERDICT
⠀
Dash has identifiable strengths.
⠀
Rapid payment functionality.
⠀
An established masternode system.
⠀
A recurring development budget.
⠀
And newer shielded capabilities on Evolution.
⠀
But the investment case remains conditional.
⠀
A roughly $480 million market capitalization.
⠀
Approximately $704 million in reported fully diluted value.
⠀
Continuing issuance.
⠀
And a need to prove that product development translates into sustained demand.
⠀
My assessment:
⠀
DASH is a digital cash and privacy turnaround thesis.
⠀
The decisive evidence is a growing group of users choosing it repeatedly because the experience solves a meaningful problem.
⠀
More features create possibilities.
⠀
Better wallets reduce friction.
⠀
Recurring payments demonstrate usefulness.
⠀
Durable demand determines the monetary value.
⠀
A 97.7% drawdown describes the distance from an old peak.
⠀
It does not establish how much of that value should return.
⠀
Bookmark this analysis before the next payments and privacy rotation.
⠀
Which has the strongest long-term digital cash thesis?
⠀
$DASH , $LTC , or $XMR ?
⠀
And can Dash turn its Evolution upgrades into lasting user demand?
⠀
Drop your view below.
{future}(DASHUSDT)
{future}(LTCUSDT)
{future}(XMRUSDT)
#DASH/USDT
👀$DASH — THE DIGITAL CASH PRIVACY TURNAROUND BET
A roughly $480 MILLION cryptocurrency.
⠀
Fewer than 13 MILLION coins circulating.
⠀
A payment network combining miners, masternodes, and a development treasury.
⠀
And a coin trading approximately 97.7% below its all-time high.
⠀
But here's the contradiction.
⠀
Dash has spent years building digital cash infrastructure.
⠀
Useful payment features still need users who repeatedly choose them.
⠀
Is $DASH an overlooked payments and privacy turnaround?
⠀
Or does an established network still struggle to create lasting monetary demand?
⠀
Let's examine the numbers.
⠀
01 | WHAT IS DASH?
⠀
Dash is a payments-focused cryptocurrency.
⠀
Its Core network combines proof-of-work mining with a second tier of masternodes.
⠀
InstantSend supports rapid transaction locking.
⠀
ChainLocks adds quorum-based protection against blockchain reorganizations.
⠀
The investment thesis is that digital cash should be fast, usable, and resilient.
⠀
But those qualities do not automatically establish an advantage customers will pay for.
⠀
Users already have alternatives.
⠀
The relevant question is why someone chooses DASH repeatedly, rather than merely testing a wallet.
⠀
Technical functionality creates an option.
⠀
Retained usage gives that option economic significance.
⠀
02 | THE NUMBERS THAT MATTER
⠀
November 19, 2026 snapshot:
⠀
DASH Price: ~$37.24
Market Cap: ~$480.43M
Reported FDV: ~$703.99M
Circulating Supply: ~12.898M DASH
Reported Current Total Supply: ~12.898M DASH
Tracker Maximum Supply: 18.9M DASH
Circulating / Tracker Maximum: ~68.2%
24H DASH Trading Volume: ~$42.23M
All-Time High: ~$1,642.22
Decline From ATH: ~97.7%
⠀
SUPPLY AND NETWORK FRAMEWORK:
⠀
Official documentation describes approximately 17.74M–18.92M eventual supply.
⠀
Budget utilization affects the final amount.
⠀
The documented block subsidy declines approximately 7.14% per year.
⠀
A regular masternode requires 1,000 DASH in collateral.
⠀
At the snapshot price, that represents approximately $37,240.
⠀
Exchange volume is not merchant payment volume.
⠀
Current total supply is not the same as final lifetime supply.
⠀
Those distinctions matter more than the unit price.
⠀
03 | PAYMENTS NEED MORE THAN SPEED
⠀
Fast confirmation improves the payment experience.
⠀
It does not solve every problem involved in spending cryptocurrency.
⠀
A customer still needs access to DASH.
⠀
A merchant needs reliable acceptance and settlement.
⠀
Both need a reason to prefer that process.
⠀
A volatile payment asset also creates a practical question:
⠀
How much exposure do users actually want to hold between transactions?
⠀
A network can facilitate payments while users minimize the time they hold its coin.
⠀
Therefore, rising payment activity does not guarantee proportional growth in monetary demand.
⠀
The stronger evidence is recurring usage alongside durable demand to hold or deploy DASH.
⠀
04 | THE PRIVACY THESIS HAS CHANGED
⠀
Dash's established Core privacy feature is CoinJoin.
⠀
That should not be confused with making every Core transaction confidential by default.
⠀
The newer development is Evolution.
⠀
An August 4 official announcement reported shielded transactions live on the Evolution mainnet, using Orchard-based zero-knowledge technology.
⠀
This materially updates the old description of Dash as offering only transaction mixing.
⠀
However, Core transactions, CoinJoin, and Evolution shielded activity remain distinct.
⠀
Investors should examine which payment path a wallet actually supports.
⠀
A privacy label is too broad to explain the implementation.
⠀
The user experience depends on the specific product.
⠀
05 | PRIVACY CAPABILITY IS NOT PRIVACY ADOPTION
⠀
Shipping confidential transactions is a technical milestone.
⠀
Commercial adoption requires additional evidence.
⠀
Are wallets making the feature accessible?
⠀
Do users return?
⠀
Can people fund and exit the system conveniently?
⠀
And does the experience remain usable under realistic conditions?
⠀
The August announcement itself distinguished mainnet availability from wallet support.
⠀
That illustrates why a network release should not be treated as universal product availability.
⠀
The investment case improves when confidential payments become a repeatable user habit.
⠀
A capability can be important without immediately changing the economics.
⠀
06 | WHAT MASTERNODE REWARDS REPRESENT
⠀
Masternodes provide network services and receive compensation.
⠀
They also participate in governance.
⠀
Collateral creates an incentive to maintain a valuable network.
⠀
But masternode income is not automatically profit funded by external customers.
⠀
It includes protocol subsidy.
⠀
An operator must also account for infrastructure expenses and the value of the collateral.
⠀
More DASH received can coexist with a decline in the position's dollar value.
⠀
Likewise, collateral is not permanently destroyed.
⠀
Official documentation states that moving it stops the node's participation and payments.
⠀
Investors should separate service compensation, operating costs, and total investment return.
⠀
A reward percentage cannot answer all three questions.
⠀
07 | THE TREASURY MODEL
⠀
Dash allocates part of its subsidy to a decentralized budget system.
⠀
The documented framework is approximately:
⠀
20% for miners.
⠀
60% for masternode rewards, including the Platform allocation.
⠀
20% for the governance budget.
⠀
Actual issuance depends partly on budget utilization.
⠀
This creates a recurring mechanism to fund development and ecosystem work.
⠀
It also creates a capital-allocation obligation.
⠀
Funding a proposal is an expense or investment by the network.
⠀
It is not evidence that the funded activity produced equivalent economic value.
⠀
The relevant questions are what was delivered, how much it cost, and whether users stayed.
⠀
Self-funding provides continuity.
⠀
Accountability determines its effectiveness.
⠀
08 | THE EVOLUTION EXPANSION
⠀
Dash Platform extends the project beyond basic coin transfers.
⠀
The Platform 5.0 release announcement described shielded token pools, application monetization, and expanded data-contract functionality.
⠀
That broadens the potential product set.
⠀
It also changes what investors need to monitor.
⠀
A release is different from activation.
⠀
Activation is different from wallet integration.
⠀
And integration is different from sustained usage.
⠀
The published 5.0 rollout explicitly depended on evonode signaling and epoch boundaries.
⠀
That is why a planned release date alone cannot prove every advertised capability is widely available.
⠀
The commercial test is whether applications attract recurring customers.
⠀
09 | THE NEXT PRODUCT TEST
⠀
The official roadmap listed further work on private contact requests, username payments, and application infrastructure.
⠀
Those directions address a real usability issue:
⠀
People generally prefer recognizable payment experiences to managing long addresses.
⠀
But roadmaps describe intended development.
⠀
They do not establish shipped functionality or adoption.
⠀
Investors should look for live releases, supported wallets, and repeat usage.
⠀
The most useful progress is a complete payment journey that works consistently.
⠀
A username can simplify the interface.
⠀
It cannot, by itself, create a reason to choose DASH over an existing payment method.
⠀
10 | THE VALUATION QUESTION
⠀
Using approximately 12.898 million current coins:
⠀
$50 DASH implies ~$645M current-supply valuation.
$100 implies ~$1.29B.
$250 implies ~$3.22B.
$500 implies ~$6.45B.
⠀
A return to $1,642.22 would imply approximately $21.18 billion.
⠀
These are valuation illustrations, not price targets.
⠀
Future issuance increases the denominator.
⠀
An old price peak therefore cannot be treated as a simple recovery destination.
⠀
The current thesis needs assumptions about monetary demand, payment adoption, and competitive relevance.
⠀
A low coin count does not make the asset inexpensive.
⠀
Scarcity matters only alongside demand.
⠀
11 | THE BULL AND BEAR CASE
⠀
THE BULL CASE:
⠀
Dash turns its payment features into recurring usage.
⠀
Evolution makes confidential transactions easier to access.
⠀
Applications create additional reasons to use the network.
⠀
Treasury spending produces measurable results.
⠀
And demand grows faster than circulating supply.
⠀
THE BEAR CASE:
⠀
Users prefer alternatives with stronger distribution.
⠀
Privacy capabilities attract attention but limited repeat activity.
⠀
Masternode incentives remain heavily dependent on subsidy.
⠀
Development funding produces insufficient commercial traction.
⠀
And the legacy brand fails to regain relevance.
⠀
Longevity demonstrates persistence.
⠀
It does not guarantee future market share.
⠀
12 | THE FINAL VERDICT
⠀
Dash has identifiable strengths.
⠀
Rapid payment functionality.
⠀
An established masternode system.
⠀
A recurring development budget.
⠀
And newer shielded capabilities on Evolution.
⠀
But the investment case remains conditional.
⠀
A roughly $480 million market capitalization.
⠀
Approximately $704 million in reported fully diluted value.
⠀
Continuing issuance.
⠀
And a need to prove that product development translates into sustained demand.
⠀
My assessment:
⠀
DASH is a digital cash and privacy turnaround thesis.
⠀
The decisive evidence is a growing group of users choosing it repeatedly because the experience solves a meaningful problem.
⠀
More features create possibilities.
⠀
Better wallets reduce friction.
⠀
Recurring payments demonstrate usefulness.
⠀
Durable demand determines the monetary value.
⠀
A 97.7% drawdown describes the distance from an old peak.
⠀
It does not establish how much of that value should return.
⠀
Bookmark this analysis before the next payments and privacy rotation.
⠀
Which has the strongest long-term digital cash thesis?
⠀
$DASH , $LTC , or $XMR ?
⠀
And can Dash turn its Evolution upgrades into lasting user demand?
⠀
Drop your view below.
#DASH/USDT
⠀
Fewer than 13 MILLION coins circulating.
⠀
A payment network combining miners, masternodes, and a development treasury.
⠀
And a coin trading approximately 97.7% below its all-time high.
⠀
But here's the contradiction.
⠀
Dash has spent years building digital cash infrastructure.
⠀
Useful payment features still need users who repeatedly choose them.
⠀
Is $DASH an overlooked payments and privacy turnaround?
⠀
Or does an established network still struggle to create lasting monetary demand?
⠀
Let's examine the numbers.
⠀
01 | WHAT IS DASH?
⠀
Dash is a payments-focused cryptocurrency.
⠀
Its Core network combines proof-of-work mining with a second tier of masternodes.
⠀
InstantSend supports rapid transaction locking.
⠀
ChainLocks adds quorum-based protection against blockchain reorganizations.
⠀
The investment thesis is that digital cash should be fast, usable, and resilient.
⠀
But those qualities do not automatically establish an advantage customers will pay for.
⠀
Users already have alternatives.
⠀
The relevant question is why someone chooses DASH repeatedly, rather than merely testing a wallet.
⠀
Technical functionality creates an option.
⠀
Retained usage gives that option economic significance.
⠀
02 | THE NUMBERS THAT MATTER
⠀
November 19, 2026 snapshot:
⠀
DASH Price: ~$37.24
Market Cap: ~$480.43M
Reported FDV: ~$703.99M
Circulating Supply: ~12.898M DASH
Reported Current Total Supply: ~12.898M DASH
Tracker Maximum Supply: 18.9M DASH
Circulating / Tracker Maximum: ~68.2%
24H DASH Trading Volume: ~$42.23M
All-Time High: ~$1,642.22
Decline From ATH: ~97.7%
⠀
SUPPLY AND NETWORK FRAMEWORK:
⠀
Official documentation describes approximately 17.74M–18.92M eventual supply.
⠀
Budget utilization affects the final amount.
⠀
The documented block subsidy declines approximately 7.14% per year.
⠀
A regular masternode requires 1,000 DASH in collateral.
⠀
At the snapshot price, that represents approximately $37,240.
⠀
Exchange volume is not merchant payment volume.
⠀
Current total supply is not the same as final lifetime supply.
⠀
Those distinctions matter more than the unit price.
⠀
03 | PAYMENTS NEED MORE THAN SPEED
⠀
Fast confirmation improves the payment experience.
⠀
It does not solve every problem involved in spending cryptocurrency.
⠀
A customer still needs access to DASH.
⠀
A merchant needs reliable acceptance and settlement.
⠀
Both need a reason to prefer that process.
⠀
A volatile payment asset also creates a practical question:
⠀
How much exposure do users actually want to hold between transactions?
⠀
A network can facilitate payments while users minimize the time they hold its coin.
⠀
Therefore, rising payment activity does not guarantee proportional growth in monetary demand.
⠀
The stronger evidence is recurring usage alongside durable demand to hold or deploy DASH.
⠀
04 | THE PRIVACY THESIS HAS CHANGED
⠀
Dash's established Core privacy feature is CoinJoin.
⠀
That should not be confused with making every Core transaction confidential by default.
⠀
The newer development is Evolution.
⠀
An August 4 official announcement reported shielded transactions live on the Evolution mainnet, using Orchard-based zero-knowledge technology.
⠀
This materially updates the old description of Dash as offering only transaction mixing.
⠀
However, Core transactions, CoinJoin, and Evolution shielded activity remain distinct.
⠀
Investors should examine which payment path a wallet actually supports.
⠀
A privacy label is too broad to explain the implementation.
⠀
The user experience depends on the specific product.
⠀
05 | PRIVACY CAPABILITY IS NOT PRIVACY ADOPTION
⠀
Shipping confidential transactions is a technical milestone.
⠀
Commercial adoption requires additional evidence.
⠀
Are wallets making the feature accessible?
⠀
Do users return?
⠀
Can people fund and exit the system conveniently?
⠀
And does the experience remain usable under realistic conditions?
⠀
The August announcement itself distinguished mainnet availability from wallet support.
⠀
That illustrates why a network release should not be treated as universal product availability.
⠀
The investment case improves when confidential payments become a repeatable user habit.
⠀
A capability can be important without immediately changing the economics.
⠀
06 | WHAT MASTERNODE REWARDS REPRESENT
⠀
Masternodes provide network services and receive compensation.
⠀
They also participate in governance.
⠀
Collateral creates an incentive to maintain a valuable network.
⠀
But masternode income is not automatically profit funded by external customers.
⠀
It includes protocol subsidy.
⠀
An operator must also account for infrastructure expenses and the value of the collateral.
⠀
More DASH received can coexist with a decline in the position's dollar value.
⠀
Likewise, collateral is not permanently destroyed.
⠀
Official documentation states that moving it stops the node's participation and payments.
⠀
Investors should separate service compensation, operating costs, and total investment return.
⠀
A reward percentage cannot answer all three questions.
⠀
07 | THE TREASURY MODEL
⠀
Dash allocates part of its subsidy to a decentralized budget system.
⠀
The documented framework is approximately:
⠀
20% for miners.
⠀
60% for masternode rewards, including the Platform allocation.
⠀
20% for the governance budget.
⠀
Actual issuance depends partly on budget utilization.
⠀
This creates a recurring mechanism to fund development and ecosystem work.
⠀
It also creates a capital-allocation obligation.
⠀
Funding a proposal is an expense or investment by the network.
⠀
It is not evidence that the funded activity produced equivalent economic value.
⠀
The relevant questions are what was delivered, how much it cost, and whether users stayed.
⠀
Self-funding provides continuity.
⠀
Accountability determines its effectiveness.
⠀
08 | THE EVOLUTION EXPANSION
⠀
Dash Platform extends the project beyond basic coin transfers.
⠀
The Platform 5.0 release announcement described shielded token pools, application monetization, and expanded data-contract functionality.
⠀
That broadens the potential product set.
⠀
It also changes what investors need to monitor.
⠀
A release is different from activation.
⠀
Activation is different from wallet integration.
⠀
And integration is different from sustained usage.
⠀
The published 5.0 rollout explicitly depended on evonode signaling and epoch boundaries.
⠀
That is why a planned release date alone cannot prove every advertised capability is widely available.
⠀
The commercial test is whether applications attract recurring customers.
⠀
09 | THE NEXT PRODUCT TEST
⠀
The official roadmap listed further work on private contact requests, username payments, and application infrastructure.
⠀
Those directions address a real usability issue:
⠀
People generally prefer recognizable payment experiences to managing long addresses.
⠀
But roadmaps describe intended development.
⠀
They do not establish shipped functionality or adoption.
⠀
Investors should look for live releases, supported wallets, and repeat usage.
⠀
The most useful progress is a complete payment journey that works consistently.
⠀
A username can simplify the interface.
⠀
It cannot, by itself, create a reason to choose DASH over an existing payment method.
⠀
10 | THE VALUATION QUESTION
⠀
Using approximately 12.898 million current coins:
⠀
$50 DASH implies ~$645M current-supply valuation.
$100 implies ~$1.29B.
$250 implies ~$3.22B.
$500 implies ~$6.45B.
⠀
A return to $1,642.22 would imply approximately $21.18 billion.
⠀
These are valuation illustrations, not price targets.
⠀
Future issuance increases the denominator.
⠀
An old price peak therefore cannot be treated as a simple recovery destination.
⠀
The current thesis needs assumptions about monetary demand, payment adoption, and competitive relevance.
⠀
A low coin count does not make the asset inexpensive.
⠀
Scarcity matters only alongside demand.
⠀
11 | THE BULL AND BEAR CASE
⠀
THE BULL CASE:
⠀
Dash turns its payment features into recurring usage.
⠀
Evolution makes confidential transactions easier to access.
⠀
Applications create additional reasons to use the network.
⠀
Treasury spending produces measurable results.
⠀
And demand grows faster than circulating supply.
⠀
THE BEAR CASE:
⠀
Users prefer alternatives with stronger distribution.
⠀
Privacy capabilities attract attention but limited repeat activity.
⠀
Masternode incentives remain heavily dependent on subsidy.
⠀
Development funding produces insufficient commercial traction.
⠀
And the legacy brand fails to regain relevance.
⠀
Longevity demonstrates persistence.
⠀
It does not guarantee future market share.
⠀
12 | THE FINAL VERDICT
⠀
Dash has identifiable strengths.
⠀
Rapid payment functionality.
⠀
An established masternode system.
⠀
A recurring development budget.
⠀
And newer shielded capabilities on Evolution.
⠀
But the investment case remains conditional.
⠀
A roughly $480 million market capitalization.
⠀
Approximately $704 million in reported fully diluted value.
⠀
Continuing issuance.
⠀
And a need to prove that product development translates into sustained demand.
⠀
My assessment:
⠀
DASH is a digital cash and privacy turnaround thesis.
⠀
The decisive evidence is a growing group of users choosing it repeatedly because the experience solves a meaningful problem.
⠀
More features create possibilities.
⠀
Better wallets reduce friction.
⠀
Recurring payments demonstrate usefulness.
⠀
Durable demand determines the monetary value.
⠀
A 97.7% drawdown describes the distance from an old peak.
⠀
It does not establish how much of that value should return.
⠀
Bookmark this analysis before the next payments and privacy rotation.
⠀
Which has the strongest long-term digital cash thesis?
⠀
$DASH , $LTC , or $XMR ?
⠀
And can Dash turn its Evolution upgrades into lasting user demand?
⠀
Drop your view below.
#DASH/USDT
1
3
1.5k

Article
🚨$WLD — THE PROOF OF HUMAN MONETIZATION BETA roughly $1 BILLION cryptocurrency.
⠀
Approximately 3.79 BILLION tokens circulating.
⠀
Around 2.9 MILLION tokens unlocking daily under the published schedule.
⠀
And a token trading approximately 97.8% below its all-time high.
⠀
But here's the contradiction.
⠀
Proving that someone is human could become valuable internet infrastructure.
⠀
That does not automatically make the associated token a valuable investment.
⠀
Is $WLD an overlooked bet on identity in an AI-driven world?
{future}(WLDUSDT)
⠀
Or can World ID succeed while token holders face difficult supply economics?
⠀
Let's examine the numbers.
⠀
01 | WHAT IS WORLD?
⠀
World is building an identity and financial network.
⠀
World ID provides credentials that applications can use to verify attributes such as unique humanness.
⠀
The Orb supports its biometric verification process.
⠀
World Chain provides blockchain infrastructure.
⠀
WLD is the associated token.
⠀
These components are related.
⠀
They are not interchangeable.
⠀
A successful identity product can create useful services without automatically producing proportional demand for WLD.
⠀
The investment thesis needs a clear connection between adoption, payments, and token economics.
⠀
A large problem establishes an opportunity.
⠀
The payment mechanism determines what holders capture.
⠀
02 | THE NUMBERS THAT MATTER
⠀
November 19, 2026 snapshot:
⠀
WLD Price: ~$0.2646
Market Cap: ~$1.00B
Initial-Supply FDV: ~$2.65B
Circulating Supply: ~3.792B WLD
Initial Token Supply: 10B WLD
Circulating / Initial Supply: ~37.9%
24H WLD Trading Volume: ~$205.82M
All-Time High: ~$11.82
Decline From ATH: ~97.8%
⠀
SUPPLY FRAMEWORK:
⠀
Published Aggregate Unlock Rate: ~2.9M WLD per day
Approximate 30-Day Unlock Amount: ~87M WLD
Illustrative Value at Snapshot Price: ~$23M
⠀
The FDV is calculated against the initial 10 billion tokens.
⠀
That figure should not be described as an unconditional lifetime maximum.
⠀
Unlocking also does not mean every token immediately enters the market.
⠀
Eligibility, distribution, and selling are different events.
⠀
03 | THE AI THESIS NEEDS A SECOND STEP
⠀
Bots, synthetic accounts, and impersonation create a potential market for human verification.
⠀
But identifying a problem does not establish that one solution will dominate.
⠀
Applications can evaluate multiple approaches.
⠀
Users can reject additional onboarding friction.
⠀
And customers can integrate a service without accepting every proposed price.
⠀
For WLD, the relevant sequence is:
⠀
Applications need verification.
⠀
They choose World ID.
⠀
They continue using it.
⠀
They pay under a working fee model.
⠀
And those payments create an identifiable benefit for the token.
⠀
Skipping the last steps turns an investment thesis into a narrative.
⠀
04 | VERIFIED PEOPLE ARE NOT PAYING CUSTOMERS
⠀
A cumulative verification count measures enrollment.
⠀
It does not establish monthly active usage.
⠀
App downloads do not establish retained users.
⠀
And users claiming distributed tokens do not establish that third-party applications are paying for verification.
⠀
The stronger commercial evidence would include:
⠀
Active verified users.
⠀
Repeat authentication.
⠀
Applications with recurring paid usage.
⠀
And customer retention after incentives.
⠀
These measurements answer different questions.
⠀
A growing identity network can be valuable.
⠀
Its commercial value becomes clearer when outside customers repeatedly pay for the service.
⠀
05 | THE WORLD ID FEE MODEL
⠀
Official materials describe World ID fees payable in WLD.
⠀
The intended structure charges applications while keeping protocol usage free for end users.
⠀
Credential issuers can receive credential fees.
⠀
A separate protocol fee supports the protocol.
⠀
That provides a potential connection between useful identity services and token demand.
⠀
But capability is not the same as activation.
⠀
A published pricing framework is not evidence of collected revenue.
⠀
The retrieved materials did not establish a current, verified recurring fee total.
⠀
Therefore, projected monetization should remain a future opportunity rather than be presented as existing earnings.
⠀
06 | FEES DO NOT AUTOMATICALLY MEAN BURNS
⠀
World's published framework allows different uses for fee income.
⠀
Credential issuers can determine how to use their portion.
⠀
Protocol fees may support operations or include a burn allocation.
⠀
That does not establish that every fee is destroyed.
⠀
It also does not create an automatic dividend for WLD holders.
⠀
The relevant verification is the active allocation mechanism.
⠀
How much was collected?
⠀
Who received it?
⠀
What was retained, distributed, or burned?
⠀
A potential burn mechanism improves the range of possible outcomes.
⠀
Executed, recurring burns establish the actual supply effect.
⠀
07 | THE JULY UNLOCK REDUCTION
⠀
The official schedule reduced aggregate daily unlocks by approximately 43% on July 24, 2026.
⠀
The published rate moved from around 5.1 million WLD to around 2.9 million.
⠀
That is a meaningful reduction in the pace of newly transferable supply.
⠀
It is not the end of vesting.
⠀
The reduced rate still represents approximately 87 million tokens over 30 days.
⠀
Investors should evaluate the remaining rate against demand rather than only celebrate the percentage reduction.
⠀
A smaller supply flow can improve conditions.
⠀
Its importance depends on how much of that flow becomes liquid and how buyers respond.
⠀
08 | UNLOCKED SUPPLY IS NOT CIRCULATING SUPPLY
⠀
World's official disclosures distinguish unlocked tokens from tokens in circulation.
⠀
An allocation can become transferable while remaining under an organization's control.
⠀
Tokens can then be distributed over time for different purposes.
⠀
That makes a single unlock percentage an incomplete picture of potential supply.
⠀
For investors, the useful monitoring includes treasury distributions, recipient balances, exchange-bound transfers, and changes in reported circulation.
⠀
An exchange transfer is not proof of a completed sale.
⠀
But it can change the immediate market context.
⠀
The correct approach follows actual movements.
⠀
It does not assume either that every unlock is sold or that retained allocations are irrelevant.
⠀
09 | TEN BILLION IS THE INITIAL FRAMEWORK
⠀
The whitepaper specifies an initial supply of 10 billion WLD.
⠀
Additional inflation can begin no earlier than July 24, 2038.
⠀
The default rate is zero.
⠀
Any future rate and allocation are subject to governance, with an annual limit of 1.5%.
⠀
That is different from a permanent, immutable 10 billion lifetime ceiling.
⠀
For the current investment horizon, the more immediate issue is distribution from the initial supply.
⠀
Only approximately 37.9% is classified as circulating in the quoted snapshot.
⠀
A long-term inflation provision and near-term circulating-supply growth are separate considerations.
⠀
Both need the correct timeframe.
⠀
10 | THE CHAIN AND VALUATION QUESTIONS
⠀
World Chain uses ETH as its native asset.
⠀
Payment conveniences involving WLD should not be confused with making WLD the underlying native gas asset.
⠀
Likewise, network transactions do not automatically create equivalent WLD purchases.
⠀
Using the initial 10 billion supply:
⠀
$0.50 WLD implies a $5B valuation.
$1.00 implies $10B.
$2.00 implies $20B.
$5.00 implies $50B.
$11.82 implies $118.2B.
⠀
These are initial-supply valuation illustrations, not price targets.
⠀
They show why returning to an old price requires more analysis than measuring the drawdown.
⠀
The denominator and circulating supply have changed.
⠀
The valuation needs demand capable of supporting them.
⠀
11 | THE BULL AND BEAR CASE
⠀
THE BULL CASE:
⠀
World ID becomes a useful verification layer.
⠀
Applications retain active verified users.
⠀
A working fee model attracts paying customers.
⠀
Protocol income produces measurable token demand.
⠀
And that demand grows faster than liquid supply.
⠀
THE BEAR CASE:
⠀
Enrollment produces limited repeat usage.
⠀
Applications resist fees or choose alternatives.
⠀
Hardware-based onboarding limits distribution.
⠀
User incentives support activity without establishing commercial demand.
⠀
And ongoing distributions outweigh the token's economic benefits.
⠀
A useful identity network can succeed operationally while its token remains a difficult investment.
⠀
The connection between the two must be demonstrated.
⠀
12 | THE FINAL VERDICT
⠀
World has an identifiable opportunity.
⠀
Human verification.
⠀
Identity credentials.
⠀
Application integrations.
⠀
And a proposed fee model connecting usage to WLD.
⠀
But the investment case remains conditional.
⠀
A roughly $1 billion market capitalization.
⠀
Approximately $2.65 billion against the initial supply.
⠀
Less than 40% of that supply classified as circulating.
⠀
And continuing daily unlocks alongside monetization that needs clearer evidence.
⠀
My assessment:
⠀
WLD is a proof-of-human commercialization thesis with a substantial supply-absorption test.
⠀
More verified people create network reach.
⠀
Repeated use demonstrates usefulness.
⠀
Paying applications establish commercial demand.
⠀
The active fee allocation determines how that demand benefits the token.
⠀
The decisive question is whether those benefits can grow faster than liquid supply.
⠀
A 97.8% drawdown does not answer it.
⠀
Neither does an AI headline.
⠀
Bookmark this analysis before the next identity and AI rotation.
⠀
Would you rather invest in the identity application, the verification infrastructure, or the associated token?
⠀
And what evidence would convince you that World ID adoption is becoming sustainable WLD demand?
⠀
Drop your view below.
#Write2Earn #Web3
🚨$WLD — THE PROOF OF HUMAN MONETIZATION BET
A roughly $1 BILLION cryptocurrency.
⠀
Approximately 3.79 BILLION tokens circulating.
⠀
Around 2.9 MILLION tokens unlocking daily under the published schedule.
⠀
And a token trading approximately 97.8% below its all-time high.
⠀
But here's the contradiction.
⠀
Proving that someone is human could become valuable internet infrastructure.
⠀
That does not automatically make the associated token a valuable investment.
⠀
Is $WLD an overlooked bet on identity in an AI-driven world?
⠀
Or can World ID succeed while token holders face difficult supply economics?
⠀
Let's examine the numbers.
⠀
01 | WHAT IS WORLD?
⠀
World is building an identity and financial network.
⠀
World ID provides credentials that applications can use to verify attributes such as unique humanness.
⠀
The Orb supports its biometric verification process.
⠀
World Chain provides blockchain infrastructure.
⠀
WLD is the associated token.
⠀
These components are related.
⠀
They are not interchangeable.
⠀
A successful identity product can create useful services without automatically producing proportional demand for WLD.
⠀
The investment thesis needs a clear connection between adoption, payments, and token economics.
⠀
A large problem establishes an opportunity.
⠀
The payment mechanism determines what holders capture.
⠀
02 | THE NUMBERS THAT MATTER
⠀
November 19, 2026 snapshot:
⠀
WLD Price: ~$0.2646
Market Cap: ~$1.00B
Initial-Supply FDV: ~$2.65B
Circulating Supply: ~3.792B WLD
Initial Token Supply: 10B WLD
Circulating / Initial Supply: ~37.9%
24H WLD Trading Volume: ~$205.82M
All-Time High: ~$11.82
Decline From ATH: ~97.8%
⠀
SUPPLY FRAMEWORK:
⠀
Published Aggregate Unlock Rate: ~2.9M WLD per day
Approximate 30-Day Unlock Amount: ~87M WLD
Illustrative Value at Snapshot Price: ~$23M
⠀
The FDV is calculated against the initial 10 billion tokens.
⠀
That figure should not be described as an unconditional lifetime maximum.
⠀
Unlocking also does not mean every token immediately enters the market.
⠀
Eligibility, distribution, and selling are different events.
⠀
03 | THE AI THESIS NEEDS A SECOND STEP
⠀
Bots, synthetic accounts, and impersonation create a potential market for human verification.
⠀
But identifying a problem does not establish that one solution will dominate.
⠀
Applications can evaluate multiple approaches.
⠀
Users can reject additional onboarding friction.
⠀
And customers can integrate a service without accepting every proposed price.
⠀
For WLD, the relevant sequence is:
⠀
Applications need verification.
⠀
They choose World ID.
⠀
They continue using it.
⠀
They pay under a working fee model.
⠀
And those payments create an identifiable benefit for the token.
⠀
Skipping the last steps turns an investment thesis into a narrative.
⠀
04 | VERIFIED PEOPLE ARE NOT PAYING CUSTOMERS
⠀
A cumulative verification count measures enrollment.
⠀
It does not establish monthly active usage.
⠀
App downloads do not establish retained users.
⠀
And users claiming distributed tokens do not establish that third-party applications are paying for verification.
⠀
The stronger commercial evidence would include:
⠀
Active verified users.
⠀
Repeat authentication.
⠀
Applications with recurring paid usage.
⠀
And customer retention after incentives.
⠀
These measurements answer different questions.
⠀
A growing identity network can be valuable.
⠀
Its commercial value becomes clearer when outside customers repeatedly pay for the service.
⠀
05 | THE WORLD ID FEE MODEL
⠀
Official materials describe World ID fees payable in WLD.
⠀
The intended structure charges applications while keeping protocol usage free for end users.
⠀
Credential issuers can receive credential fees.
⠀
A separate protocol fee supports the protocol.
⠀
That provides a potential connection between useful identity services and token demand.
⠀
But capability is not the same as activation.
⠀
A published pricing framework is not evidence of collected revenue.
⠀
The retrieved materials did not establish a current, verified recurring fee total.
⠀
Therefore, projected monetization should remain a future opportunity rather than be presented as existing earnings.
⠀
06 | FEES DO NOT AUTOMATICALLY MEAN BURNS
⠀
World's published framework allows different uses for fee income.
⠀
Credential issuers can determine how to use their portion.
⠀
Protocol fees may support operations or include a burn allocation.
⠀
That does not establish that every fee is destroyed.
⠀
It also does not create an automatic dividend for WLD holders.
⠀
The relevant verification is the active allocation mechanism.
⠀
How much was collected?
⠀
Who received it?
⠀
What was retained, distributed, or burned?
⠀
A potential burn mechanism improves the range of possible outcomes.
⠀
Executed, recurring burns establish the actual supply effect.
⠀
07 | THE JULY UNLOCK REDUCTION
⠀
The official schedule reduced aggregate daily unlocks by approximately 43% on July 24, 2026.
⠀
The published rate moved from around 5.1 million WLD to around 2.9 million.
⠀
That is a meaningful reduction in the pace of newly transferable supply.
⠀
It is not the end of vesting.
⠀
The reduced rate still represents approximately 87 million tokens over 30 days.
⠀
Investors should evaluate the remaining rate against demand rather than only celebrate the percentage reduction.
⠀
A smaller supply flow can improve conditions.
⠀
Its importance depends on how much of that flow becomes liquid and how buyers respond.
⠀
08 | UNLOCKED SUPPLY IS NOT CIRCULATING SUPPLY
⠀
World's official disclosures distinguish unlocked tokens from tokens in circulation.
⠀
An allocation can become transferable while remaining under an organization's control.
⠀
Tokens can then be distributed over time for different purposes.
⠀
That makes a single unlock percentage an incomplete picture of potential supply.
⠀
For investors, the useful monitoring includes treasury distributions, recipient balances, exchange-bound transfers, and changes in reported circulation.
⠀
An exchange transfer is not proof of a completed sale.
⠀
But it can change the immediate market context.
⠀
The correct approach follows actual movements.
⠀
It does not assume either that every unlock is sold or that retained allocations are irrelevant.
⠀
09 | TEN BILLION IS THE INITIAL FRAMEWORK
⠀
The whitepaper specifies an initial supply of 10 billion WLD.
⠀
Additional inflation can begin no earlier than July 24, 2038.
⠀
The default rate is zero.
⠀
Any future rate and allocation are subject to governance, with an annual limit of 1.5%.
⠀
That is different from a permanent, immutable 10 billion lifetime ceiling.
⠀
For the current investment horizon, the more immediate issue is distribution from the initial supply.
⠀
Only approximately 37.9% is classified as circulating in the quoted snapshot.
⠀
A long-term inflation provision and near-term circulating-supply growth are separate considerations.
⠀
Both need the correct timeframe.
⠀
10 | THE CHAIN AND VALUATION QUESTIONS
⠀
World Chain uses ETH as its native asset.
⠀
Payment conveniences involving WLD should not be confused with making WLD the underlying native gas asset.
⠀
Likewise, network transactions do not automatically create equivalent WLD purchases.
⠀
Using the initial 10 billion supply:
⠀
$0.50 WLD implies a $5B valuation.
$1.00 implies $10B.
$2.00 implies $20B.
$5.00 implies $50B.
$11.82 implies $118.2B.
⠀
These are initial-supply valuation illustrations, not price targets.
⠀
They show why returning to an old price requires more analysis than measuring the drawdown.
⠀
The denominator and circulating supply have changed.
⠀
The valuation needs demand capable of supporting them.
⠀
11 | THE BULL AND BEAR CASE
⠀
THE BULL CASE:
⠀
World ID becomes a useful verification layer.
⠀
Applications retain active verified users.
⠀
A working fee model attracts paying customers.
⠀
Protocol income produces measurable token demand.
⠀
And that demand grows faster than liquid supply.
⠀
THE BEAR CASE:
⠀
Enrollment produces limited repeat usage.
⠀
Applications resist fees or choose alternatives.
⠀
Hardware-based onboarding limits distribution.
⠀
User incentives support activity without establishing commercial demand.
⠀
And ongoing distributions outweigh the token's economic benefits.
⠀
A useful identity network can succeed operationally while its token remains a difficult investment.
⠀
The connection between the two must be demonstrated.
⠀
12 | THE FINAL VERDICT
⠀
World has an identifiable opportunity.
⠀
Human verification.
⠀
Identity credentials.
⠀
Application integrations.
⠀
And a proposed fee model connecting usage to WLD.
⠀
But the investment case remains conditional.
⠀
A roughly $1 billion market capitalization.
⠀
Approximately $2.65 billion against the initial supply.
⠀
Less than 40% of that supply classified as circulating.
⠀
And continuing daily unlocks alongside monetization that needs clearer evidence.
⠀
My assessment:
⠀
WLD is a proof-of-human commercialization thesis with a substantial supply-absorption test.
⠀
More verified people create network reach.
⠀
Repeated use demonstrates usefulness.
⠀
Paying applications establish commercial demand.
⠀
The active fee allocation determines how that demand benefits the token.
⠀
The decisive question is whether those benefits can grow faster than liquid supply.
⠀
A 97.8% drawdown does not answer it.
⠀
Neither does an AI headline.
⠀
Bookmark this analysis before the next identity and AI rotation.
⠀
Would you rather invest in the identity application, the verification infrastructure, or the associated token?
⠀
And what evidence would convince you that World ID adoption is becoming sustainable WLD demand?
⠀
Drop your view below.
#Write2Earn #Web3
⠀
Approximately 3.79 BILLION tokens circulating.
⠀
Around 2.9 MILLION tokens unlocking daily under the published schedule.
⠀
And a token trading approximately 97.8% below its all-time high.
⠀
But here's the contradiction.
⠀
Proving that someone is human could become valuable internet infrastructure.
⠀
That does not automatically make the associated token a valuable investment.
⠀
Is $WLD an overlooked bet on identity in an AI-driven world?
⠀
Or can World ID succeed while token holders face difficult supply economics?
⠀
Let's examine the numbers.
⠀
01 | WHAT IS WORLD?
⠀
World is building an identity and financial network.
⠀
World ID provides credentials that applications can use to verify attributes such as unique humanness.
⠀
The Orb supports its biometric verification process.
⠀
World Chain provides blockchain infrastructure.
⠀
WLD is the associated token.
⠀
These components are related.
⠀
They are not interchangeable.
⠀
A successful identity product can create useful services without automatically producing proportional demand for WLD.
⠀
The investment thesis needs a clear connection between adoption, payments, and token economics.
⠀
A large problem establishes an opportunity.
⠀
The payment mechanism determines what holders capture.
⠀
02 | THE NUMBERS THAT MATTER
⠀
November 19, 2026 snapshot:
⠀
WLD Price: ~$0.2646
Market Cap: ~$1.00B
Initial-Supply FDV: ~$2.65B
Circulating Supply: ~3.792B WLD
Initial Token Supply: 10B WLD
Circulating / Initial Supply: ~37.9%
24H WLD Trading Volume: ~$205.82M
All-Time High: ~$11.82
Decline From ATH: ~97.8%
⠀
SUPPLY FRAMEWORK:
⠀
Published Aggregate Unlock Rate: ~2.9M WLD per day
Approximate 30-Day Unlock Amount: ~87M WLD
Illustrative Value at Snapshot Price: ~$23M
⠀
The FDV is calculated against the initial 10 billion tokens.
⠀
That figure should not be described as an unconditional lifetime maximum.
⠀
Unlocking also does not mean every token immediately enters the market.
⠀
Eligibility, distribution, and selling are different events.
⠀
03 | THE AI THESIS NEEDS A SECOND STEP
⠀
Bots, synthetic accounts, and impersonation create a potential market for human verification.
⠀
But identifying a problem does not establish that one solution will dominate.
⠀
Applications can evaluate multiple approaches.
⠀
Users can reject additional onboarding friction.
⠀
And customers can integrate a service without accepting every proposed price.
⠀
For WLD, the relevant sequence is:
⠀
Applications need verification.
⠀
They choose World ID.
⠀
They continue using it.
⠀
They pay under a working fee model.
⠀
And those payments create an identifiable benefit for the token.
⠀
Skipping the last steps turns an investment thesis into a narrative.
⠀
04 | VERIFIED PEOPLE ARE NOT PAYING CUSTOMERS
⠀
A cumulative verification count measures enrollment.
⠀
It does not establish monthly active usage.
⠀
App downloads do not establish retained users.
⠀
And users claiming distributed tokens do not establish that third-party applications are paying for verification.
⠀
The stronger commercial evidence would include:
⠀
Active verified users.
⠀
Repeat authentication.
⠀
Applications with recurring paid usage.
⠀
And customer retention after incentives.
⠀
These measurements answer different questions.
⠀
A growing identity network can be valuable.
⠀
Its commercial value becomes clearer when outside customers repeatedly pay for the service.
⠀
05 | THE WORLD ID FEE MODEL
⠀
Official materials describe World ID fees payable in WLD.
⠀
The intended structure charges applications while keeping protocol usage free for end users.
⠀
Credential issuers can receive credential fees.
⠀
A separate protocol fee supports the protocol.
⠀
That provides a potential connection between useful identity services and token demand.
⠀
But capability is not the same as activation.
⠀
A published pricing framework is not evidence of collected revenue.
⠀
The retrieved materials did not establish a current, verified recurring fee total.
⠀
Therefore, projected monetization should remain a future opportunity rather than be presented as existing earnings.
⠀
06 | FEES DO NOT AUTOMATICALLY MEAN BURNS
⠀
World's published framework allows different uses for fee income.
⠀
Credential issuers can determine how to use their portion.
⠀
Protocol fees may support operations or include a burn allocation.
⠀
That does not establish that every fee is destroyed.
⠀
It also does not create an automatic dividend for WLD holders.
⠀
The relevant verification is the active allocation mechanism.
⠀
How much was collected?
⠀
Who received it?
⠀
What was retained, distributed, or burned?
⠀
A potential burn mechanism improves the range of possible outcomes.
⠀
Executed, recurring burns establish the actual supply effect.
⠀
07 | THE JULY UNLOCK REDUCTION
⠀
The official schedule reduced aggregate daily unlocks by approximately 43% on July 24, 2026.
⠀
The published rate moved from around 5.1 million WLD to around 2.9 million.
⠀
That is a meaningful reduction in the pace of newly transferable supply.
⠀
It is not the end of vesting.
⠀
The reduced rate still represents approximately 87 million tokens over 30 days.
⠀
Investors should evaluate the remaining rate against demand rather than only celebrate the percentage reduction.
⠀
A smaller supply flow can improve conditions.
⠀
Its importance depends on how much of that flow becomes liquid and how buyers respond.
⠀
08 | UNLOCKED SUPPLY IS NOT CIRCULATING SUPPLY
⠀
World's official disclosures distinguish unlocked tokens from tokens in circulation.
⠀
An allocation can become transferable while remaining under an organization's control.
⠀
Tokens can then be distributed over time for different purposes.
⠀
That makes a single unlock percentage an incomplete picture of potential supply.
⠀
For investors, the useful monitoring includes treasury distributions, recipient balances, exchange-bound transfers, and changes in reported circulation.
⠀
An exchange transfer is not proof of a completed sale.
⠀
But it can change the immediate market context.
⠀
The correct approach follows actual movements.
⠀
It does not assume either that every unlock is sold or that retained allocations are irrelevant.
⠀
09 | TEN BILLION IS THE INITIAL FRAMEWORK
⠀
The whitepaper specifies an initial supply of 10 billion WLD.
⠀
Additional inflation can begin no earlier than July 24, 2038.
⠀
The default rate is zero.
⠀
Any future rate and allocation are subject to governance, with an annual limit of 1.5%.
⠀
That is different from a permanent, immutable 10 billion lifetime ceiling.
⠀
For the current investment horizon, the more immediate issue is distribution from the initial supply.
⠀
Only approximately 37.9% is classified as circulating in the quoted snapshot.
⠀
A long-term inflation provision and near-term circulating-supply growth are separate considerations.
⠀
Both need the correct timeframe.
⠀
10 | THE CHAIN AND VALUATION QUESTIONS
⠀
World Chain uses ETH as its native asset.
⠀
Payment conveniences involving WLD should not be confused with making WLD the underlying native gas asset.
⠀
Likewise, network transactions do not automatically create equivalent WLD purchases.
⠀
Using the initial 10 billion supply:
⠀
$0.50 WLD implies a $5B valuation.
$1.00 implies $10B.
$2.00 implies $20B.
$5.00 implies $50B.
$11.82 implies $118.2B.
⠀
These are initial-supply valuation illustrations, not price targets.
⠀
They show why returning to an old price requires more analysis than measuring the drawdown.
⠀
The denominator and circulating supply have changed.
⠀
The valuation needs demand capable of supporting them.
⠀
11 | THE BULL AND BEAR CASE
⠀
THE BULL CASE:
⠀
World ID becomes a useful verification layer.
⠀
Applications retain active verified users.
⠀
A working fee model attracts paying customers.
⠀
Protocol income produces measurable token demand.
⠀
And that demand grows faster than liquid supply.
⠀
THE BEAR CASE:
⠀
Enrollment produces limited repeat usage.
⠀
Applications resist fees or choose alternatives.
⠀
Hardware-based onboarding limits distribution.
⠀
User incentives support activity without establishing commercial demand.
⠀
And ongoing distributions outweigh the token's economic benefits.
⠀
A useful identity network can succeed operationally while its token remains a difficult investment.
⠀
The connection between the two must be demonstrated.
⠀
12 | THE FINAL VERDICT
⠀
World has an identifiable opportunity.
⠀
Human verification.
⠀
Identity credentials.
⠀
Application integrations.
⠀
And a proposed fee model connecting usage to WLD.
⠀
But the investment case remains conditional.
⠀
A roughly $1 billion market capitalization.
⠀
Approximately $2.65 billion against the initial supply.
⠀
Less than 40% of that supply classified as circulating.
⠀
And continuing daily unlocks alongside monetization that needs clearer evidence.
⠀
My assessment:
⠀
WLD is a proof-of-human commercialization thesis with a substantial supply-absorption test.
⠀
More verified people create network reach.
⠀
Repeated use demonstrates usefulness.
⠀
Paying applications establish commercial demand.
⠀
The active fee allocation determines how that demand benefits the token.
⠀
The decisive question is whether those benefits can grow faster than liquid supply.
⠀
A 97.8% drawdown does not answer it.
⠀
Neither does an AI headline.
⠀
Bookmark this analysis before the next identity and AI rotation.
⠀
Would you rather invest in the identity application, the verification infrastructure, or the associated token?
⠀
And what evidence would convince you that World ID adoption is becoming sustainable WLD demand?
⠀
Drop your view below.
#Write2Earn #Web3
6
2.4k
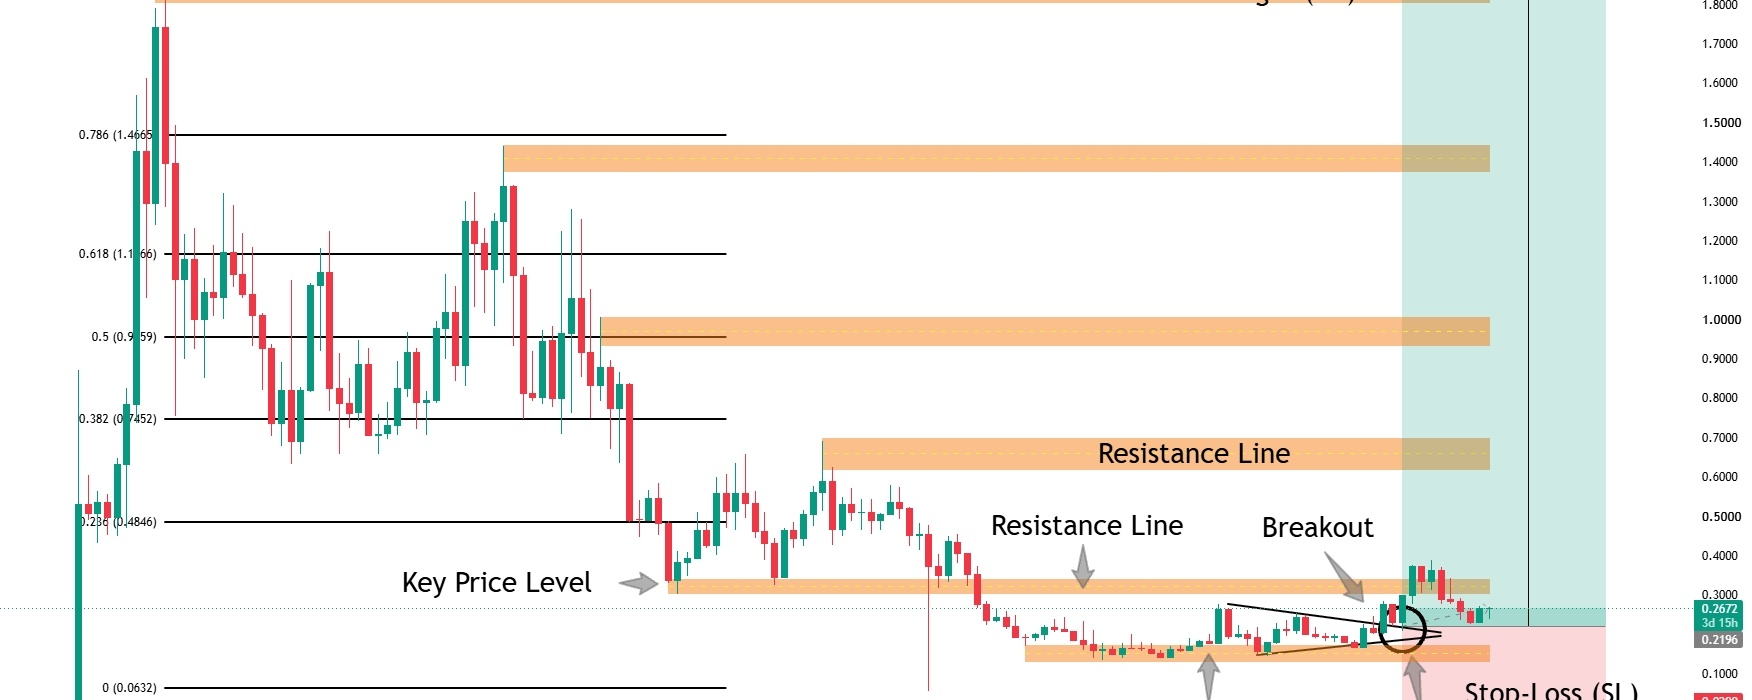
Article
$JUP — THE SOLANA FINANCIAL SUPERAPP BETA roughly $886 MILLION cryptocurrency.
⠀
More than $12 BILLION in monthly aggregator volume.
⠀
Approximately $6.5 MILLION in monthly protocol revenue.
⠀
And a token trading approximately 87% below its all-time high.
⠀
But here's the contradiction.
⠀
Jupiter has built useful products and a revenue-generating business.
⠀
Owning JUP still requires a separate argument about value capture, supply discipline, and execution.
⠀
Is $JUP an overlooked bet on Solana's financial infrastructure?
⠀
Or does a successful platform still face difficult token economics?
⠀
Let's examine the numbers.
⠀
01 | WHAT IS JUPITER?
⠀
Jupiter is a Solana-focused financial platform that began with swap aggregation.
⠀
An aggregator searches across trading venues to find routes for users.
⠀
Its broader product suite includes perpetual trading, lending, and other financial services.
⠀
The investment thesis is that controlling the customer interface can become valuable infrastructure.
⠀
Users arrive for execution.
⠀
They may stay for additional products.
⠀
But product adoption strengthens the token thesis only when it produces an identifiable economic benefit for JUP.
⠀
Platform growth and token appreciation are related questions.
⠀
They are not interchangeable.
⠀
02 | THE NUMBERS THAT MATTER
⠀
November 19, 2026 snapshot:
⠀
JUP Price: ~$0.26695
Market Cap: ~$886.11M
FDV: ~$1.832B
Circulating Supply: ~3.319B JUP
Reported Total Supply: ~6.862B JUP
Original Supply: 10B JUP
Circulating / Current Total Supply: ~48.4%
24H JUP Trading Volume: ~$32.36M
All-Time High: ~$2.04
Decline From ATH: ~86.9%
⠀
PROTOCOL FUNDAMENTALS:
⠀
DefiLlama TVL: ~$1.549B
30D Aggregator Volume: ~$12.781B
30D Perpetual Volume: ~$8.043B
30D Fees: ~$20.87M
30D Protocol Revenue: ~$6.46M
30D Holders Revenue: ~$4.02M
⠀
Volume categories measure different activities.
⠀
Fees, protocol revenue, and holders revenue also overlap economically.
⠀
They should not be added together as independent income streams.
⠀
03 | THE DISTRIBUTION ADVANTAGE
⠀
Jupiter's strategic opportunity is its relationship with users.
⠀
A trading interface can direct activity across multiple liquidity sources.
⠀
That creates opportunities to introduce additional services without acquiring every customer from scratch.
⠀
However, distribution is not a permanent monopoly.
⠀
Wallets, exchanges, competing aggregators, and specialist applications can capture the same customers.
⠀
Users can switch if execution, reliability, or pricing deteriorates.
⠀
The durable advantage must appear in retention and recurring monetization.
⠀
A large audience provides an opportunity.
⠀
Profitable repeat usage makes that opportunity economically meaningful.
⠀
04 | VOLUME IS NOT REVENUE
⠀
Aggregator volume measures the value routed through a service.
⠀
It does not mean Jupiter retains that value.
⠀
Underlying venues and liquidity providers perform important parts of the transaction.
⠀
Different Jupiter products also have different economics.
⠀
Perpetual trading activity should not be valued using the same assumptions as routed spot swaps.
⠀
Investors need to examine revenue by product and the durability of each contribution.
⠀
The strongest growth is not simply a larger volume headline.
⠀
It is more income earned without losing customers or taking disproportionate risk.
⠀
Product diversification matters most when it improves the quality of that income.
⠀
05 | THE JUP BUYBACK MODEL
⠀
Jupiter's published framework directs 50% of onchain revenue toward open-market JUP buybacks.
⠀
That provides a concrete connection between monetized activity and token demand.
⠀
But the percentage needs the correct denominator.
⠀
It is not 50% of trading volume.
⠀
It should not automatically be applied to every gross fee displayed by a tracker.
⠀
Revenue recognition and purchase execution can also occur at different times.
⠀
The useful verification is actual funded purchases measured over a consistent period.
⠀
A policy establishes the intended allocation.
⠀
Executed transactions establish the demand created.
⠀
Investors need both.
⠀
06 | BUYBACKS, HOLDINGS, AND BURNS
⠀
Jupiter's official statistics page reports approximately:
⠀
327 million JUP accumulated by the Litterbox Trust.
⠀
192 million JUP currently held.
⠀
Those figures measure different stages.
⠀
They should not be added together.
⠀
Nor should their difference automatically be classified as a new burn without checking the transaction history.
⠀
Jupiter previously burned 3 billion tokens.
⠀
DefiLlama's supply notes also record a later Litterbox burn of approximately 134.55 million JUP.
⠀
Purchasing tokens creates demand when the purchase occurs.
⠀
Holding them changes custody and available inventory.
⠀
Destroying them permanently changes supply.
⠀
Each action has a distinct economic effect.
⠀
07 | THE NET-ZERO CHANGE
⠀
The February 2026 Net-Zero proposal materially changed the supply framework.
⠀
DefiLlama records the proposal as passed.
⠀
Its measures included postponing Jupuary, pausing team reserve emissions, and changing the treatment of Mercurial allocations.
⠀
The published plan described using Jupiter's balance sheet to absorb eligible team sales and offset Mercurial sales.
⠀
That is a meaningful commitment.
⠀
It is also an implementation obligation.
⠀
Net-zero describes the intended net market impact.
⠀
It does not mean every remaining allocation has been destroyed or every token movement has stopped.
⠀
The practical test is actual distributions and matching purchases.
⠀
08 | THE UNLOCK QUESTION
⠀
Old JUP unlock calendars can now be misleading.
⠀
A previously scheduled distribution should not be presented as imminent without checking the revised policy.
⠀
Postponed allocations remain relevant because future governance can determine their use.
⠀
Paused emissions also differ from permanently canceled supply.
⠀
DefiLlama identifies several allocations remaining in protocol custody without a defined release schedule.
⠀
That reduces the usefulness of inventing a single next-unlock headline.
⠀
The better approach is to monitor governance decisions, custody balances, and actual changes in circulating supply.
⠀
Supply risk depends on what can enter the market and under which conditions.
⠀
A calendar alone cannot answer that.
⠀
09 | GOVERNANCE AND STAKING REWARDS
⠀
JUP connects holders to Jupiter's governance process.
⠀
The official dashboard reports approximately 1.17 billion JUP staked.
⠀
That is a participation measurement.
⠀
It is not permanently removed supply.
⠀
Likewise, a displayed staking yield should not be treated automatically as cash income generated by customers.
⠀
Investors need to examine the reward asset, funding source, distribution rules, and exit conditions.
⠀
Redistributing existing tokens differs from minting new ones.
⠀
But existing tokens can still become available to recipients willing to sell.
⠀
Governance influence, participation rewards, and buyback demand are separate parts of the investment thesis.
⠀
10 | THE VALUATION QUESTION
⠀
Annualizing $6.46 million of recent monthly protocol revenue gives approximately $77.5 million.
⠀
Against an $886 million market capitalization, that implies roughly 11.4 times annualized protocol revenue.
⠀
This is an illustrative comparison.
⠀
It is not a corporate earnings multiple.
⠀
It assumes the latest month is representative and does not establish distributable profit after all operating costs.
⠀
Using approximately 6.862 billion current total tokens:
⠀
$0.50 JUP implies ~$3.43B total-supply valuation.
$1.00 implies ~$6.86B.
$2.00 implies ~$13.72B.
$3.00 implies ~$20.59B.
⠀
These are valuation illustrations, not price targets.
⠀
Future burns and supply decisions can change the denominator.
⠀
11 | THE BULL AND BEAR CASE
⠀
THE BULL CASE:
⠀
Jupiter retains a valuable customer interface.
⠀
More users adopt monetized products.
⠀
Revenue becomes more diversified and durable.
⠀
Buybacks remain consistently funded.
⠀
Supply commitments are implemented transparently.
⠀
And product growth strengthens demand for JUP.
⠀
THE BEAR CASE:
⠀
Trading revenue contracts with market activity.
⠀
Competitors capture customers or compress margins.
⠀
Product expansion increases operational and security complexity.
⠀
Supply restrictions depend too heavily on continued discretionary support.
⠀
And platform success creates less token value than investors expect.
⠀
A successful application can still be an expensive token investment at the wrong valuation.
⠀
12 | THE FINAL VERDICT
⠀
Jupiter has measurable strengths.
⠀
Substantial user activity.
⠀
Multiple financial products.
⠀
Real protocol revenue.
⠀
And an established buyback framework.
⠀
Its revised supply policy also deserves more careful treatment than repeating an outdated dilution narrative.
⠀
But the investment case remains conditional.
⠀
A roughly $886 million market capitalization.
⠀
Approximately $1.83 billion in fully diluted value.
⠀
Less than half the current total supply classified as circulating.
⠀
And continuing dependence on revenue durability and policy execution.
⠀
My assessment:
⠀
JUP is a financial platform growth thesis with an identifiable token-demand mechanism.
⠀
The decisive evidence is sustained monetization that produces verifiable purchases alongside disciplined supply management.
⠀
More users create distribution.
⠀
More paid activity creates revenue.
⠀
Executed purchases create JUP demand.
⠀
Supply discipline determines how much of that demand benefits existing holders.
⠀
Bookmark this analysis before the next Solana DeFi rotation.
⠀
Which has the strongest long-term financial platform thesis?
⠀
$JUP , $RAY , or $HYPE ?
⠀
And can Jupiter turn its growing product ecosystem into sustainable token value?
⠀
Drop your view below.
#JUP #Ray #hype #CryptocurrencyWealth
$JUP — THE SOLANA FINANCIAL SUPERAPP BET
A roughly $886 MILLION cryptocurrency.
⠀
More than $12 BILLION in monthly aggregator volume.
⠀
Approximately $6.5 MILLION in monthly protocol revenue.
⠀
And a token trading approximately 87% below its all-time high.
⠀
But here's the contradiction.
⠀
Jupiter has built useful products and a revenue-generating business.
⠀
Owning JUP still requires a separate argument about value capture, supply discipline, and execution.
⠀
Is $JUP an overlooked bet on Solana's financial infrastructure?
⠀
Or does a successful platform still face difficult token economics?
⠀
Let's examine the numbers.
⠀
01 | WHAT IS JUPITER?
⠀
Jupiter is a Solana-focused financial platform that began with swap aggregation.
⠀
An aggregator searches across trading venues to find routes for users.
⠀
Its broader product suite includes perpetual trading, lending, and other financial services.
⠀
The investment thesis is that controlling the customer interface can become valuable infrastructure.
⠀
Users arrive for execution.
⠀
They may stay for additional products.
⠀
But product adoption strengthens the token thesis only when it produces an identifiable economic benefit for JUP.
⠀
Platform growth and token appreciation are related questions.
⠀
They are not interchangeable.
⠀
02 | THE NUMBERS THAT MATTER
⠀
November 19, 2026 snapshot:
⠀
JUP Price: ~$0.26695
Market Cap: ~$886.11M
FDV: ~$1.832B
Circulating Supply: ~3.319B JUP
Reported Total Supply: ~6.862B JUP
Original Supply: 10B JUP
Circulating / Current Total Supply: ~48.4%
24H JUP Trading Volume: ~$32.36M
All-Time High: ~$2.04
Decline From ATH: ~86.9%
⠀
PROTOCOL FUNDAMENTALS:
⠀
DefiLlama TVL: ~$1.549B
30D Aggregator Volume: ~$12.781B
30D Perpetual Volume: ~$8.043B
30D Fees: ~$20.87M
30D Protocol Revenue: ~$6.46M
30D Holders Revenue: ~$4.02M
⠀
Volume categories measure different activities.
⠀
Fees, protocol revenue, and holders revenue also overlap economically.
⠀
They should not be added together as independent income streams.
⠀
03 | THE DISTRIBUTION ADVANTAGE
⠀
Jupiter's strategic opportunity is its relationship with users.
⠀
A trading interface can direct activity across multiple liquidity sources.
⠀
That creates opportunities to introduce additional services without acquiring every customer from scratch.
⠀
However, distribution is not a permanent monopoly.
⠀
Wallets, exchanges, competing aggregators, and specialist applications can capture the same customers.
⠀
Users can switch if execution, reliability, or pricing deteriorates.
⠀
The durable advantage must appear in retention and recurring monetization.
⠀
A large audience provides an opportunity.
⠀
Profitable repeat usage makes that opportunity economically meaningful.
⠀
04 | VOLUME IS NOT REVENUE
⠀
Aggregator volume measures the value routed through a service.
⠀
It does not mean Jupiter retains that value.
⠀
Underlying venues and liquidity providers perform important parts of the transaction.
⠀
Different Jupiter products also have different economics.
⠀
Perpetual trading activity should not be valued using the same assumptions as routed spot swaps.
⠀
Investors need to examine revenue by product and the durability of each contribution.
⠀
The strongest growth is not simply a larger volume headline.
⠀
It is more income earned without losing customers or taking disproportionate risk.
⠀
Product diversification matters most when it improves the quality of that income.
⠀
05 | THE JUP BUYBACK MODEL
⠀
Jupiter's published framework directs 50% of onchain revenue toward open-market JUP buybacks.
⠀
That provides a concrete connection between monetized activity and token demand.
⠀
But the percentage needs the correct denominator.
⠀
It is not 50% of trading volume.
⠀
It should not automatically be applied to every gross fee displayed by a tracker.
⠀
Revenue recognition and purchase execution can also occur at different times.
⠀
The useful verification is actual funded purchases measured over a consistent period.
⠀
A policy establishes the intended allocation.
⠀
Executed transactions establish the demand created.
⠀
Investors need both.
⠀
06 | BUYBACKS, HOLDINGS, AND BURNS
⠀
Jupiter's official statistics page reports approximately:
⠀
327 million JUP accumulated by the Litterbox Trust.
⠀
192 million JUP currently held.
⠀
Those figures measure different stages.
⠀
They should not be added together.
⠀
Nor should their difference automatically be classified as a new burn without checking the transaction history.
⠀
Jupiter previously burned 3 billion tokens.
⠀
DefiLlama's supply notes also record a later Litterbox burn of approximately 134.55 million JUP.
⠀
Purchasing tokens creates demand when the purchase occurs.
⠀
Holding them changes custody and available inventory.
⠀
Destroying them permanently changes supply.
⠀
Each action has a distinct economic effect.
⠀
07 | THE NET-ZERO CHANGE
⠀
The February 2026 Net-Zero proposal materially changed the supply framework.
⠀
DefiLlama records the proposal as passed.
⠀
Its measures included postponing Jupuary, pausing team reserve emissions, and changing the treatment of Mercurial allocations.
⠀
The published plan described using Jupiter's balance sheet to absorb eligible team sales and offset Mercurial sales.
⠀
That is a meaningful commitment.
⠀
It is also an implementation obligation.
⠀
Net-zero describes the intended net market impact.
⠀
It does not mean every remaining allocation has been destroyed or every token movement has stopped.
⠀
The practical test is actual distributions and matching purchases.
⠀
08 | THE UNLOCK QUESTION
⠀
Old JUP unlock calendars can now be misleading.
⠀
A previously scheduled distribution should not be presented as imminent without checking the revised policy.
⠀
Postponed allocations remain relevant because future governance can determine their use.
⠀
Paused emissions also differ from permanently canceled supply.
⠀
DefiLlama identifies several allocations remaining in protocol custody without a defined release schedule.
⠀
That reduces the usefulness of inventing a single next-unlock headline.
⠀
The better approach is to monitor governance decisions, custody balances, and actual changes in circulating supply.
⠀
Supply risk depends on what can enter the market and under which conditions.
⠀
A calendar alone cannot answer that.
⠀
09 | GOVERNANCE AND STAKING REWARDS
⠀
JUP connects holders to Jupiter's governance process.
⠀
The official dashboard reports approximately 1.17 billion JUP staked.
⠀
That is a participation measurement.
⠀
It is not permanently removed supply.
⠀
Likewise, a displayed staking yield should not be treated automatically as cash income generated by customers.
⠀
Investors need to examine the reward asset, funding source, distribution rules, and exit conditions.
⠀
Redistributing existing tokens differs from minting new ones.
⠀
But existing tokens can still become available to recipients willing to sell.
⠀
Governance influence, participation rewards, and buyback demand are separate parts of the investment thesis.
⠀
10 | THE VALUATION QUESTION
⠀
Annualizing $6.46 million of recent monthly protocol revenue gives approximately $77.5 million.
⠀
Against an $886 million market capitalization, that implies roughly 11.4 times annualized protocol revenue.
⠀
This is an illustrative comparison.
⠀
It is not a corporate earnings multiple.
⠀
It assumes the latest month is representative and does not establish distributable profit after all operating costs.
⠀
Using approximately 6.862 billion current total tokens:
⠀
$0.50 JUP implies ~$3.43B total-supply valuation.
$1.00 implies ~$6.86B.
$2.00 implies ~$13.72B.
$3.00 implies ~$20.59B.
⠀
These are valuation illustrations, not price targets.
⠀
Future burns and supply decisions can change the denominator.
⠀
11 | THE BULL AND BEAR CASE
⠀
THE BULL CASE:
⠀
Jupiter retains a valuable customer interface.
⠀
More users adopt monetized products.
⠀
Revenue becomes more diversified and durable.
⠀
Buybacks remain consistently funded.
⠀
Supply commitments are implemented transparently.
⠀
And product growth strengthens demand for JUP.
⠀
THE BEAR CASE:
⠀
Trading revenue contracts with market activity.
⠀
Competitors capture customers or compress margins.
⠀
Product expansion increases operational and security complexity.
⠀
Supply restrictions depend too heavily on continued discretionary support.
⠀
And platform success creates less token value than investors expect.
⠀
A successful application can still be an expensive token investment at the wrong valuation.
⠀
12 | THE FINAL VERDICT
⠀
Jupiter has measurable strengths.
⠀
Substantial user activity.
⠀
Multiple financial products.
⠀
Real protocol revenue.
⠀
And an established buyback framework.
⠀
Its revised supply policy also deserves more careful treatment than repeating an outdated dilution narrative.
⠀
But the investment case remains conditional.
⠀
A roughly $886 million market capitalization.
⠀
Approximately $1.83 billion in fully diluted value.
⠀
Less than half the current total supply classified as circulating.
⠀
And continuing dependence on revenue durability and policy execution.
⠀
My assessment:
⠀
JUP is a financial platform growth thesis with an identifiable token-demand mechanism.
⠀
The decisive evidence is sustained monetization that produces verifiable purchases alongside disciplined supply management.
⠀
More users create distribution.
⠀
More paid activity creates revenue.
⠀
Executed purchases create JUP demand.
⠀
Supply discipline determines how much of that demand benefits existing holders.
⠀
Bookmark this analysis before the next Solana DeFi rotation.
⠀
Which has the strongest long-term financial platform thesis?
⠀
$JUP , $RAY , or $HYPE ?
⠀
And can Jupiter turn its growing product ecosystem into sustainable token value?
⠀
Drop your view below.
#JUP #Ray #hype #CryptocurrencyWealth
⠀
More than $12 BILLION in monthly aggregator volume.
⠀
Approximately $6.5 MILLION in monthly protocol revenue.
⠀
And a token trading approximately 87% below its all-time high.
⠀
But here's the contradiction.
⠀
Jupiter has built useful products and a revenue-generating business.
⠀
Owning JUP still requires a separate argument about value capture, supply discipline, and execution.
⠀
Is $JUP an overlooked bet on Solana's financial infrastructure?
⠀
Or does a successful platform still face difficult token economics?
⠀
Let's examine the numbers.
⠀
01 | WHAT IS JUPITER?
⠀
Jupiter is a Solana-focused financial platform that began with swap aggregation.
⠀
An aggregator searches across trading venues to find routes for users.
⠀
Its broader product suite includes perpetual trading, lending, and other financial services.
⠀
The investment thesis is that controlling the customer interface can become valuable infrastructure.
⠀
Users arrive for execution.
⠀
They may stay for additional products.
⠀
But product adoption strengthens the token thesis only when it produces an identifiable economic benefit for JUP.
⠀
Platform growth and token appreciation are related questions.
⠀
They are not interchangeable.
⠀
02 | THE NUMBERS THAT MATTER
⠀
November 19, 2026 snapshot:
⠀
JUP Price: ~$0.26695
Market Cap: ~$886.11M
FDV: ~$1.832B
Circulating Supply: ~3.319B JUP
Reported Total Supply: ~6.862B JUP
Original Supply: 10B JUP
Circulating / Current Total Supply: ~48.4%
24H JUP Trading Volume: ~$32.36M
All-Time High: ~$2.04
Decline From ATH: ~86.9%
⠀
PROTOCOL FUNDAMENTALS:
⠀
DefiLlama TVL: ~$1.549B
30D Aggregator Volume: ~$12.781B
30D Perpetual Volume: ~$8.043B
30D Fees: ~$20.87M
30D Protocol Revenue: ~$6.46M
30D Holders Revenue: ~$4.02M
⠀
Volume categories measure different activities.
⠀
Fees, protocol revenue, and holders revenue also overlap economically.
⠀
They should not be added together as independent income streams.
⠀
03 | THE DISTRIBUTION ADVANTAGE
⠀
Jupiter's strategic opportunity is its relationship with users.
⠀
A trading interface can direct activity across multiple liquidity sources.
⠀
That creates opportunities to introduce additional services without acquiring every customer from scratch.
⠀
However, distribution is not a permanent monopoly.
⠀
Wallets, exchanges, competing aggregators, and specialist applications can capture the same customers.
⠀
Users can switch if execution, reliability, or pricing deteriorates.
⠀
The durable advantage must appear in retention and recurring monetization.
⠀
A large audience provides an opportunity.
⠀
Profitable repeat usage makes that opportunity economically meaningful.
⠀
04 | VOLUME IS NOT REVENUE
⠀
Aggregator volume measures the value routed through a service.
⠀
It does not mean Jupiter retains that value.
⠀
Underlying venues and liquidity providers perform important parts of the transaction.
⠀
Different Jupiter products also have different economics.
⠀
Perpetual trading activity should not be valued using the same assumptions as routed spot swaps.
⠀
Investors need to examine revenue by product and the durability of each contribution.
⠀
The strongest growth is not simply a larger volume headline.
⠀
It is more income earned without losing customers or taking disproportionate risk.
⠀
Product diversification matters most when it improves the quality of that income.
⠀
05 | THE JUP BUYBACK MODEL
⠀
Jupiter's published framework directs 50% of onchain revenue toward open-market JUP buybacks.
⠀
That provides a concrete connection between monetized activity and token demand.
⠀
But the percentage needs the correct denominator.
⠀
It is not 50% of trading volume.
⠀
It should not automatically be applied to every gross fee displayed by a tracker.
⠀
Revenue recognition and purchase execution can also occur at different times.
⠀
The useful verification is actual funded purchases measured over a consistent period.
⠀
A policy establishes the intended allocation.
⠀
Executed transactions establish the demand created.
⠀
Investors need both.
⠀
06 | BUYBACKS, HOLDINGS, AND BURNS
⠀
Jupiter's official statistics page reports approximately:
⠀
327 million JUP accumulated by the Litterbox Trust.
⠀
192 million JUP currently held.
⠀
Those figures measure different stages.
⠀
They should not be added together.
⠀
Nor should their difference automatically be classified as a new burn without checking the transaction history.
⠀
Jupiter previously burned 3 billion tokens.
⠀
DefiLlama's supply notes also record a later Litterbox burn of approximately 134.55 million JUP.
⠀
Purchasing tokens creates demand when the purchase occurs.
⠀
Holding them changes custody and available inventory.
⠀
Destroying them permanently changes supply.
⠀
Each action has a distinct economic effect.
⠀
07 | THE NET-ZERO CHANGE
⠀
The February 2026 Net-Zero proposal materially changed the supply framework.
⠀
DefiLlama records the proposal as passed.
⠀
Its measures included postponing Jupuary, pausing team reserve emissions, and changing the treatment of Mercurial allocations.
⠀
The published plan described using Jupiter's balance sheet to absorb eligible team sales and offset Mercurial sales.
⠀
That is a meaningful commitment.
⠀
It is also an implementation obligation.
⠀
Net-zero describes the intended net market impact.
⠀
It does not mean every remaining allocation has been destroyed or every token movement has stopped.
⠀
The practical test is actual distributions and matching purchases.
⠀
08 | THE UNLOCK QUESTION
⠀
Old JUP unlock calendars can now be misleading.
⠀
A previously scheduled distribution should not be presented as imminent without checking the revised policy.
⠀
Postponed allocations remain relevant because future governance can determine their use.
⠀
Paused emissions also differ from permanently canceled supply.
⠀
DefiLlama identifies several allocations remaining in protocol custody without a defined release schedule.
⠀
That reduces the usefulness of inventing a single next-unlock headline.
⠀
The better approach is to monitor governance decisions, custody balances, and actual changes in circulating supply.
⠀
Supply risk depends on what can enter the market and under which conditions.
⠀
A calendar alone cannot answer that.
⠀
09 | GOVERNANCE AND STAKING REWARDS
⠀
JUP connects holders to Jupiter's governance process.
⠀
The official dashboard reports approximately 1.17 billion JUP staked.
⠀
That is a participation measurement.
⠀
It is not permanently removed supply.
⠀
Likewise, a displayed staking yield should not be treated automatically as cash income generated by customers.
⠀
Investors need to examine the reward asset, funding source, distribution rules, and exit conditions.
⠀
Redistributing existing tokens differs from minting new ones.
⠀
But existing tokens can still become available to recipients willing to sell.
⠀
Governance influence, participation rewards, and buyback demand are separate parts of the investment thesis.
⠀
10 | THE VALUATION QUESTION
⠀
Annualizing $6.46 million of recent monthly protocol revenue gives approximately $77.5 million.
⠀
Against an $886 million market capitalization, that implies roughly 11.4 times annualized protocol revenue.
⠀
This is an illustrative comparison.
⠀
It is not a corporate earnings multiple.
⠀
It assumes the latest month is representative and does not establish distributable profit after all operating costs.
⠀
Using approximately 6.862 billion current total tokens:
⠀
$0.50 JUP implies ~$3.43B total-supply valuation.
$1.00 implies ~$6.86B.
$2.00 implies ~$13.72B.
$3.00 implies ~$20.59B.
⠀
These are valuation illustrations, not price targets.
⠀
Future burns and supply decisions can change the denominator.
⠀
11 | THE BULL AND BEAR CASE
⠀
THE BULL CASE:
⠀
Jupiter retains a valuable customer interface.
⠀
More users adopt monetized products.
⠀
Revenue becomes more diversified and durable.
⠀
Buybacks remain consistently funded.
⠀
Supply commitments are implemented transparently.
⠀
And product growth strengthens demand for JUP.
⠀
THE BEAR CASE:
⠀
Trading revenue contracts with market activity.
⠀
Competitors capture customers or compress margins.
⠀
Product expansion increases operational and security complexity.
⠀
Supply restrictions depend too heavily on continued discretionary support.
⠀
And platform success creates less token value than investors expect.
⠀
A successful application can still be an expensive token investment at the wrong valuation.
⠀
12 | THE FINAL VERDICT
⠀
Jupiter has measurable strengths.
⠀
Substantial user activity.
⠀
Multiple financial products.
⠀
Real protocol revenue.
⠀
And an established buyback framework.
⠀
Its revised supply policy also deserves more careful treatment than repeating an outdated dilution narrative.
⠀
But the investment case remains conditional.
⠀
A roughly $886 million market capitalization.
⠀
Approximately $1.83 billion in fully diluted value.
⠀
Less than half the current total supply classified as circulating.
⠀
And continuing dependence on revenue durability and policy execution.
⠀
My assessment:
⠀
JUP is a financial platform growth thesis with an identifiable token-demand mechanism.
⠀
The decisive evidence is sustained monetization that produces verifiable purchases alongside disciplined supply management.
⠀
More users create distribution.
⠀
More paid activity creates revenue.
⠀
Executed purchases create JUP demand.
⠀
Supply discipline determines how much of that demand benefits existing holders.
⠀
Bookmark this analysis before the next Solana DeFi rotation.
⠀
Which has the strongest long-term financial platform thesis?
⠀
$JUP , $RAY , or $HYPE ?
⠀
And can Jupiter turn its growing product ecosystem into sustainable token value?
⠀
Drop your view below.
#JUP #Ray #hype #CryptocurrencyWealth
1
260
Log in to explore more content
Join global crypto users on Binance Square
⚡️ Get latest and useful information about crypto.
💬 Trusted by the world’s largest crypto exchange.
👍 Discover real insights from verified creators.
Email / Phone number
Trending Topics
IsAnthropic’s$1.5TMarketCapJustified?
58,164 views
291 Discussing
Anthropic Set to Open at $105 in Record Nasdaq Debut
Binance News
·16 Likes
·18.7k views
BTCBelow$62KAmidHikeFearsAndShiftToAnthropic
14,978 views
95 Discussing
NvidiaBoardReportedlySplitOverHuang’sReturn
241,469 views
1,921 Discussing