
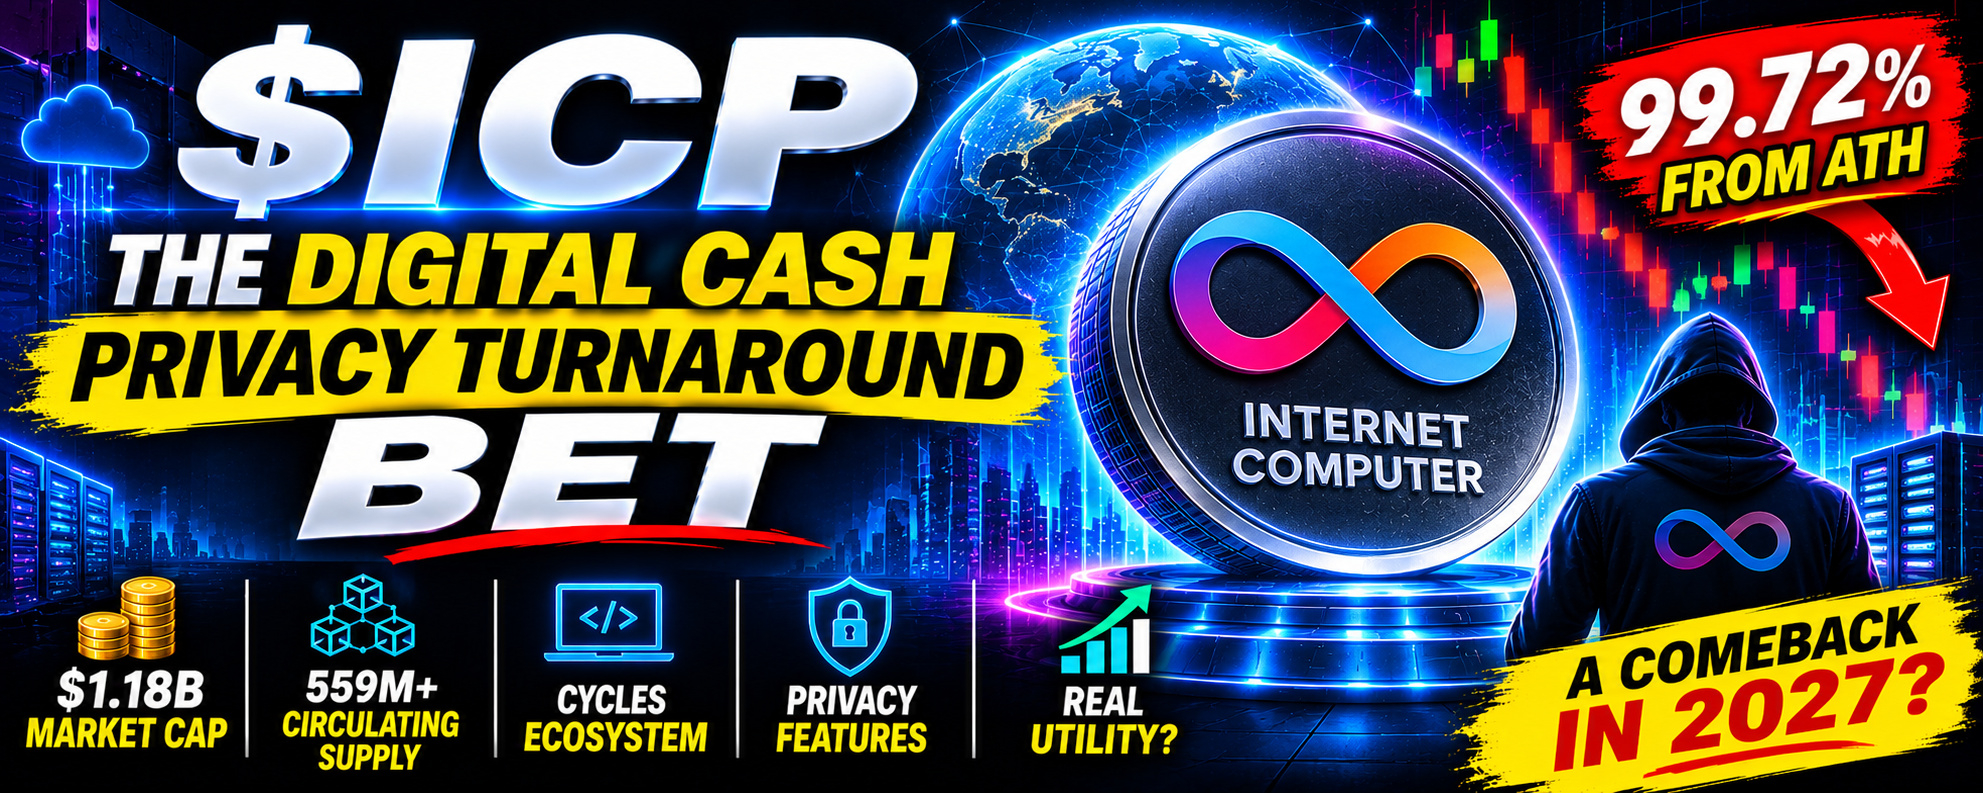

 A roughly $1.18 BILLION cryptocurrency.
More than 559 MILLION tokens circulating.
⠀A network where applications purchase computing resources by converting ICP into cycles.
⠀And a token trading approximately 99.7% below its recorded all-time high.
⠀But here's the contradiction.
⠀ICP has a direct connection between computing expenditure and token destruction.
⠀
That does not automatically mean the network destroys more tokens than it issues.
⠀
Is $ICP an overlooked bet on decentralized application hosting?

⠀
Or does its computing infrastructure still need much greater paid demand?
⠀
Let's examine the numbers.
⠀
01 | WHAT IS THE INTERNET COMPUTER?
⠀
The Internet Computer is a blockchain-based computing network.
⠀
Its canister smart contracts combine application code with persistent data.
⠀
The ambition extends beyond transferring assets.
⠀
Applications can use the network for hosting, storage, and computation.
⠀
ICP supports governance and is converted into cycles to fund those resources.
⠀
The investment thesis is that developers will pay for capabilities they cannot obtain as effectively elsewhere.
⠀
But a broad technical ambition is not a customer base.
⠀
The relevant evidence is useful software that remains active and funded.
⠀
Infrastructure creates capacity.
⠀
Customers establish its commercial value.
⠀
02 | THE NUMBERS THAT MATTER
⠀
November 20, 2026 retrieved snapshot:
⠀
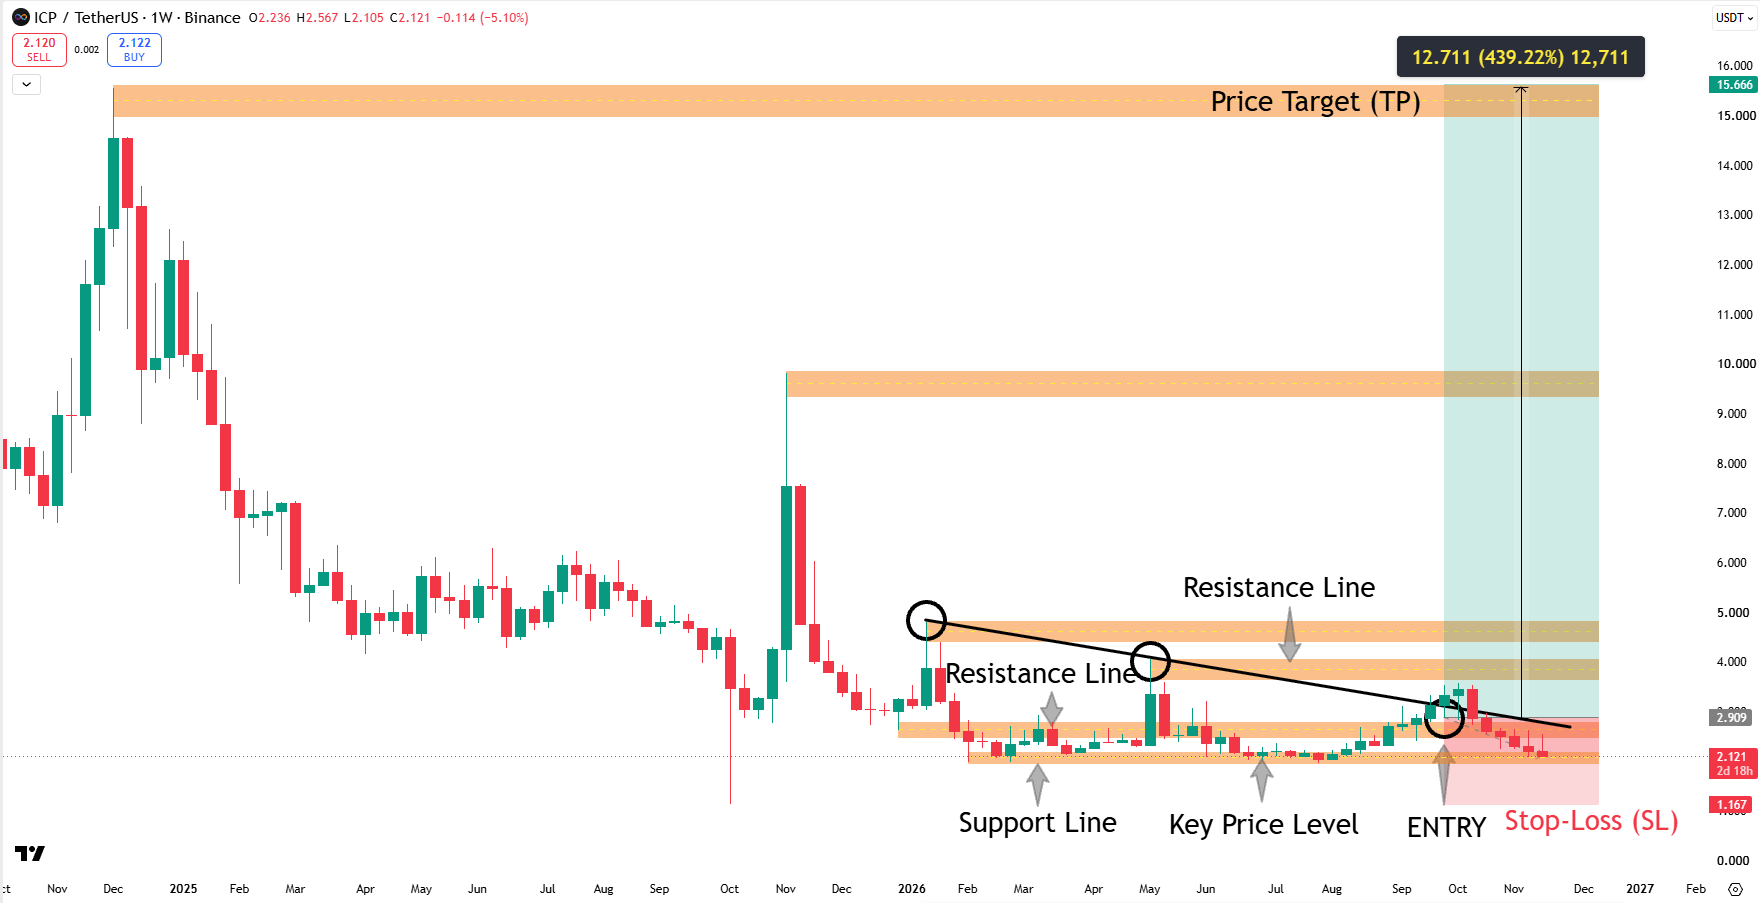
ICP Price: ~$2.11
Market Cap: ~$1.18B
Reported FDV: ~$1.18B
Circulating Supply: ~559.05M ICP
Reported Current Total Supply: ~559.05M ICP
Maximum Supply: No fixed cap
Circulating / Reported Current Total: ~100%
24H ICP Trading Volume: ~$39.72M
Recorded All-Time High: ~$750.73
Decline From Recorded ATH: ~99.72%
⠀
Similar market capitalization and reported FDV do not mean future issuance has ended.
⠀
The current total is a measurement, not a lifetime supply ceiling.
⠀
The recorded ATH is also not a fair-value benchmark.
⠀
The stronger operating comparison is tokens issued against tokens destroyed over the same period.
⠀
That comparison requires consistent definitions and complete data.
⠀
03 | THE CYCLE CONVERSION MECHANISM
⠀
Applications need cycles to purchase network resources.
⠀
Converting ICP into cycles destroys ICP.
⠀
Those cycles are then consumed as applications operate.
⠀
The token conversion and later cycle consumption are different stages of the same funding process.
⠀
They should not be counted as two separate ICP burns.
⠀
Timing matters too.
⠀
An application can spend a previously funded cycle balance without purchasing an identical amount of new cycles that day.
⠀
Therefore, computing activity and fresh token destruction need not move together in every short window.
⠀
The useful analysis follows both balances and flows.
⠀
04 | THE REVERSE-GAS OPPORTUNITY
⠀
Applications can fund their own operating resources rather than requiring every visitor to acquire tokens.
⠀
That can reduce onboarding friction.
⠀
A user may interact with a service without first managing a crypto balance.
⠀
For investors, that creates a different demand model.
⠀
The application operator becomes the resource purchaser.
⠀
The important question is whether operators continue funding useful services.
⠀
A large number of visits can produce modest spending if each interaction is inexpensive.
⠀
A smaller number of resource-intensive workloads can produce more.
⠀
User count alone does not establish computing revenue.
⠀
05 | STABLE PRICING CHANGES THE BURN MATH
⠀
Cycle pricing is anchored to the IMF's SDR.
⠀
That helps keep resource costs from moving directly with ICP's market price.
⠀
It also means token quantity and real spending can diverge.
⠀
At unchanged spending, a lower ICP price generally requires more tokens for the same cycle budget.
⠀
A higher price generally requires fewer.
⠀
Therefore, an increase in ICP destroyed does not automatically prove an equivalent increase in customer expenditure.
⠀
Investors should examine both the token amount and its value at conversion.
⠀
The customer buys computing resources.
⠀
The holder needs to understand how that purchase affects supply.
⠀
06 | THE ISSUANCE SIDE OF THE EQUATION
⠀
The network compensates node providers and governance participants.
⠀
These mechanisms can create new ICP.
⠀
Conversion into cycles and transaction-fee burns reduce supply.
⠀
The net result depends on the relationship between those flows.
⠀
A network can report growing burns while supply continues expanding.
⠀
Likewise, lower issuance can improve supply dynamics without establishing stronger customer demand.
⠀
Both are relevant.
⠀
They answer different questions.
⠀
A simplified framework:
⠀
New tokens issued minus tokens destroyed equals the net change from those mechanisms.
⠀
“ICP burns” describes a feature.
⠀
“ICP is net deflationary” requires measured evidence.
⠀
07 | NODE ECONOMICS NEED UTILIZATION
⠀
Node providers operate the hardware supporting applications.
⠀
Compensating them supports network availability.
⠀
But hardware availability alone does not establish economic efficiency.
⠀
The commercial question is how much useful demand that infrastructure serves.
⠀
Adding capacity can improve resilience and room for growth.
⠀
It can also increase the resources the network must support.
⠀
My assessment:
⠀
Expansion becomes more compelling when retained workloads and external spending justify it.
⠀
The useful measurements include utilization, resource consumption, and the cost of maintaining service.
⠀
Infrastructure scale is an input.
⠀
Productive demand determines the return on that input.
⠀
08 | CAFFEINE EXPANDS THE BUILDER FUNNEL
⠀
Caffeine allows users to create applications through conversation.
⠀
That can reduce the effort required to move from an idea to deployed software.
⠀
But application creation is not the same as application retention.
⠀
A generated project can remain unused.
⠀
A popular project can consume relatively little compute.
⠀
And a subsidized project may stop when support ends.
⠀
The stronger evidence is software that people continue using and someone continues paying to operate.
⠀
AI can increase the number of builders.
⠀
It cannot guarantee that their output becomes commercially useful.
⠀
The funding and retention data matter more than creation counts alone.
⠀
09 | MISSION 70 REQUIRES AN OUTCOME CHECK
⠀
DFINITY's Mission 70 paper targets at least a 70% reduction in ICP inflation by the end of 2026.
⠀
The framework combines supply-side adjustments with demand growth.
⠀
That is an important objective.
⠀
It should not be presented as a completed result without corresponding measurements.
⠀
Governance approval, implementation, and observed supply effects are separate checkpoints.
⠀
The baseline also matters.
⠀
Gross issuance and net supply growth can produce different reduction percentages.
⠀
A useful assessment compares the same measure over consistent periods.
⠀
A target explains the intended direction.
⠀
Onchain outcomes establish how much was delivered.
⠀
10 | THE VALUATION QUESTION
⠀
Using approximately 559.05 million current tokens:
⠀
$5 ICP implies ~$2.80B current-supply valuation.
$10 implies ~$5.59B.
$20 implies ~$11.18B.
$50 implies ~$27.95B.
$100 implies ~$55.91B.
⠀
Applying the recorded $750.73 ATH to today's supply implies approximately $419.7 billion.
⠀
These are valuation illustrations, not price targets.
⠀
Future net issuance or destruction changes the denominator.
⠀
The arithmetic shows why a historical peak is not a simple recovery destination.
⠀
At roughly $1.18 billion, the thesis depends on future utility, demand, and monetary value.
⠀
The drawdown alone cannot establish those expectations.
⠀
11 | THE BULL AND BEAR CASE
⠀
THE BULL CASE:
⠀
Developers maintain applications with retained users.
⠀
AI tools create more useful deployed software.
⠀
Organizations purchase recurring computing resources.
⠀
Infrastructure costs become more efficient.
⠀
And economic reforms improve the balance between issuance and destruction.
⠀
THE BEAR CASE:
⠀
Application creation produces limited repeat usage.
⠀
Customer expenditure remains modest.
⠀
Network compensation exceeds the supply effect of paid demand.
⠀
Competing infrastructure offers a better operating experience.
⠀
And token economics improve less than investors expect.
⠀
Technical differentiation can attract experimentation.
⠀
Sustained paid workloads provide stronger commercial evidence.
⠀
12 | THE FINAL VERDICT
⠀
ICP has an identifiable token-demand mechanism.
⠀
Applications require cycles.
⠀
ICP conversion funds those cycles and destroys tokens.
⠀
The network also provides a broader application-hosting environment.
⠀
But the investment case remains conditional.
⠀
A roughly $1.18 billion market capitalization.
⠀
No fixed maximum supply.
⠀
Continuing network compensation.
⠀
And a need for verified evidence that paid demand is improving the overall economics.
⠀
My assessment:
⠀
ICP is a computing commercialization thesis with a measurable supply-balance test.
⠀
The strongest evidence combines retained workloads, recurring external spending, and efficient participant compensation.
⠀
More applications create possibilities.
⠀
Retained users demonstrate usefulness.
⠀
Funded computing creates expenditure.
⠀
The balance between token destruction and issuance determines the supply outcome.
⠀
A 99.72% drawdown does not prove that balance is favorable.
⠀
Neither does a high transaction count.
⠀
Bookmark this analysis before the next decentralized computing rotation.
⠀
Which would change your view first?
⠀
Stronger recurring compute expenditure or verified improvement in net issuance?
⠀
And can ICP turn useful software into sustainable token demand?
⠀
Drop your view below.