

hs_dracula77
14 Posts

hs_dracula77
Report
Block User
1 Following
41 Followers
27 Liked
Posts
·
--
### AINUSDT – 1H Technical Analysis
Pattern: Ascending Triangle | Bullish Continuation Structure
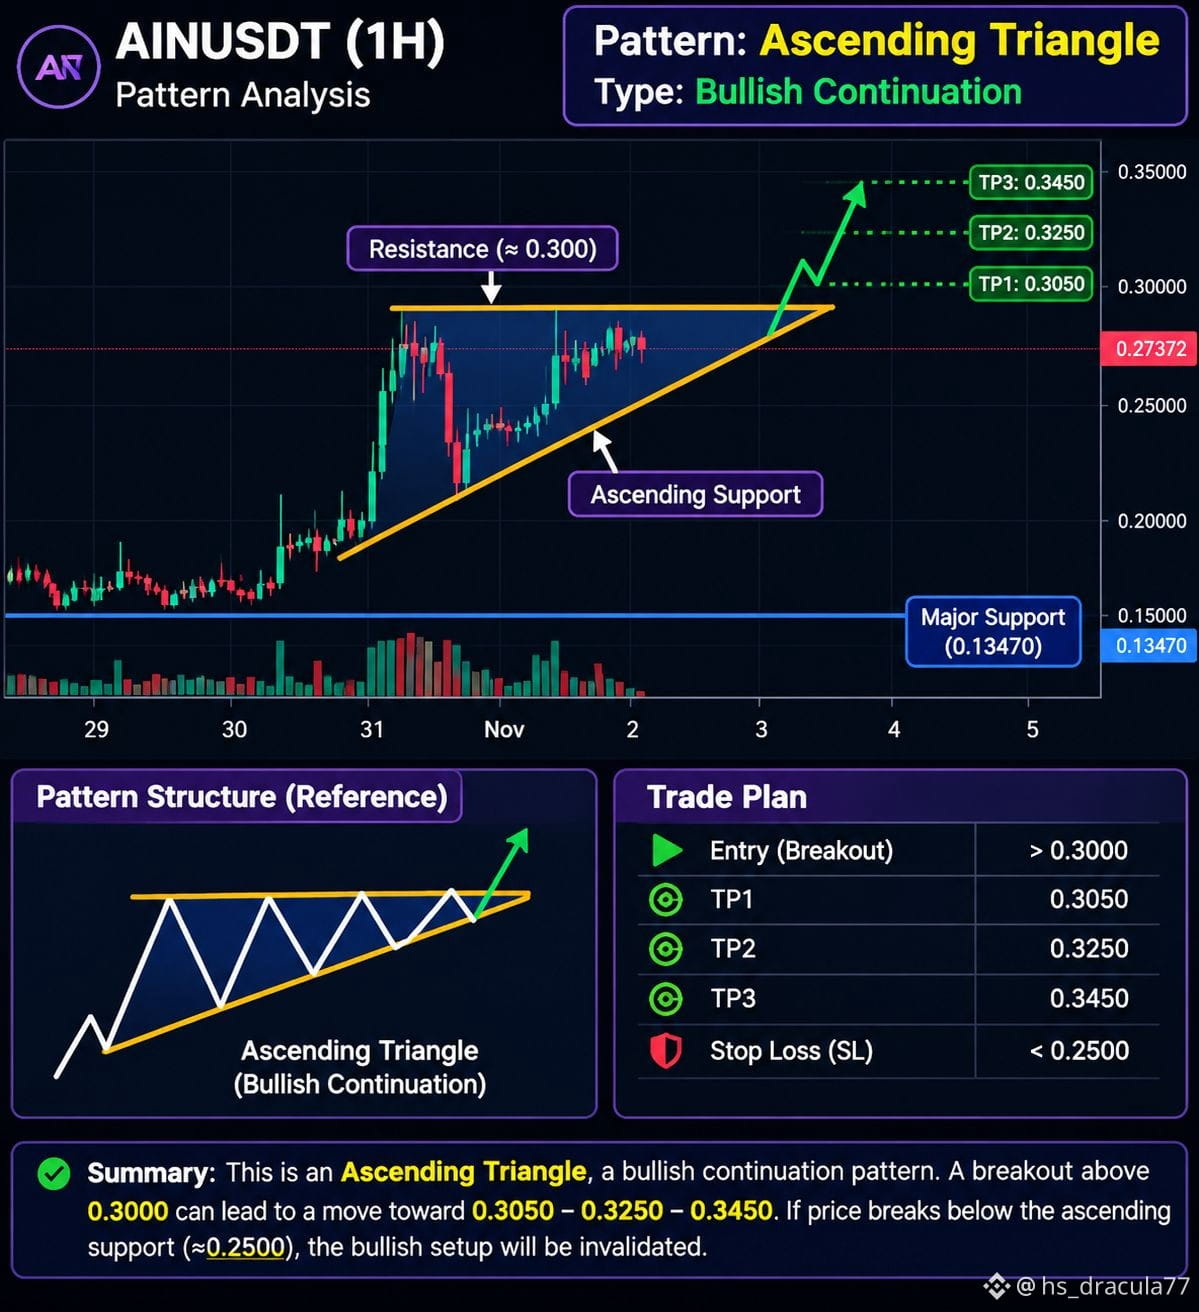
Current Price: $0.27372 Resistance Zone: $0.2900–$0.3000 Ascending Support: $0.2300–$0.2500 Major Support: $0.13470
### 1\. Market Structure
$AIN is forming an Ascending Triangle pattern on the 1-hour timeframe, which is generally considered a bullish continuation structure.
After a strong upward move, the price entered a consolidation phase. Buyers are gradually pushing the price higher, creating higher lows, while sellers continue defending the horizontal resistance around $0.2900–$0.3000.
This structure indicates that buying pressure may be building beneath resistance.
### 2\. Key Technical Levels
| Level | Price |
| -------------------- | -------- |
| Major Resistance | $0.3000 |
| Immediate Resistance | $0.2900 |
| Current Price | $0.27372 |
| First Support | $0.2500 |
| Second Support | $0.2300 |
| Major Support | $0.13470 |
### 3\. Bullish Scenario
If buyers successfully break above the $0.2900–$0.3000 resistance zone, we could see a bullish continuation.
Potential upside targets:
* TP1: $0.3050
* TP2: $0.3250
* TP3: $0.3450
A strong 1H candle close above $0.3000, followed by a successful retest, would provide stronger breakout confirmation.
Increasing volume during the breakout would further strengthen the bullish setup.
### 4\. Bearish Scenario
If the price fails to break resistance and loses the ascending trendline, bearish pressure could increase.
Important downside levels to monitor:
* $0.2500
* $0.2300
* $0.2000
$AIN breakdown below the rising support with strong selling volume could invalidate the bullish continuation structure.
### 5\. Volume & Order Book Analysis
The screenshot shows approximately:
* Buyers: 66.90%
* Sellers: 33.10%
$AIN currently shows a bullish consolidation structure through an Ascending Triangle pattern. Buyers are creating higher lows, while sellers are defending the $0.2900–$0.3000 resistance zone.
### AINUSDT – 1H Technical Analysis
Pattern: Ascending Triangle | Bullish Continuation Structure
Current Price: $0.27372 Resistance Zone: $0.2900–$0.3000 Ascending Support: $0.2300–$0.2500 Major Support: $0.13470
### 1\. Market Structure
$AIN is forming an Ascending Triangle pattern on the 1-hour timeframe, which is generally considered a bullish continuation structure.
After a strong upward move, the price entered a consolidation phase. Buyers are gradually pushing the price higher, creating higher lows, while sellers continue defending the horizontal resistance around $0.2900–$0.3000.
This structure indicates that buying pressure may be building beneath resistance.
### 2\. Key Technical Levels
| Level | Price |
| -------------------- | -------- |
| Major Resistance | $0.3000 |
| Immediate Resistance | $0.2900 |
| Current Price | $0.27372 |
| First Support | $0.2500 |
| Second Support | $0.2300 |
| Major Support | $0.13470 |
### 3\. Bullish Scenario
If buyers successfully break above the $0.2900–$0.3000 resistance zone, we could see a bullish continuation.
Potential upside targets:
* TP1: $0.3050
* TP2: $0.3250
* TP3: $0.3450
A strong 1H candle close above $0.3000, followed by a successful retest, would provide stronger breakout confirmation.
Increasing volume during the breakout would further strengthen the bullish setup.
### 4\. Bearish Scenario
If the price fails to break resistance and loses the ascending trendline, bearish pressure could increase.
Important downside levels to monitor:
* $0.2500
* $0.2300
* $0.2000
$AIN breakdown below the rising support with strong selling volume could invalidate the bullish continuation structure.
### 5\. Volume & Order Book Analysis
The screenshot shows approximately:
* Buyers: 66.90%
* Sellers: 33.10%
$AIN currently shows a bullish consolidation structure through an Ascending Triangle pattern. Buyers are creating higher lows, while sellers are defending the $0.2900–$0.3000 resistance zone.
Pattern: Ascending Triangle | Bullish Continuation Structure
Current Price: $0.27372 Resistance Zone: $0.2900–$0.3000 Ascending Support: $0.2300–$0.2500 Major Support: $0.13470
### 1\. Market Structure
$AIN is forming an Ascending Triangle pattern on the 1-hour timeframe, which is generally considered a bullish continuation structure.
After a strong upward move, the price entered a consolidation phase. Buyers are gradually pushing the price higher, creating higher lows, while sellers continue defending the horizontal resistance around $0.2900–$0.3000.
This structure indicates that buying pressure may be building beneath resistance.
### 2\. Key Technical Levels
| Level | Price |
| -------------------- | -------- |
| Major Resistance | $0.3000 |
| Immediate Resistance | $0.2900 |
| Current Price | $0.27372 |
| First Support | $0.2500 |
| Second Support | $0.2300 |
| Major Support | $0.13470 |
### 3\. Bullish Scenario
If buyers successfully break above the $0.2900–$0.3000 resistance zone, we could see a bullish continuation.
Potential upside targets:
* TP1: $0.3050
* TP2: $0.3250
* TP3: $0.3450
A strong 1H candle close above $0.3000, followed by a successful retest, would provide stronger breakout confirmation.
Increasing volume during the breakout would further strengthen the bullish setup.
### 4\. Bearish Scenario
If the price fails to break resistance and loses the ascending trendline, bearish pressure could increase.
Important downside levels to monitor:
* $0.2500
* $0.2300
* $0.2000
$AIN breakdown below the rising support with strong selling volume could invalidate the bullish continuation structure.
### 5\. Volume & Order Book Analysis
The screenshot shows approximately:
* Buyers: 66.90%
* Sellers: 33.10%
$AIN currently shows a bullish consolidation structure through an Ascending Triangle pattern. Buyers are creating higher lows, while sellers are defending the $0.2900–$0.3000 resistance zone.
493
·
--
$SAND — Daily Chart Analysis 📊
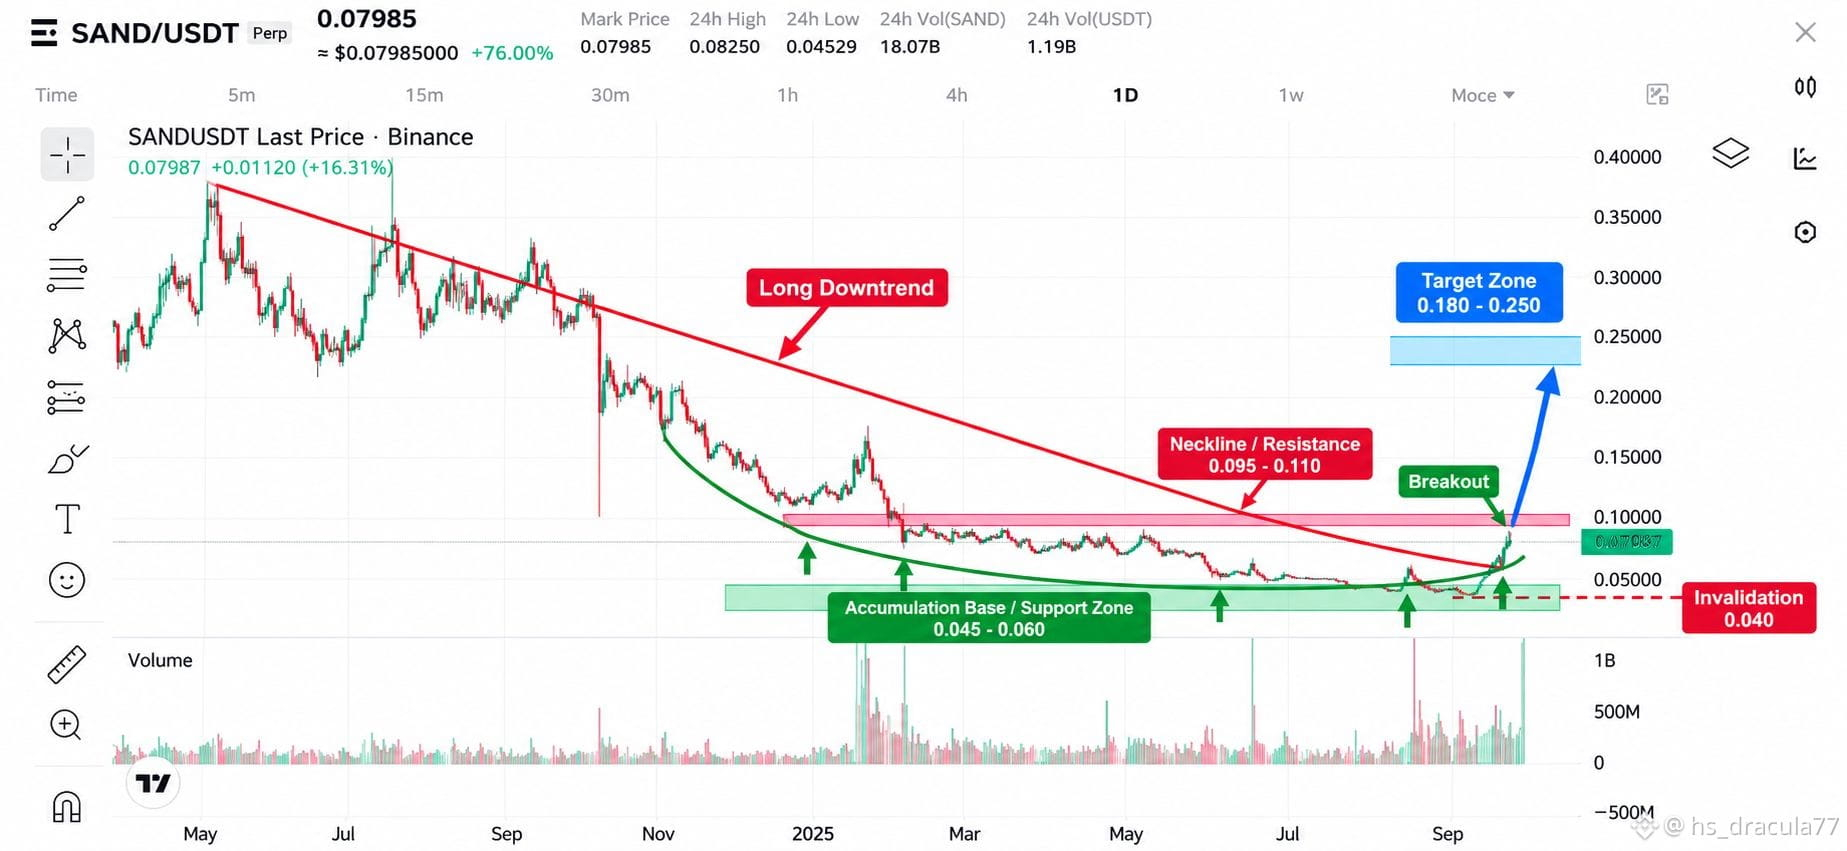
$SAND is showing a major structural shift after a prolonged downtrend.
Price spent months forming a broad accumulation/rounded-base structure around $0.045–$0.060, followed by a sharp volume expansion and strong bullish move.
🔥 Key Levels to Watch:
🟢 Support: $0.045–$0.060
🟡 Current breakout area: ~$0.080
🔴 Major resistance / neckline: $0.095–$0.110
🚀 Next major upside zone: $0.18–$0.25
⚠️ Structure invalidation: Below ~$0.040
What matters now?
The real confirmation comes if $SAND can achieve a daily close above $0.095–$0.110 with strong volume and then successfully hold that zone as support.
A rejection from this resistance could bring a pullback/retest toward the breakout area before another attempt.
My chart structure:
Long-term downtrend → accumulation → breakout attempt → resistance test.
Not financial advice. Always manage risk. 📈
#sand #TheSandbox #TheSandbox #CryptoTrends2024 #BinanceSquareTalks #Altcoins #CryptoTrading #TechnicalAnalysis #Trading #Web3 #GameFi #BinanceSquare
$SAND — Daily Chart Analysis 📊
$SAND is showing a major structural shift after a prolonged downtrend.
Price spent months forming a broad accumulation/rounded-base structure around $0.045–$0.060, followed by a sharp volume expansion and strong bullish move.
🔥 Key Levels to Watch:
🟢 Support: $0.045–$0.060
🟡 Current breakout area: ~$0.080
🔴 Major resistance / neckline: $0.095–$0.110
🚀 Next major upside zone: $0.18–$0.25
⚠️ Structure invalidation: Below ~$0.040
What matters now?
The real confirmation comes if $SAND can achieve a daily close above $0.095–$0.110 with strong volume and then successfully hold that zone as support.
A rejection from this resistance could bring a pullback/retest toward the breakout area before another attempt.
My chart structure:
Long-term downtrend → accumulation → breakout attempt → resistance test.
Not financial advice. Always manage risk. 📈
#sand #TheSandbox #TheSandbox #CryptoTrends2024 #BinanceSquareTalks #Altcoins #CryptoTrading #TechnicalAnalysis #Trading #Web3 #GameFi #BinanceSquare
$SAND is showing a major structural shift after a prolonged downtrend.
Price spent months forming a broad accumulation/rounded-base structure around $0.045–$0.060, followed by a sharp volume expansion and strong bullish move.
🔥 Key Levels to Watch:
🟢 Support: $0.045–$0.060
🟡 Current breakout area: ~$0.080
🔴 Major resistance / neckline: $0.095–$0.110
🚀 Next major upside zone: $0.18–$0.25
⚠️ Structure invalidation: Below ~$0.040
What matters now?
The real confirmation comes if $SAND can achieve a daily close above $0.095–$0.110 with strong volume and then successfully hold that zone as support.
A rejection from this resistance could bring a pullback/retest toward the breakout area before another attempt.
My chart structure:
Long-term downtrend → accumulation → breakout attempt → resistance test.
Not financial advice. Always manage risk. 📈
#sand #TheSandbox #TheSandbox #CryptoTrends2024 #BinanceSquareTalks #Altcoins #CryptoTrading #TechnicalAnalysis #Trading #Web3 #GameFi #BinanceSquare
237
·
--
NEAR/USDT — 4H Technical Analysis
Current Price: ~$5.29
Timeframe: 4H
Market Structure: Bullish
1. Overall Trend
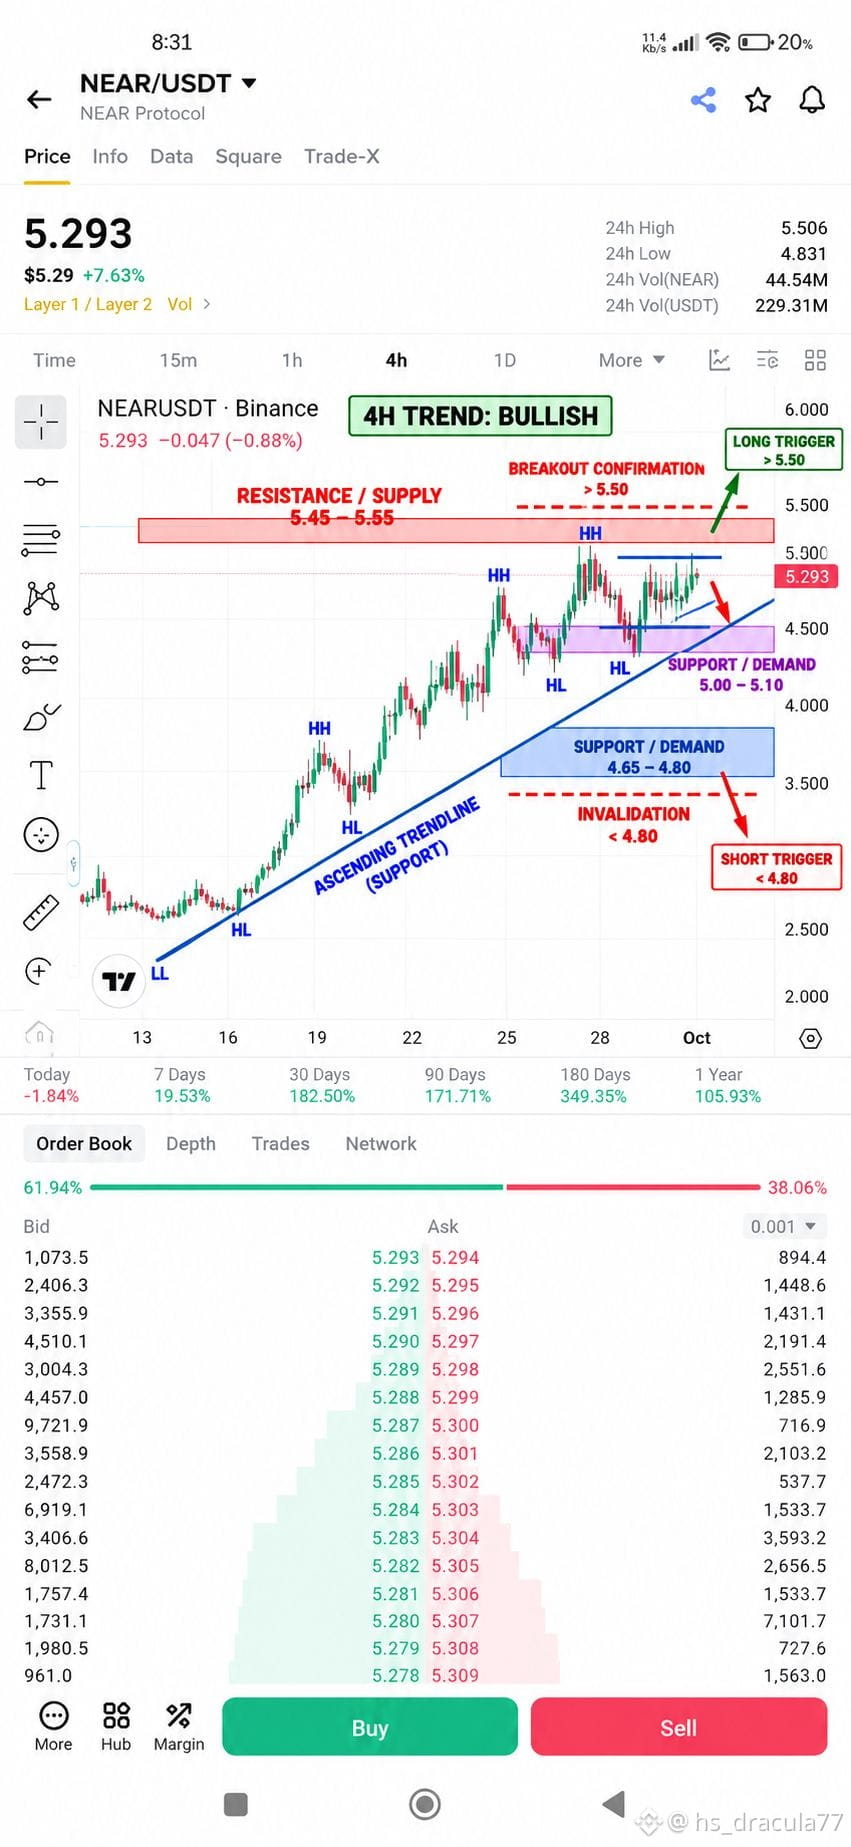
$NEAR is currently trading in a clear Higher High (HH) + Higher Low (HL) structure.
The ascending trendline is acting as dynamic support, which means buyers are still defending the broader uptrend.
2. Key Resistance / Supply
5.45 – 5.55
This is the major resistance zone. Price has already tested this area and faced rejection.
A strong 4H candle close above 5.55 would provide a stronger breakout confirmation.
Potential upside levels after confirmation:
5.70
5.85
6.00
3. Key Support / Demand
First support: 5.00 – 5.10
This is the nearest demand area. Holding this zone would keep the current bullish structure healthy.
Major support: 4.65 – 4.80
This is the more important structural support zone and sits close to the ascending trendline.
4. Bullish Scenario
If $NEAR holds 5.00–5.10 and buyers push price through 5.50–5.55, the breakout could open the way toward the 5.70–6.00 area.
The cleaner confirmation would be:
Breakout → 4H close above resistance → retest → continuation
5. Bearish Scenario
If price gets rejected from 5.45–5.55 and loses 5.00, a deeper pullback toward 4.65–4.80 becomes important to watch.
A decisive 4H breakdown below 4.65–4.80 would weaken the current HH/HL structure and indicate that the bullish trend is losing strength.
6. Pattern
The chart is primarily showing an ascending bullish market structure, supported by an ascending trendline.
It is not a confirmed Head & Shoulders or Double Top at this point.
Trading Map
Area Interpretation
5.50–5.55 Major resistance / breakout zone
5.00–5.10 First demand/support
4.65–4.80 Major structural support
Above 5.55 Bullish breakout confirmation
Below 4.80 Bullish structure weakens
Bottom line: The 4H structure remains bullish while $NEAR maintains its HH/HL pattern and stays above the major 4.65–4.80 support area. The key battle is currently around 5.45–5.55 resistance.
NEAR/USDT — 4H Technical Analysis
Current Price: ~$5.29
Timeframe: 4H
Market Structure: Bullish
1. Overall Trend
$NEAR is currently trading in a clear Higher High (HH) + Higher Low (HL) structure.
The ascending trendline is acting as dynamic support, which means buyers are still defending the broader uptrend.
2. Key Resistance / Supply
5.45 – 5.55
This is the major resistance zone. Price has already tested this area and faced rejection.
A strong 4H candle close above 5.55 would provide a stronger breakout confirmation.
Potential upside levels after confirmation:
5.70
5.85
6.00
3. Key Support / Demand
First support: 5.00 – 5.10
This is the nearest demand area. Holding this zone would keep the current bullish structure healthy.
Major support: 4.65 – 4.80
This is the more important structural support zone and sits close to the ascending trendline.
4. Bullish Scenario
If $NEAR holds 5.00–5.10 and buyers push price through 5.50–5.55, the breakout could open the way toward the 5.70–6.00 area.
The cleaner confirmation would be:
Breakout → 4H close above resistance → retest → continuation
5. Bearish Scenario
If price gets rejected from 5.45–5.55 and loses 5.00, a deeper pullback toward 4.65–4.80 becomes important to watch.
A decisive 4H breakdown below 4.65–4.80 would weaken the current HH/HL structure and indicate that the bullish trend is losing strength.
6. Pattern
The chart is primarily showing an ascending bullish market structure, supported by an ascending trendline.
It is not a confirmed Head & Shoulders or Double Top at this point.
Trading Map
Area Interpretation
5.50–5.55 Major resistance / breakout zone
5.00–5.10 First demand/support
4.65–4.80 Major structural support
Above 5.55 Bullish breakout confirmation
Below 4.80 Bullish structure weakens
Bottom line: The 4H structure remains bullish while $NEAR maintains its HH/HL pattern and stays above the major 4.65–4.80 support area. The key battle is currently around 5.45–5.55 resistance.
Current Price: ~$5.29
Timeframe: 4H
Market Structure: Bullish
1. Overall Trend
$NEAR is currently trading in a clear Higher High (HH) + Higher Low (HL) structure.
The ascending trendline is acting as dynamic support, which means buyers are still defending the broader uptrend.
2. Key Resistance / Supply
5.45 – 5.55
This is the major resistance zone. Price has already tested this area and faced rejection.
A strong 4H candle close above 5.55 would provide a stronger breakout confirmation.
Potential upside levels after confirmation:
5.70
5.85
6.00
3. Key Support / Demand
First support: 5.00 – 5.10
This is the nearest demand area. Holding this zone would keep the current bullish structure healthy.
Major support: 4.65 – 4.80
This is the more important structural support zone and sits close to the ascending trendline.
4. Bullish Scenario
If $NEAR holds 5.00–5.10 and buyers push price through 5.50–5.55, the breakout could open the way toward the 5.70–6.00 area.
The cleaner confirmation would be:
Breakout → 4H close above resistance → retest → continuation
5. Bearish Scenario
If price gets rejected from 5.45–5.55 and loses 5.00, a deeper pullback toward 4.65–4.80 becomes important to watch.
A decisive 4H breakdown below 4.65–4.80 would weaken the current HH/HL structure and indicate that the bullish trend is losing strength.
6. Pattern
The chart is primarily showing an ascending bullish market structure, supported by an ascending trendline.
It is not a confirmed Head & Shoulders or Double Top at this point.
Trading Map
Area Interpretation
5.50–5.55 Major resistance / breakout zone
5.00–5.10 First demand/support
4.65–4.80 Major structural support
Above 5.55 Bullish breakout confirmation
Below 4.80 Bullish structure weakens
Bottom line: The 4H structure remains bullish while $NEAR maintains its HH/HL pattern and stays above the major 4.65–4.80 support area. The key battle is currently around 5.45–5.55 resistance.
119
·
--
QNTUSDT 4H — Strong Technical Analysis
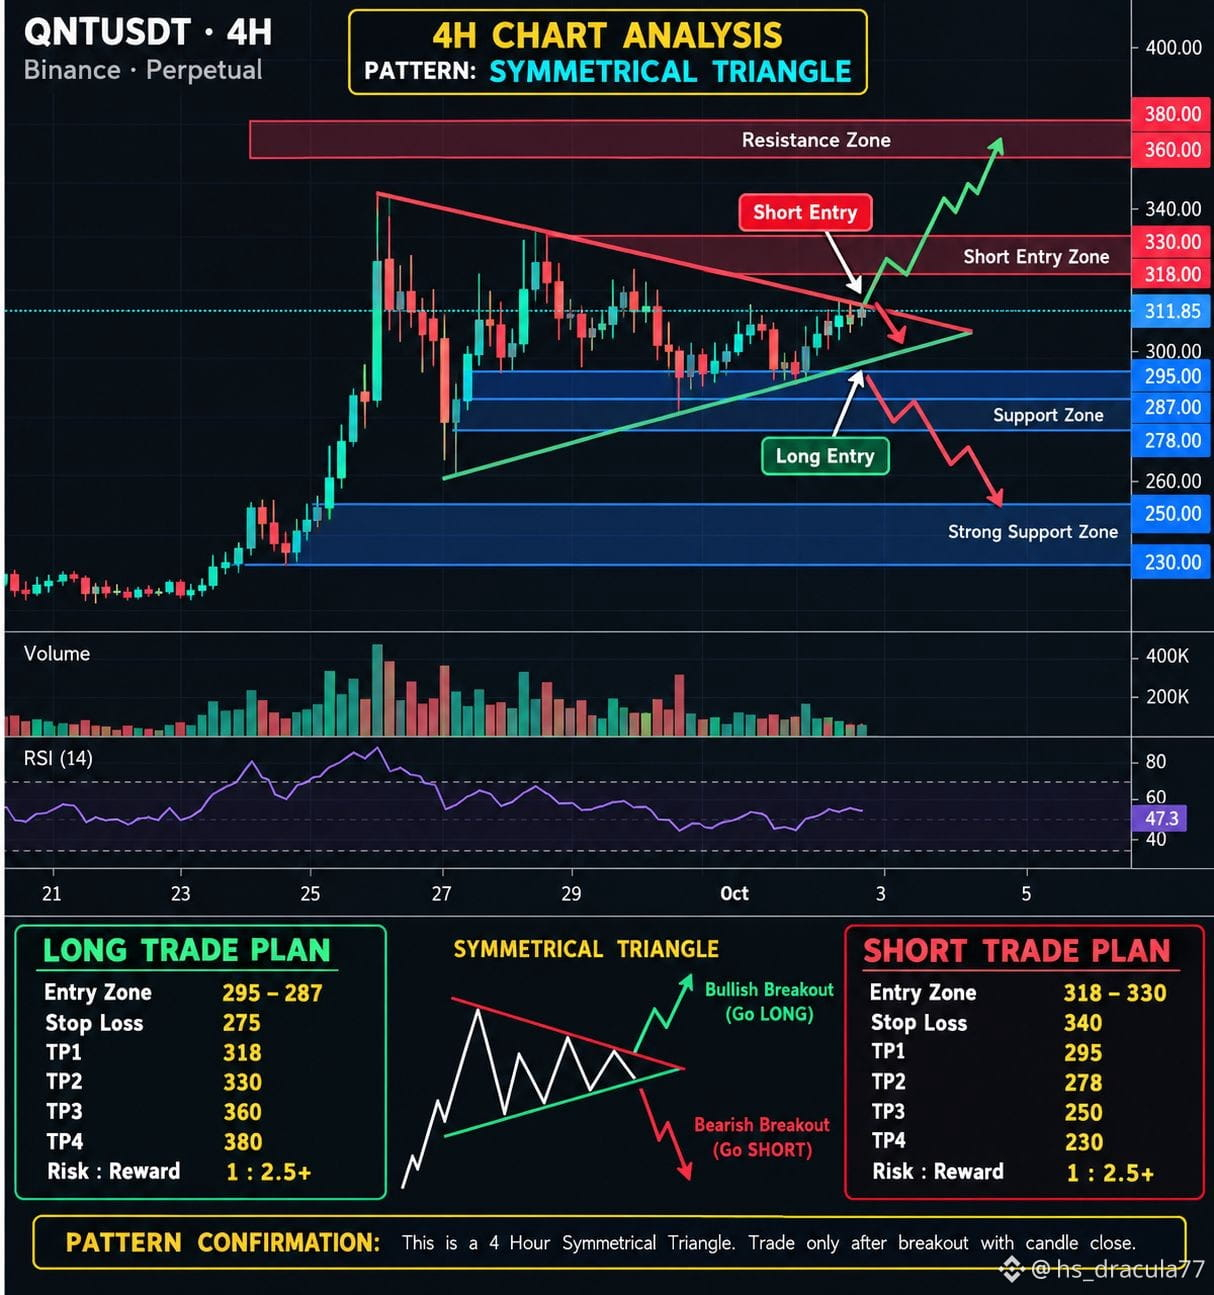
Based on the 4H chart you provided, $QNT is forming a Symmetrical Triangle after a strong impulsive move upward.
Price is currently around $311.85, approaching the triangle’s apex, so volatility expansion could be close. The key point is that the breakout direction needs confirmation rather than entering in the middle of the pattern.
🔺 Pattern Structure
Pattern: 4H Symmetrical Triangle
Current price: ~$311.85
Upper resistance: $318 → $330
Major resistance: $360–$380
First support: $295
Key support: $287
Lower support: $278
Major downside support: $250–$230
🟢 Bullish Scenario
A clean 4H candle close above $318, followed by a successful retest, would strengthen the bullish breakout setup.
Potential levels:
Entry: $318–$322 after confirmation/retest
TP1: $330
TP2: $360
TP3: $380
Invalidation: sustained move back below the breakout area
A breakout above $330 with strong volume would provide stronger confirmation of continuation toward the higher resistance zone.
🔴 Bearish Scenario
If $QNT loses the lower triangle support and gets a 4H close below $295, the structure becomes bearish.
Confirmation improves below $287.
Potential downside levels:
TP1: $287
TP2: $278
TP3: $250
Extended support: $230
⚠️ Important
At $311–312, price is sitting inside the pattern—not at an ideal confirmation point. Chasing a trade here carries higher false-breakout risk.
My chart-based plan:
Wait for the triangle to break.
Above $318/$330 → bullish confirmation.
Below $295/$287 → bearish confirmation.
Volume should expand with the breakout; a breakout with weak volume has a higher chance of being a fakeout.
---
📌 Binance Square Post — Copy/Paste
QNTUSDT 4H Technical Analysis 🔥
$QNT is currently forming a 4H Symmetrical Triangle after a strong upward move.
Price is trading around $311.85, very close to the triangle apex, which means a volatility expansion could be approaching.
🔵 Key Resistance:
$318 → $330
#QNTUSDT #QNTUSDT #Crypto
QNTUSDT 4H — Strong Technical Analysis
Based on the 4H chart you provided, $QNT is forming a Symmetrical Triangle after a strong impulsive move upward.
Price is currently around $311.85, approaching the triangle’s apex, so volatility expansion could be close. The key point is that the breakout direction needs confirmation rather than entering in the middle of the pattern.
🔺 Pattern Structure
Pattern: 4H Symmetrical Triangle
Current price: ~$311.85
Upper resistance: $318 → $330
Major resistance: $360–$380
First support: $295
Key support: $287
Lower support: $278
Major downside support: $250–$230
🟢 Bullish Scenario
A clean 4H candle close above $318, followed by a successful retest, would strengthen the bullish breakout setup.
Potential levels:
Entry: $318–$322 after confirmation/retest
TP1: $330
TP2: $360
TP3: $380
Invalidation: sustained move back below the breakout area
A breakout above $330 with strong volume would provide stronger confirmation of continuation toward the higher resistance zone.
🔴 Bearish Scenario
If $QNT loses the lower triangle support and gets a 4H close below $295, the structure becomes bearish.
Confirmation improves below $287.
Potential downside levels:
TP1: $287
TP2: $278
TP3: $250
Extended support: $230
⚠️ Important
At $311–312, price is sitting inside the pattern—not at an ideal confirmation point. Chasing a trade here carries higher false-breakout risk.
My chart-based plan:
Wait for the triangle to break.
Above $318/$330 → bullish confirmation.
Below $295/$287 → bearish confirmation.
Volume should expand with the breakout; a breakout with weak volume has a higher chance of being a fakeout.
---
📌 Binance Square Post — Copy/Paste
QNTUSDT 4H Technical Analysis 🔥
$QNT is currently forming a 4H Symmetrical Triangle after a strong upward move.
Price is trading around $311.85, very close to the triangle apex, which means a volatility expansion could be approaching.
🔵 Key Resistance:
$318 → $330
#QNTUSDT #QNTUSDT #Crypto
Based on the 4H chart you provided, $QNT is forming a Symmetrical Triangle after a strong impulsive move upward.
Price is currently around $311.85, approaching the triangle’s apex, so volatility expansion could be close. The key point is that the breakout direction needs confirmation rather than entering in the middle of the pattern.
🔺 Pattern Structure
Pattern: 4H Symmetrical Triangle
Current price: ~$311.85
Upper resistance: $318 → $330
Major resistance: $360–$380
First support: $295
Key support: $287
Lower support: $278
Major downside support: $250–$230
🟢 Bullish Scenario
A clean 4H candle close above $318, followed by a successful retest, would strengthen the bullish breakout setup.
Potential levels:
Entry: $318–$322 after confirmation/retest
TP1: $330
TP2: $360
TP3: $380
Invalidation: sustained move back below the breakout area
A breakout above $330 with strong volume would provide stronger confirmation of continuation toward the higher resistance zone.
🔴 Bearish Scenario
If $QNT loses the lower triangle support and gets a 4H close below $295, the structure becomes bearish.
Confirmation improves below $287.
Potential downside levels:
TP1: $287
TP2: $278
TP3: $250
Extended support: $230
⚠️ Important
At $311–312, price is sitting inside the pattern—not at an ideal confirmation point. Chasing a trade here carries higher false-breakout risk.
My chart-based plan:
Wait for the triangle to break.
Above $318/$330 → bullish confirmation.
Below $295/$287 → bearish confirmation.
Volume should expand with the breakout; a breakout with weak volume has a higher chance of being a fakeout.
---
📌 Binance Square Post — Copy/Paste
QNTUSDT 4H Technical Analysis 🔥
$QNT is currently forming a 4H Symmetrical Triangle after a strong upward move.
Price is trading around $311.85, very close to the triangle apex, which means a volatility expansion could be approaching.
🔵 Key Resistance:
$318 → $330
#QNTUSDT #QNTUSDT #Crypto
241
·
--
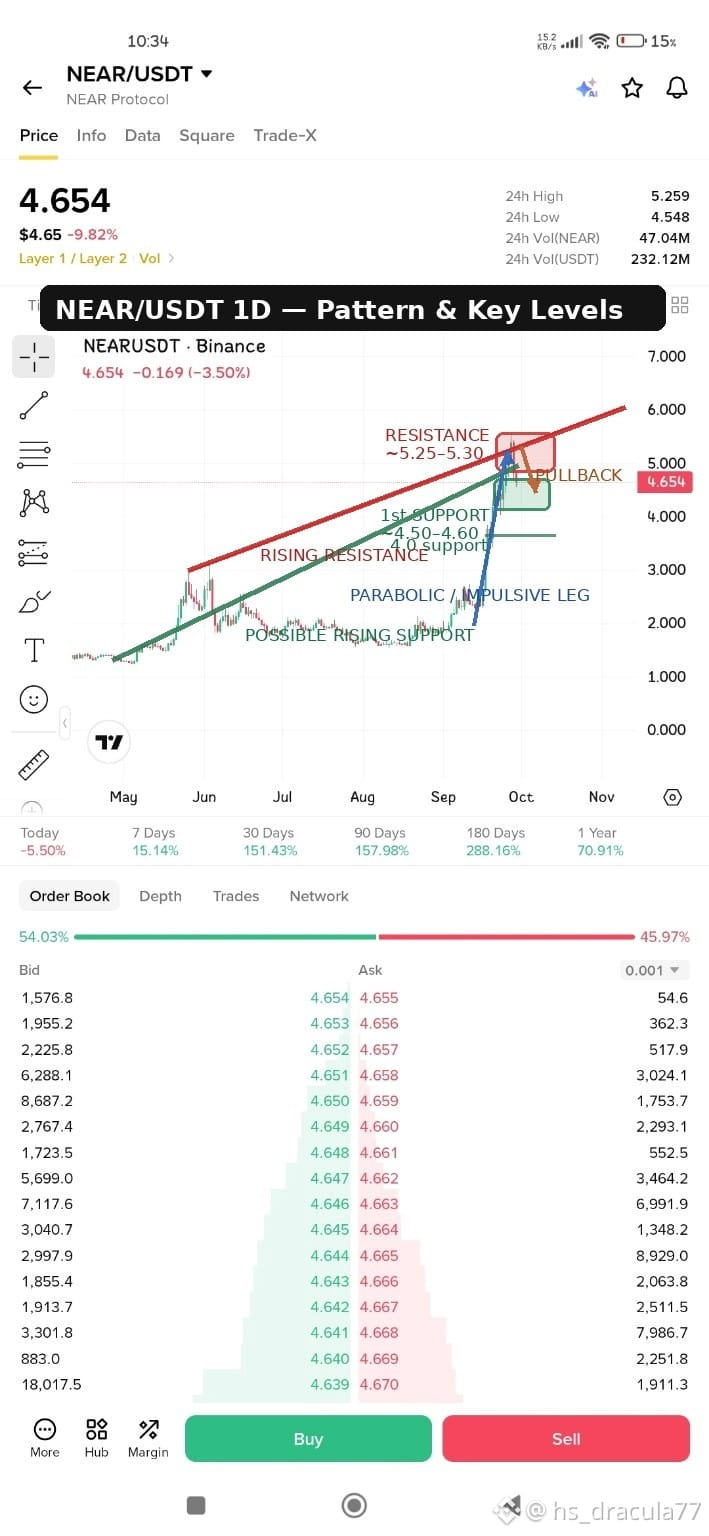
NEAR/USDT — 1D Chart Analysis 📊
$NEAR is currently showing a strong bullish recovery with a steep impulsive move, but price has now entered a major resistance area.
🔴 Resistance: $5.25–$5.30
If price breaks and holds above this zone with strong volume, the next major area to watch is around $6.00.
🟢 Immediate Support: $4.50–$4.60
A daily close below this zone could signal a deeper pullback toward $4.00.
📈 Structure: Price is trading within a rising structure, while the latest rally has become almost parabolic. After $NEAR such a sharp move, consolidation or a pullback would not be unusual.
Key levels to watch:
• $5.30 → breakout confirmation zone
• $4.60 → immediate support
• $4.00 → deeper support
• $6.00 → next upside area
The key question: Can $NEAR reclaim and hold above $5.30, or will resistance trigger another pullback?
#NEAR #NEARProtocol #Crypto #CryptoAnalysis #BinanceSquare #Altcoins #Trading
NEAR/USDT — 1D Chart Analysis 📊
$NEAR is currently showing a strong bullish recovery with a steep impulsive move, but price has now entered a major resistance area.
🔴 Resistance: $5.25–$5.30
If price breaks and holds above this zone with strong volume, the next major area to watch is around $6.00.
🟢 Immediate Support: $4.50–$4.60
A daily close below this zone could signal a deeper pullback toward $4.00.
📈 Structure: Price is trading within a rising structure, while the latest rally has become almost parabolic. After $NEAR such a sharp move, consolidation or a pullback would not be unusual.
Key levels to watch:
• $5.30 → breakout confirmation zone
• $4.60 → immediate support
• $4.00 → deeper support
• $6.00 → next upside area
The key question: Can $NEAR reclaim and hold above $5.30, or will resistance trigger another pullback?
#NEAR #NEARProtocol #Crypto #CryptoAnalysis #BinanceSquare #Altcoins #Trading
$NEAR is currently showing a strong bullish recovery with a steep impulsive move, but price has now entered a major resistance area.
🔴 Resistance: $5.25–$5.30
If price breaks and holds above this zone with strong volume, the next major area to watch is around $6.00.
🟢 Immediate Support: $4.50–$4.60
A daily close below this zone could signal a deeper pullback toward $4.00.
📈 Structure: Price is trading within a rising structure, while the latest rally has become almost parabolic. After $NEAR such a sharp move, consolidation or a pullback would not be unusual.
Key levels to watch:
• $5.30 → breakout confirmation zone
• $4.60 → immediate support
• $4.00 → deeper support
• $6.00 → next upside area
The key question: Can $NEAR reclaim and hold above $5.30, or will resistance trigger another pullback?
#NEAR #NEARProtocol #Crypto #CryptoAnalysis #BinanceSquare #Altcoins #Trading
131
·
--
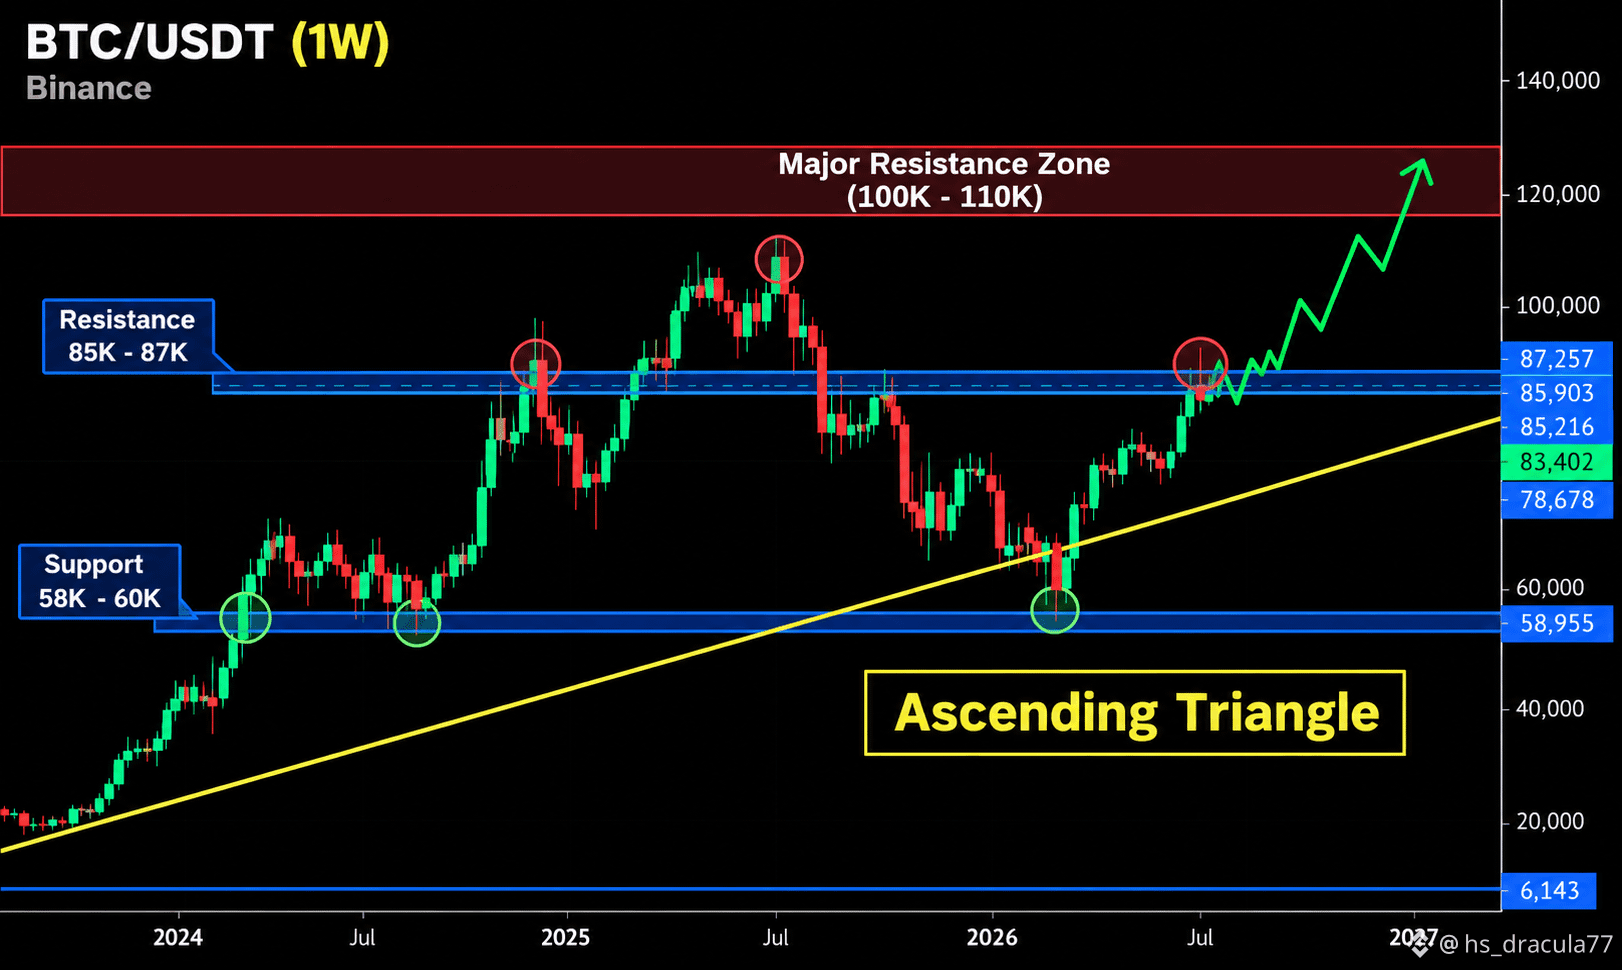
BTC/USDT – Weekly Chart Analysis
$BTC is currently testing the $85K–$87K resistance zone. On the weekly chart, price structure is forming an ascending-triangle type setup: higher lows are developing while price repeatedly approaches the same resistance area.
Resistance: $85K–$87K
Immediate support: ~$78.7K
Major support: $58K–$60K
A weekly close above $87K would be an important confirmation of a breakout.
If $BTC gets rejected here, the $78.7K area becomes an important level to watch.
If the breakout confirms, the next major historical resistance area shown on the chart is around $100K–$110K.
Key point: Don't treat the triangle as confirmed until BTC gets a convincing weekly breakout and holds above the resistance zone. A wick above resistance followed by a close back below it could be a false breakout.
Binance Square caption:
$BTC Weekly Setup 👀
BTC is approaching the key $85K–$87K resistance zone, while the weekly structure continues to show higher lows.
A confirmed weekly breakout above $87K could open the way toward the next major resistance areas.
If rejected, $78.7K is the first key support to watch, while $58K–$60K remains the major higher-timeframe support zone.
The setup is interesting, but confirmation matters more than anticipation. 📊
Not financial advice.
BTC/USDT – Weekly Chart Analysis
$BTC is currently testing the $85K–$87K resistance zone. On the weekly chart, price structure is forming an ascending-triangle type setup: higher lows are developing while price repeatedly approaches the same resistance area.
Resistance: $85K–$87K
Immediate support: ~$78.7K
Major support: $58K–$60K
A weekly close above $87K would be an important confirmation of a breakout.
If $BTC gets rejected here, the $78.7K area becomes an important level to watch.
If the breakout confirms, the next major historical resistance area shown on the chart is around $100K–$110K.
Key point: Don't treat the triangle as confirmed until BTC gets a convincing weekly breakout and holds above the resistance zone. A wick above resistance followed by a close back below it could be a false breakout.
Binance Square caption:
$BTC Weekly Setup 👀
BTC is approaching the key $85K–$87K resistance zone, while the weekly structure continues to show higher lows.
A confirmed weekly breakout above $87K could open the way toward the next major resistance areas.
If rejected, $78.7K is the first key support to watch, while $58K–$60K remains the major higher-timeframe support zone.
The setup is interesting, but confirmation matters more than anticipation. 📊
Not financial advice.
$BTC is currently testing the $85K–$87K resistance zone. On the weekly chart, price structure is forming an ascending-triangle type setup: higher lows are developing while price repeatedly approaches the same resistance area.
Resistance: $85K–$87K
Immediate support: ~$78.7K
Major support: $58K–$60K
A weekly close above $87K would be an important confirmation of a breakout.
If $BTC gets rejected here, the $78.7K area becomes an important level to watch.
If the breakout confirms, the next major historical resistance area shown on the chart is around $100K–$110K.
Key point: Don't treat the triangle as confirmed until BTC gets a convincing weekly breakout and holds above the resistance zone. A wick above resistance followed by a close back below it could be a false breakout.
Binance Square caption:
$BTC Weekly Setup 👀
BTC is approaching the key $85K–$87K resistance zone, while the weekly structure continues to show higher lows.
A confirmed weekly breakout above $87K could open the way toward the next major resistance areas.
If rejected, $78.7K is the first key support to watch, while $58K–$60K remains the major higher-timeframe support zone.
The setup is interesting, but confirmation matters more than anticipation. 📊
Not financial advice.
91
·
--
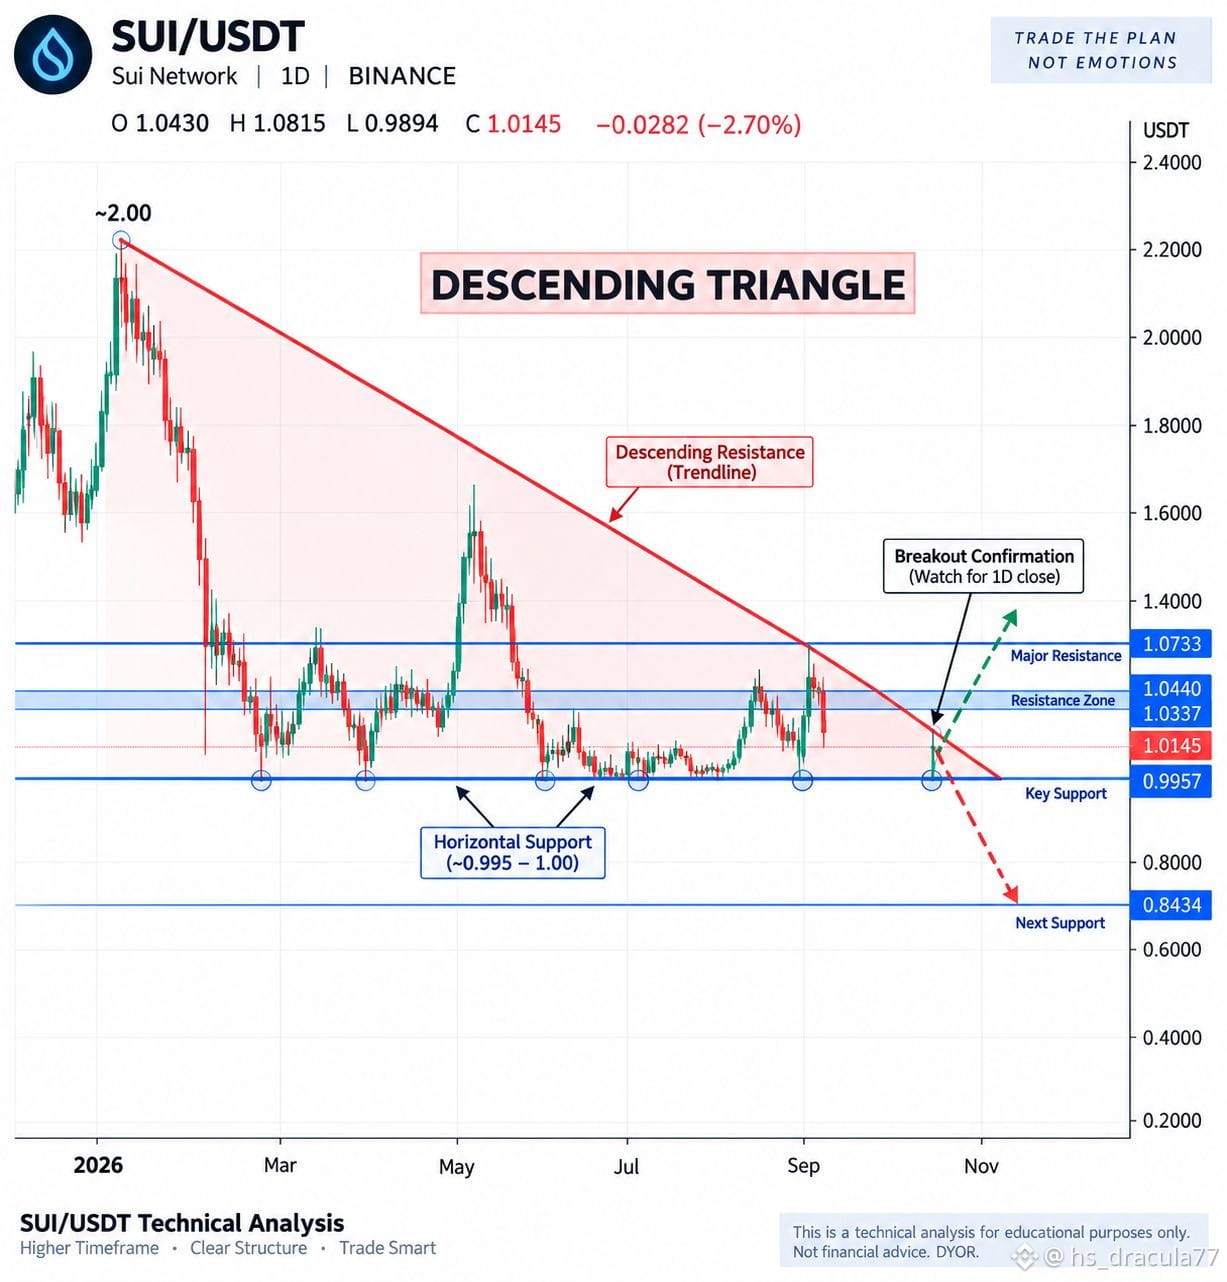
SUI/USDT — 1D Technical Analysis 📊
$SUI is currently trading around $1.0145 and is sitting at a critical decision zone on the daily timeframe.
The overall structure of $SUI is forming a Descending Triangle, with a clear descending resistance trendline from the ~$2.00 area and horizontal support around $0.995–$1.00.
Key Levels:
🔴 Resistance: $1.0337–$1.0440
🔴 Major resistance: $1.0733
🟡 Current price: ~$1.0145
🟢 Key support: $0.9957
🟢 Major lower support: $0.8434
Bullish scenario:
A strong daily close above the descending trendline and $1.0440 could open the way toward $1.0733 and potentially higher levels.
Bearish scenario:
If $SUI loses $0.9957 with a confirmed daily close below support, the triangle could break downward, with $0.8434 becoming an important lower support area.
For now, $0.9957–$1.0440 is the key battle zone. I would wait for confirmation rather than treating an intraday wick as a confirmed breakout/breakdown.
Technical analysis only — not financial advice. DYOR.
#SUİ #crypto #SUIAnalysis
SUI/USDT — 1D Technical Analysis 📊
$SUI is currently trading around $1.0145 and is sitting at a critical decision zone on the daily timeframe.
The overall structure of $SUI is forming a Descending Triangle, with a clear descending resistance trendline from the ~$2.00 area and horizontal support around $0.995–$1.00.
Key Levels:
🔴 Resistance: $1.0337–$1.0440
🔴 Major resistance: $1.0733
🟡 Current price: ~$1.0145
🟢 Key support: $0.9957
🟢 Major lower support: $0.8434
Bullish scenario:
A strong daily close above the descending trendline and $1.0440 could open the way toward $1.0733 and potentially higher levels.
Bearish scenario:
If $SUI loses $0.9957 with a confirmed daily close below support, the triangle could break downward, with $0.8434 becoming an important lower support area.
For now, $0.9957–$1.0440 is the key battle zone. I would wait for confirmation rather than treating an intraday wick as a confirmed breakout/breakdown.
Technical analysis only — not financial advice. DYOR.
#SUİ #crypto #SUIAnalysis
$SUI is currently trading around $1.0145 and is sitting at a critical decision zone on the daily timeframe.
The overall structure of $SUI is forming a Descending Triangle, with a clear descending resistance trendline from the ~$2.00 area and horizontal support around $0.995–$1.00.
Key Levels:
🔴 Resistance: $1.0337–$1.0440
🔴 Major resistance: $1.0733
🟡 Current price: ~$1.0145
🟢 Key support: $0.9957
🟢 Major lower support: $0.8434
Bullish scenario:
A strong daily close above the descending trendline and $1.0440 could open the way toward $1.0733 and potentially higher levels.
Bearish scenario:
If $SUI loses $0.9957 with a confirmed daily close below support, the triangle could break downward, with $0.8434 becoming an important lower support area.
For now, $0.9957–$1.0440 is the key battle zone. I would wait for confirmation rather than treating an intraday wick as a confirmed breakout/breakdown.
Technical analysis only — not financial advice. DYOR.
#SUİ #crypto #SUIAnalysis
128
·
--
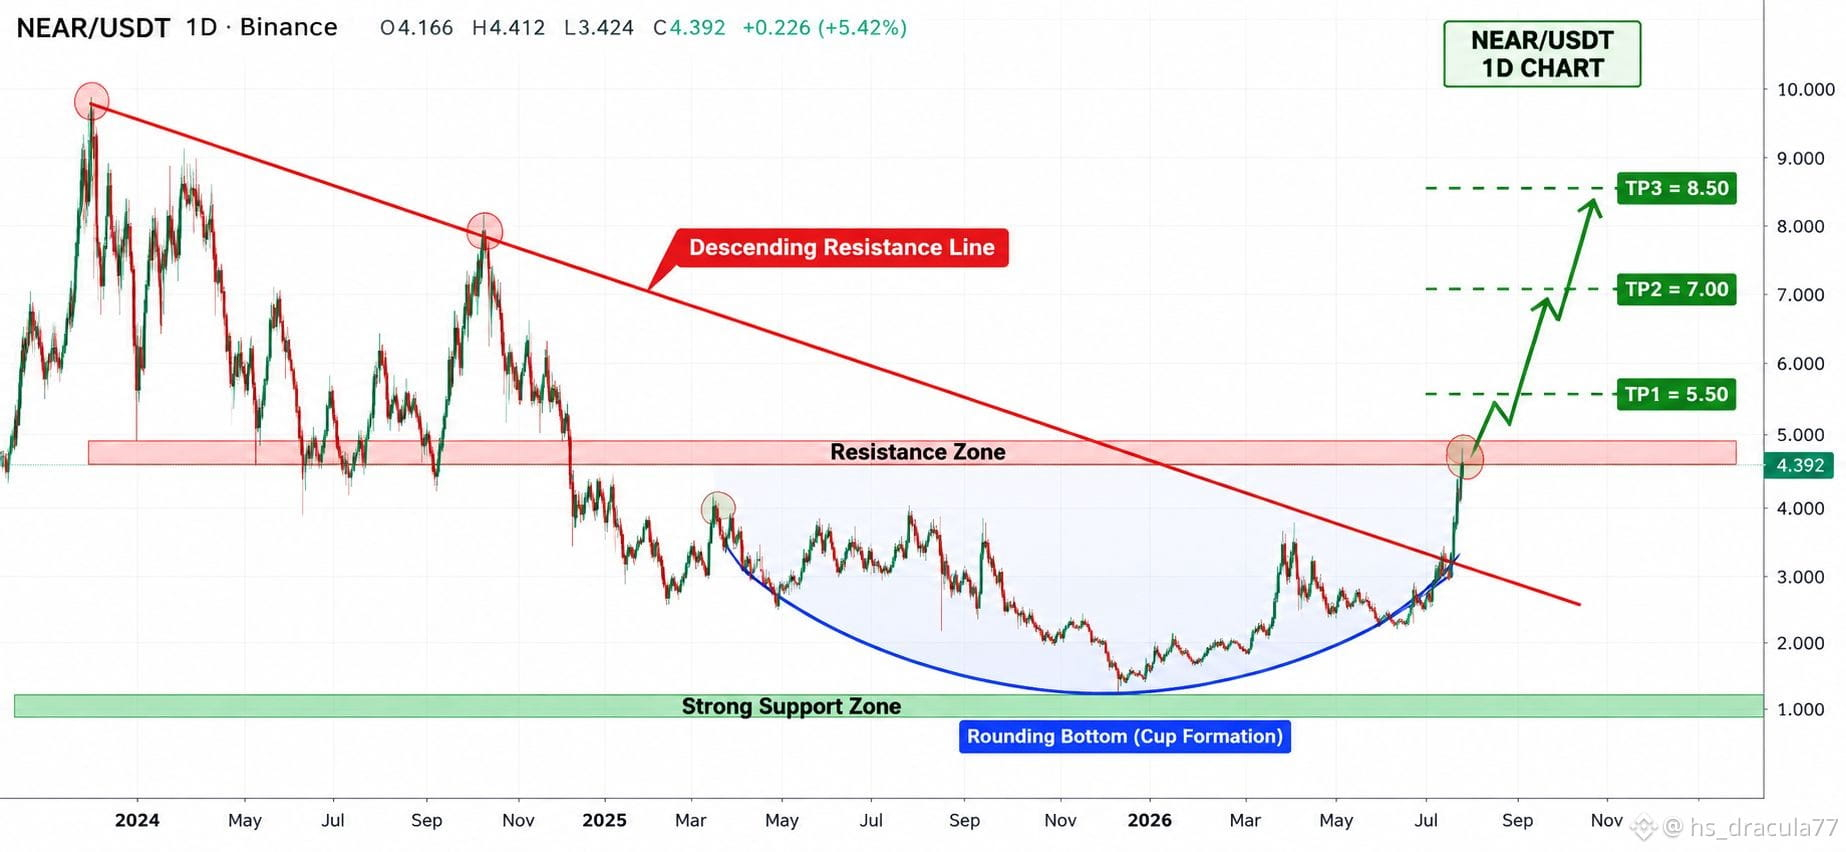
📊 NEAR/USDT — 1D Technical Analysis
$NEAR is showing a strong bullish reversal structure on the 1D chart.
After a long period of lower highs and lower prices, $NEAR has broken above its long-term descending resistance line with strong momentum. The chart also resembles a large rounding-bottom / Cup-type formation, suggesting a potential transition from accumulation into an expansion phase.
Key levels to watch:
Current price: ~$4.39
Resistance zone: $4.60–$5.00
Breakout confirmation: Daily close above $5.00 + successful retest
Support: $3.20–$3.50
Major support: $1.00–$1.30
Upside levels: $5.50 → $7.00 → $8.50
The $4.60–$5.00 area is the critical zone. A clean breakout and hold above it could open the way toward the higher levels, while rejection could lead to a pullback toward the $3.20–$3.50 support area.
Binance Square caption:
🚀 $NEAR 1D BREAKOUT SETUP
NEAR is showing a major bullish reversal structure on the 1D timeframe.
After months of consolidation, price has broken above a long-term descending resistance trendline and is now approaching the major $4.60–$5.00 resistance zone.
📌 Key levels: Support: $3.20–$3.50
Resistance: $4.60–$5.00
Target 1: $5.50
Target 2: $7.00
Target 3: $8.50
The key confirmation will be a daily close above $5.00 followed by a successful retest.
If $5.00 becomes support, the next upside expansion could become significant. If price gets rejected, watch $3.20–$3.50 for a potential retest.
Technical analysis only — DYOR.
#NEAR🚀🚀🚀 #NEARUSDT.P #NEARProtocol #CryptoWatchMay2024 #CryptoTrading
📊 NEAR/USDT — 1D Technical Analysis
$NEAR is showing a strong bullish reversal structure on the 1D chart.
After a long period of lower highs and lower prices, $NEAR has broken above its long-term descending resistance line with strong momentum. The chart also resembles a large rounding-bottom / Cup-type formation, suggesting a potential transition from accumulation into an expansion phase.
Key levels to watch:
Current price: ~$4.39
Resistance zone: $4.60–$5.00
Breakout confirmation: Daily close above $5.00 + successful retest
Support: $3.20–$3.50
Major support: $1.00–$1.30
Upside levels: $5.50 → $7.00 → $8.50
The $4.60–$5.00 area is the critical zone. A clean breakout and hold above it could open the way toward the higher levels, while rejection could lead to a pullback toward the $3.20–$3.50 support area.
Binance Square caption:
🚀 $NEAR 1D BREAKOUT SETUP
NEAR is showing a major bullish reversal structure on the 1D timeframe.
After months of consolidation, price has broken above a long-term descending resistance trendline and is now approaching the major $4.60–$5.00 resistance zone.
📌 Key levels: Support: $3.20–$3.50
Resistance: $4.60–$5.00
Target 1: $5.50
Target 2: $7.00
Target 3: $8.50
The key confirmation will be a daily close above $5.00 followed by a successful retest.
If $5.00 becomes support, the next upside expansion could become significant. If price gets rejected, watch $3.20–$3.50 for a potential retest.
Technical analysis only — DYOR.
#NEAR🚀🚀🚀 #NEARUSDT.P #NEARProtocol #CryptoWatchMay2024 #CryptoTrading
$NEAR is showing a strong bullish reversal structure on the 1D chart.
After a long period of lower highs and lower prices, $NEAR has broken above its long-term descending resistance line with strong momentum. The chart also resembles a large rounding-bottom / Cup-type formation, suggesting a potential transition from accumulation into an expansion phase.
Key levels to watch:
Current price: ~$4.39
Resistance zone: $4.60–$5.00
Breakout confirmation: Daily close above $5.00 + successful retest
Support: $3.20–$3.50
Major support: $1.00–$1.30
Upside levels: $5.50 → $7.00 → $8.50
The $4.60–$5.00 area is the critical zone. A clean breakout and hold above it could open the way toward the higher levels, while rejection could lead to a pullback toward the $3.20–$3.50 support area.
Binance Square caption:
🚀 $NEAR 1D BREAKOUT SETUP
NEAR is showing a major bullish reversal structure on the 1D timeframe.
After months of consolidation, price has broken above a long-term descending resistance trendline and is now approaching the major $4.60–$5.00 resistance zone.
📌 Key levels: Support: $3.20–$3.50
Resistance: $4.60–$5.00
Target 1: $5.50
Target 2: $7.00
Target 3: $8.50
The key confirmation will be a daily close above $5.00 followed by a successful retest.
If $5.00 becomes support, the next upside expansion could become significant. If price gets rejected, watch $3.20–$3.50 for a potential retest.
Technical analysis only — DYOR.
#NEAR🚀🚀🚀 #NEARUSDT.P #NEARProtocol #CryptoWatchMay2024 #CryptoTrading
1.4k
·
--
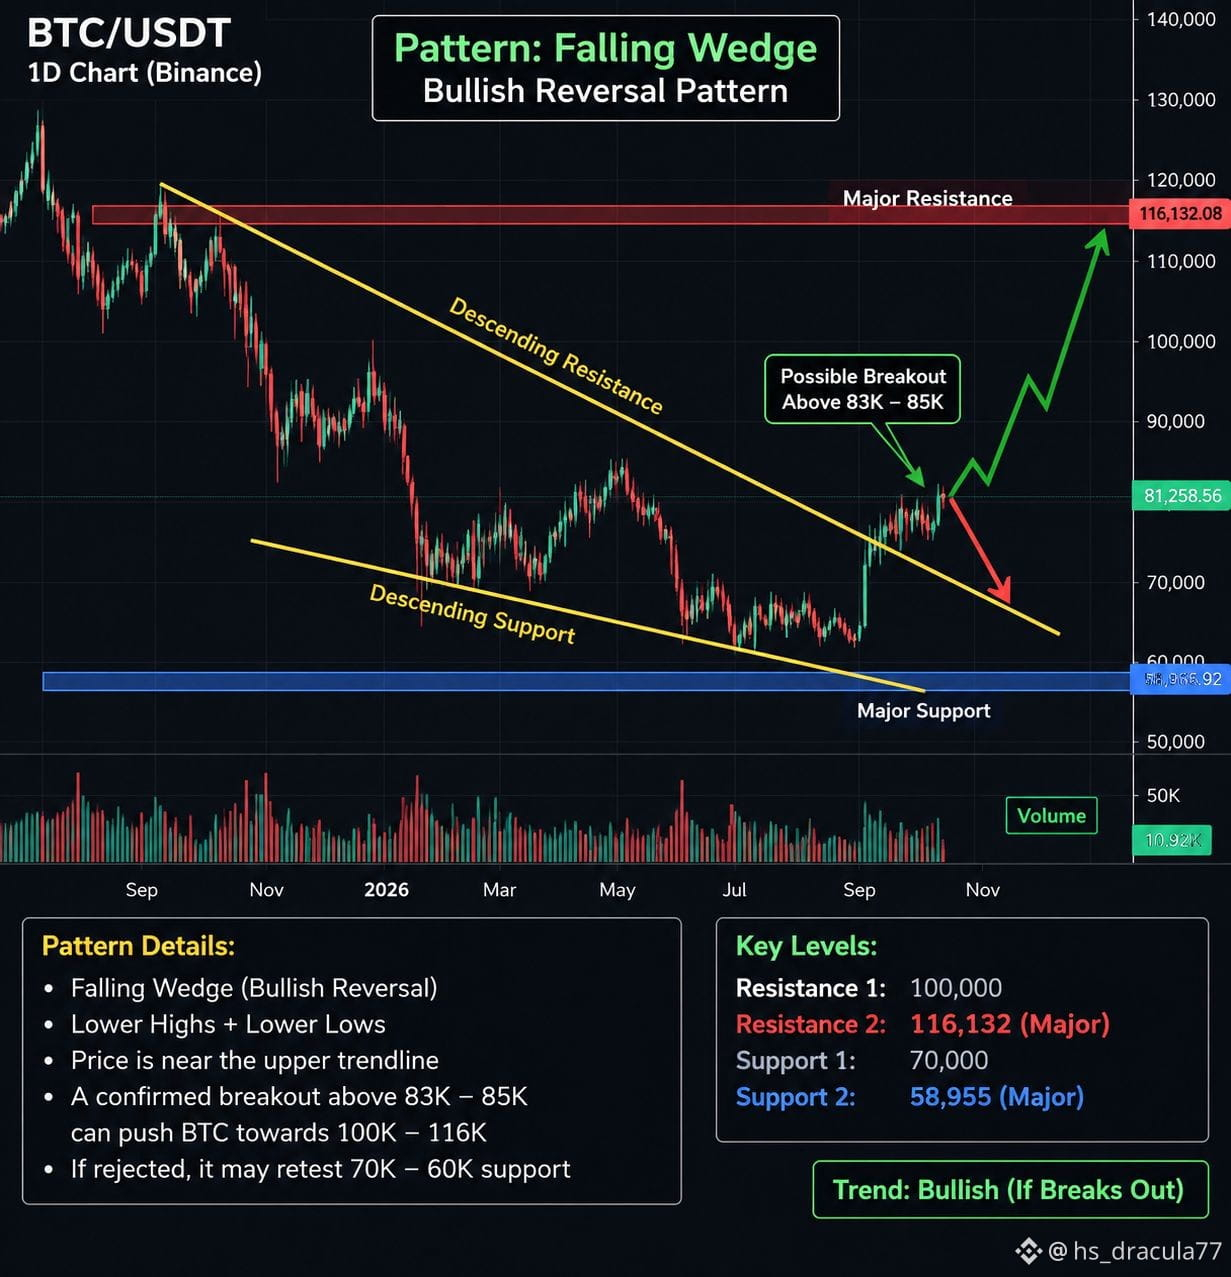
📊 $BTC/USDT — 1D Chart Analysis
$BTC is currently trading around $81,258 and the 1D chart is showing a falling-wedge type structure after the larger decline.
The key area to watch is $83K–$85K. A daily close and confirmation above this zone would indicate a breakout from the upper trendline and could open the way toward $90K → $100K.
$BTC On the downside, rejection around $83K–$85K could bring a retest of $70K, while the major long-term support shown on the chart is around $58,955.
Key levels:
🟢 Current: $81,258
🔥 Breakout zone: $83K–$85K
🎯 Resistance: $90K → $100K
🔴 Major resistance: $116,132
🟡 Support: $70K
🔵 Major support: $58,955
Important: The falling-wedge interpretation is only confirmed if $BTC breaks and holds above the upper trendline; otherwise, the structure can still produce another rejection.
#BTCUSDT #Binance #TechnicalAnalysis #cryptotrading #BitcoinAnalysis
📊 $BTC /USDT — 1D Chart Analysis
$BTC is currently trading around $81,258 and the 1D chart is showing a falling-wedge type structure after the larger decline.
The key area to watch is $83K–$85K. A daily close and confirmation above this zone would indicate a breakout from the upper trendline and could open the way toward $90K → $100K.
$BTC On the downside, rejection around $83K–$85K could bring a retest of $70K, while the major long-term support shown on the chart is around $58,955.
Key levels:
🟢 Current: $81,258
🔥 Breakout zone: $83K–$85K
🎯 Resistance: $90K → $100K
🔴 Major resistance: $116,132
🟡 Support: $70K
🔵 Major support: $58,955
Important: The falling-wedge interpretation is only confirmed if $BTC breaks and holds above the upper trendline; otherwise, the structure can still produce another rejection.
#BTCUSDT #Binance #TechnicalAnalysis #cryptotrading #BitcoinAnalysis
$BTC is currently trading around $81,258 and the 1D chart is showing a falling-wedge type structure after the larger decline.
The key area to watch is $83K–$85K. A daily close and confirmation above this zone would indicate a breakout from the upper trendline and could open the way toward $90K → $100K.
$BTC On the downside, rejection around $83K–$85K could bring a retest of $70K, while the major long-term support shown on the chart is around $58,955.
Key levels:
🟢 Current: $81,258
🔥 Breakout zone: $83K–$85K
🎯 Resistance: $90K → $100K
🔴 Major resistance: $116,132
🟡 Support: $70K
🔵 Major support: $58,955
Important: The falling-wedge interpretation is only confirmed if $BTC breaks and holds above the upper trendline; otherwise, the structure can still produce another rejection.
#BTCUSDT #Binance #TechnicalAnalysis #cryptotrading #BitcoinAnalysis
18
·
--
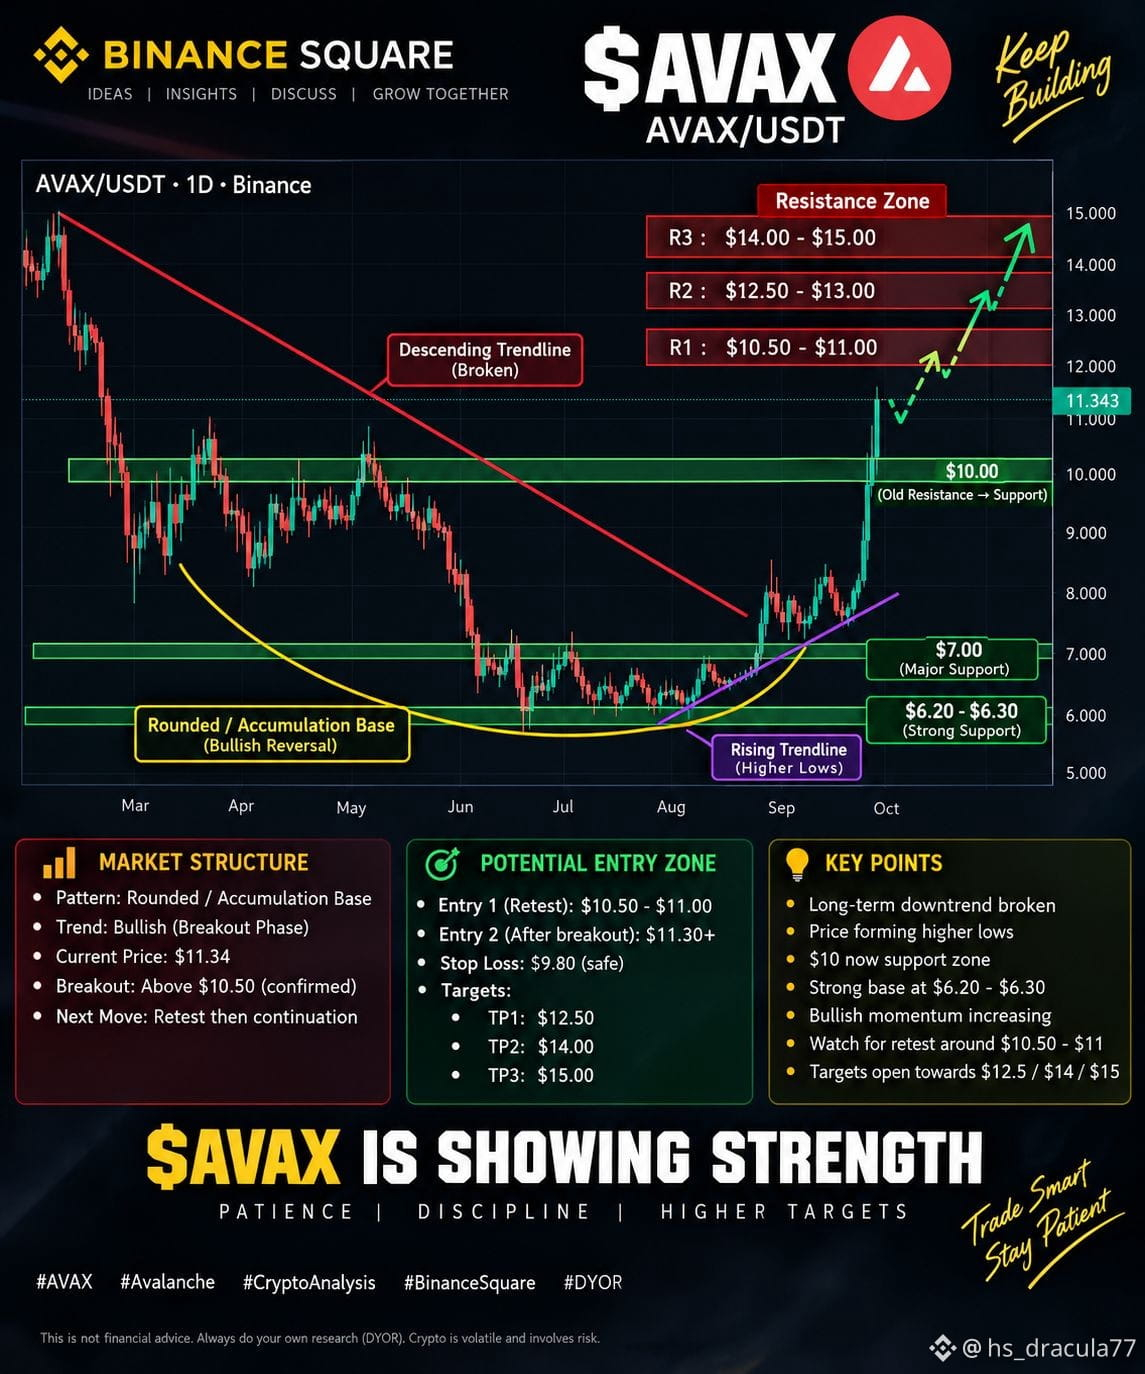
🚨 $AVAX — MAJOR BREAKOUT SETUP IS ACTIVE 🚨 AVAX is finally showing a strong breakout structure on the 1D timeframe.
After months of accumulation, price has broken above the major descending trendline and pushed through the $10 resistance area.
📊 Key Levels to Watch:
🟢 $10.00 → Previous resistance, now important support
🟢 $7.00 → Major support
🟢 $6.20–$6.30 → Strong accumulation/base zone
🔴 $10.50–$11.00 → First major resistance / retest zone
🎯 $12.50–$13.00 → Next resistance area
🎯 $14.00–$15.00 → Higher resistance zone
📈 Pattern
The 1D chart is showing a Rounded Accumulation Base + Breakout structure, with higher lows developing from the summer bottom.
The most important thing now is how $AVAX reacts around $10.50–$11.00.
If this area holds as support after a retest, the next upside levels to watch are:
➡️ $12.50
➡️ $13.00
➡️ $14.00
➡️ $15.00
But if price loses the $10 zone after the breakout, the breakout structure would need to be reassessed.
My key area right now: $10–$11 🔥
No FOMO. Let the retest confirm the move.
Trade with a plan and manage your risk.
What do you think — can $AVAX reach $15? 👀
#AVAX #Avalanche #Crypto #CryptoAnalysis #BinanceSquare #Altcoins #Trading #CryptoTrading #DYOR
🚨 $AVAX — MAJOR BREAKOUT SETUP IS ACTIVE 🚨 AVAX is finally showing a strong breakout structure on the 1D timeframe.
After months of accumulation, price has broken above the major descending trendline and pushed through the $10 resistance area.
📊 Key Levels to Watch:
🟢 $10.00 → Previous resistance, now important support
🟢 $7.00 → Major support
🟢 $6.20–$6.30 → Strong accumulation/base zone
🔴 $10.50–$11.00 → First major resistance / retest zone
🎯 $12.50–$13.00 → Next resistance area
🎯 $14.00–$15.00 → Higher resistance zone
📈 Pattern
The 1D chart is showing a Rounded Accumulation Base + Breakout structure, with higher lows developing from the summer bottom.
The most important thing now is how $AVAX reacts around $10.50–$11.00.
If this area holds as support after a retest, the next upside levels to watch are:
➡️ $12.50
➡️ $13.00
➡️ $14.00
➡️ $15.00
But if price loses the $10 zone after the breakout, the breakout structure would need to be reassessed.
My key area right now: $10–$11 🔥
No FOMO. Let the retest confirm the move.
Trade with a plan and manage your risk.
What do you think — can $AVAX reach $15? 👀
#AVAX #Avalanche #Crypto #CryptoAnalysis #BinanceSquare #Altcoins #Trading #CryptoTrading #DYOR
After months of accumulation, price has broken above the major descending trendline and pushed through the $10 resistance area.
📊 Key Levels to Watch:
🟢 $10.00 → Previous resistance, now important support
🟢 $7.00 → Major support
🟢 $6.20–$6.30 → Strong accumulation/base zone
🔴 $10.50–$11.00 → First major resistance / retest zone
🎯 $12.50–$13.00 → Next resistance area
🎯 $14.00–$15.00 → Higher resistance zone
📈 Pattern
The 1D chart is showing a Rounded Accumulation Base + Breakout structure, with higher lows developing from the summer bottom.
The most important thing now is how $AVAX reacts around $10.50–$11.00.
If this area holds as support after a retest, the next upside levels to watch are:
➡️ $12.50
➡️ $13.00
➡️ $14.00
➡️ $15.00
But if price loses the $10 zone after the breakout, the breakout structure would need to be reassessed.
My key area right now: $10–$11 🔥
No FOMO. Let the retest confirm the move.
Trade with a plan and manage your risk.
What do you think — can $AVAX reach $15? 👀
#AVAX #Avalanche #Crypto #CryptoAnalysis #BinanceSquare #Altcoins #Trading #CryptoTrading #DYOR
1
4
2.9k
·
--
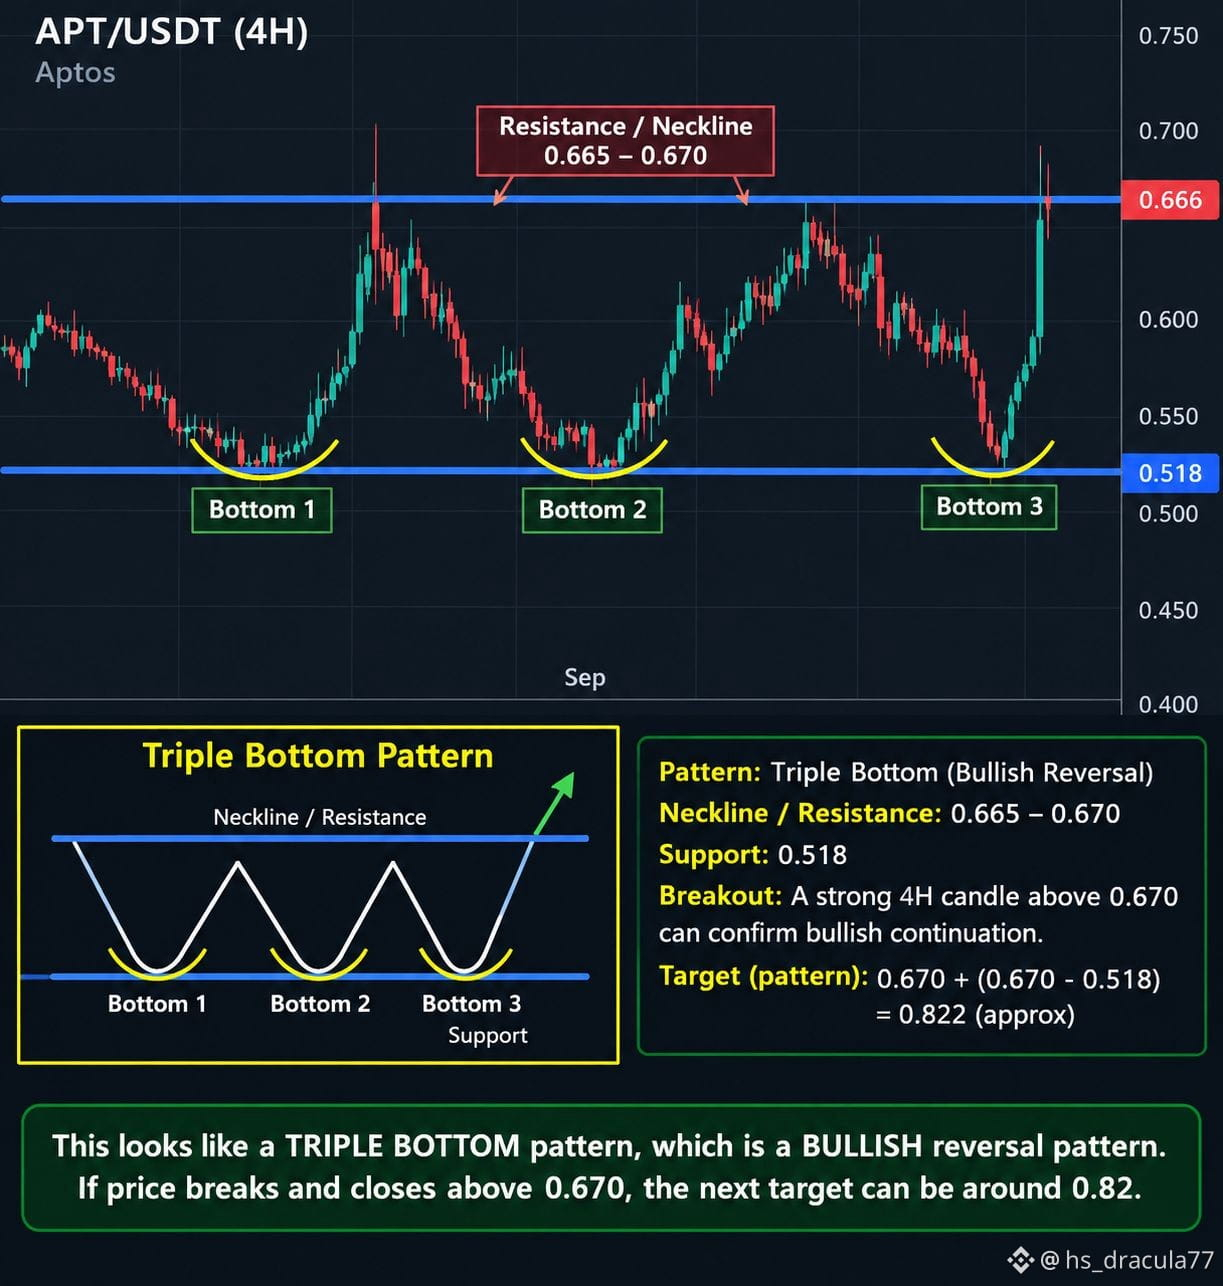
📊 APT/USDT 4H — Triple Bottom Setup
$APT is showing a potential Triple Bottom pattern on the 4H chart.
🔹 Major Support: $0.518
🔹 Neckline / Resistance: $0.665–$0.670
🔹 Current Price: around $0.666
The price has tested the $0.518 area three times and each time buyers stepped in, creating a potential Triple Bottom reversal structure.
Now the key level to watch is $0.665–$0.670.
Bullish scenario:
A strong 4H candle close above $0.670, followed by a successful retest, could confirm the breakout. The measured pattern target comes near $0.82.
Possible levels to watch:
🟢 Breakout: $0.670+
🟢 Retest zone: $0.650–$0.670
🎯 Pattern target: ~$0.82
🔴 Important support: $0.518
If $0.670 continues to reject price, APT could remain range-bound until buyers provide enough momentum for a confirmed breakout.
Key level: $0.670 — watch the 4H close, not just the wick.
$APT $APT #Aptos #APTUSDT #Crypto #BinanceSquare #CryptoAnalysis #TechnicalAnalysis #Altcoins
Not financial advice. Levels are based on the chart structure shown and can change with market conditions.
📊 APT/USDT 4H — Triple Bottom Setup
$APT is showing a potential Triple Bottom pattern on the 4H chart.
🔹 Major Support: $0.518
🔹 Neckline / Resistance: $0.665–$0.670
🔹 Current Price: around $0.666
The price has tested the $0.518 area three times and each time buyers stepped in, creating a potential Triple Bottom reversal structure.
Now the key level to watch is $0.665–$0.670.
Bullish scenario:
A strong 4H candle close above $0.670, followed by a successful retest, could confirm the breakout. The measured pattern target comes near $0.82.
Possible levels to watch:
🟢 Breakout: $0.670+
🟢 Retest zone: $0.650–$0.670
🎯 Pattern target: ~$0.82
🔴 Important support: $0.518
If $0.670 continues to reject price, APT could remain range-bound until buyers provide enough momentum for a confirmed breakout.
Key level: $0.670 — watch the 4H close, not just the wick.
$APT $APT #Aptos #APTUSDT #Crypto #BinanceSquare #CryptoAnalysis #TechnicalAnalysis #Altcoins
Not financial advice. Levels are based on the chart structure shown and can change with market conditions.
$APT is showing a potential Triple Bottom pattern on the 4H chart.
🔹 Major Support: $0.518
🔹 Neckline / Resistance: $0.665–$0.670
🔹 Current Price: around $0.666
The price has tested the $0.518 area three times and each time buyers stepped in, creating a potential Triple Bottom reversal structure.
Now the key level to watch is $0.665–$0.670.
Bullish scenario:
A strong 4H candle close above $0.670, followed by a successful retest, could confirm the breakout. The measured pattern target comes near $0.82.
Possible levels to watch:
🟢 Breakout: $0.670+
🟢 Retest zone: $0.650–$0.670
🎯 Pattern target: ~$0.82
🔴 Important support: $0.518
If $0.670 continues to reject price, APT could remain range-bound until buyers provide enough momentum for a confirmed breakout.
Key level: $0.670 — watch the 4H close, not just the wick.
$APT $APT #Aptos #APTUSDT #Crypto #BinanceSquare #CryptoAnalysis #TechnicalAnalysis #Altcoins
Not financial advice. Levels are based on the chart structure shown and can change with market conditions.
1
1.4k
·
--
Breakout Strength: $SOMI
{spot}(SOMIUSDT)
has broken above the $1.00 psychological level, confirming bullish sentiment. A +35% move in 24 hours with strong trading volume suggests real momentum rather than a weak pump.
Support Zone (Entry): The 0.97–1.00 range is a critical retest zone. If buyers hold this area, it acts as a springboard for another upward push.
Target Levels: Next resistance lies around 1.02–1.05. Breaking above 1.05 could open the door toward 1.10 or higher, depending on market sentiment.
Stop-Loss Zone: Below 0.945 structure breaks down, signaling bulls lost control. That’s a logical invalidation point.
Momentum: RSI and volume likely remain elevated after such a move — great for breakout trades but also warning of possible exhaustion.
In short: Bias is bullish above 0.97–1.00, but risk management is crucial since vertical rallies often retrace quickly.
Clean Chart (support, resistance, entry, TP, SL levels marked).
Here’s the first chart 📈 showing the SOMI/USDT trade setup:
✅ Green Zone = Ideal Entry (0.97–1.00)
🟣 Dashed Line = Target (1.05)
🔴 Dashed Line = Stop-Loss (0.945)
🟠 Resistance = 1.02
⚪ Support = 0.95
Breakout Strength: $SOMI
has broken above the $1.00 psychological level, confirming bullish sentiment. A +35% move in 24 hours with strong trading volume suggests real momentum rather than a weak pump.
Support Zone (Entry): The 0.97–1.00 range is a critical retest zone. If buyers hold this area, it acts as a springboard for another upward push.
Target Levels: Next resistance lies around 1.02–1.05. Breaking above 1.05 could open the door toward 1.10 or higher, depending on market sentiment.
Stop-Loss Zone: Below 0.945 structure breaks down, signaling bulls lost control. That’s a logical invalidation point.
Momentum: RSI and volume likely remain elevated after such a move — great for breakout trades but also warning of possible exhaustion.
In short: Bias is bullish above 0.97–1.00, but risk management is crucial since vertical rallies often retrace quickly.
Clean Chart (support, resistance, entry, TP, SL levels marked).
Here’s the first chart 📈 showing the SOMI/USDT trade setup:
✅ Green Zone = Ideal Entry (0.97–1.00)
🟣 Dashed Line = Target (1.05)
🔴 Dashed Line = Stop-Loss (0.945)
🟠 Resistance = 1.02
⚪ Support = 0.95
has broken above the $1.00 psychological level, confirming bullish sentiment. A +35% move in 24 hours with strong trading volume suggests real momentum rather than a weak pump.
Support Zone (Entry): The 0.97–1.00 range is a critical retest zone. If buyers hold this area, it acts as a springboard for another upward push.
Target Levels: Next resistance lies around 1.02–1.05. Breaking above 1.05 could open the door toward 1.10 or higher, depending on market sentiment.
Stop-Loss Zone: Below 0.945 structure breaks down, signaling bulls lost control. That’s a logical invalidation point.
Momentum: RSI and volume likely remain elevated after such a move — great for breakout trades but also warning of possible exhaustion.
In short: Bias is bullish above 0.97–1.00, but risk management is crucial since vertical rallies often retrace quickly.
Clean Chart (support, resistance, entry, TP, SL levels marked).
Here’s the first chart 📈 showing the SOMI/USDT trade setup:
✅ Green Zone = Ideal Entry (0.97–1.00)
🟣 Dashed Line = Target (1.05)
🔴 Dashed Line = Stop-Loss (0.945)
🟠 Resistance = 1.02
⚪ Support = 0.95
8
249
·
--
The increasing adoption of BTC as a settlement layer means that rather than being used for every small transaction, BTC is increasingly relied upon to record final, high-value, irreversible settlements. This shifts everyday payments to Layer-2s (like Lightning Network) or sidechains, while BTC Layer-1 serves as the ultimate arbiter of truth. However, this model creates a tradeoff BTC block space is limited to ~7 transactions per second, so as more demand concentrates on settlement, fees rise and small-value on-chain transactions may get priced out.
To address throughput without compromising $BTC decentralization, scaling improvements are being explored:
Layer-2 protocols like the Lightning Network allow instant, low-fee payments secured by $BTC BTC without congesting the base layer.
Batching & Coin Join
{spot}(BTCUSDT)
{future}(BTCUSDT)
techniques help aggregate multiple $BTC transactions into fewer block entries, improving efficiency.
$SegWit (2017) and Taproot (2021) already optimized transaction weight and script flexibility, paving the way for more complex but efficient multi-party settlements.
Future concepts like rollups, drive chains, or sidechains are under discussion to extend BTC utility while anchoring back to Layer-1 for security.
The challenge remains: increasing throughput without increasing block size too much, since larger blocks could centralize BTC by making it harder for individuals to run nodes. Thus, most scaling efforts keep BTC Layer-1 lean and conservative, while pushing innovation to off-chain or Layer-2 systems.
The increasing adoption of BTC as a settlement layer means that rather than being used for every small transaction, BTC is increasingly relied upon to record final, high-value, irreversible settlements. This shifts everyday payments to Layer-2s (like Lightning Network) or sidechains, while BTC Layer-1 serves as the ultimate arbiter of truth. However, this model creates a tradeoff BTC block space is limited to ~7 transactions per second, so as more demand concentrates on settlement, fees rise and small-value on-chain transactions may get priced out.
To address throughput without compromising $BTC decentralization, scaling improvements are being explored:
Layer-2 protocols like the Lightning Network allow instant, low-fee payments secured by $BTC BTC without congesting the base layer.
Batching & Coin Join
techniques help aggregate multiple $BTC transactions into fewer block entries, improving efficiency.
$SegWit (2017) and Taproot (2021) already optimized transaction weight and script flexibility, paving the way for more complex but efficient multi-party settlements.
Future concepts like rollups, drive chains, or sidechains are under discussion to extend BTC utility while anchoring back to Layer-1 for security.
The challenge remains: increasing throughput without increasing block size too much, since larger blocks could centralize BTC by making it harder for individuals to run nodes. Thus, most scaling efforts keep BTC Layer-1 lean and conservative, while pushing innovation to off-chain or Layer-2 systems.
To address throughput without compromising $BTC decentralization, scaling improvements are being explored:
Layer-2 protocols like the Lightning Network allow instant, low-fee payments secured by $BTC BTC without congesting the base layer.
Batching & Coin Join
techniques help aggregate multiple $BTC transactions into fewer block entries, improving efficiency.
$SegWit (2017) and Taproot (2021) already optimized transaction weight and script flexibility, paving the way for more complex but efficient multi-party settlements.
Future concepts like rollups, drive chains, or sidechains are under discussion to extend BTC utility while anchoring back to Layer-1 for security.
The challenge remains: increasing throughput without increasing block size too much, since larger blocks could centralize BTC by making it harder for individuals to run nodes. Thus, most scaling efforts keep BTC Layer-1 lean and conservative, while pushing innovation to off-chain or Layer-2 systems.
7
200
Log in to explore more content
Join global crypto users on Binance Square
⚡️ Get latest and useful information about crypto.
💬 Trusted by the world’s largest crypto exchange.
👍 Discover real insights from verified creators.
Email / Phone number
Trending Topics
BinanceProcesses$4.65BWithdrawals
43,097 views
173 Discussing
Binance Processes $4.65 Billion in Withdrawals After Reopening, Net Outflow of $3.64 Billion Equals 2.1% of Its $171 Billion in Assets
Binance News
·52 Likes
·17k views
WithdrawalsBack: 15 networks live
9,889 views
146 Discussing
SouthKoreanLawmakerProposesReviewOfAllListedDigitalAssets
27 views
4 Discussing