
倉鼠-crypto
68 Posts

倉鼠-crypto
5 Following
2 Followers
2 Liked
Posts
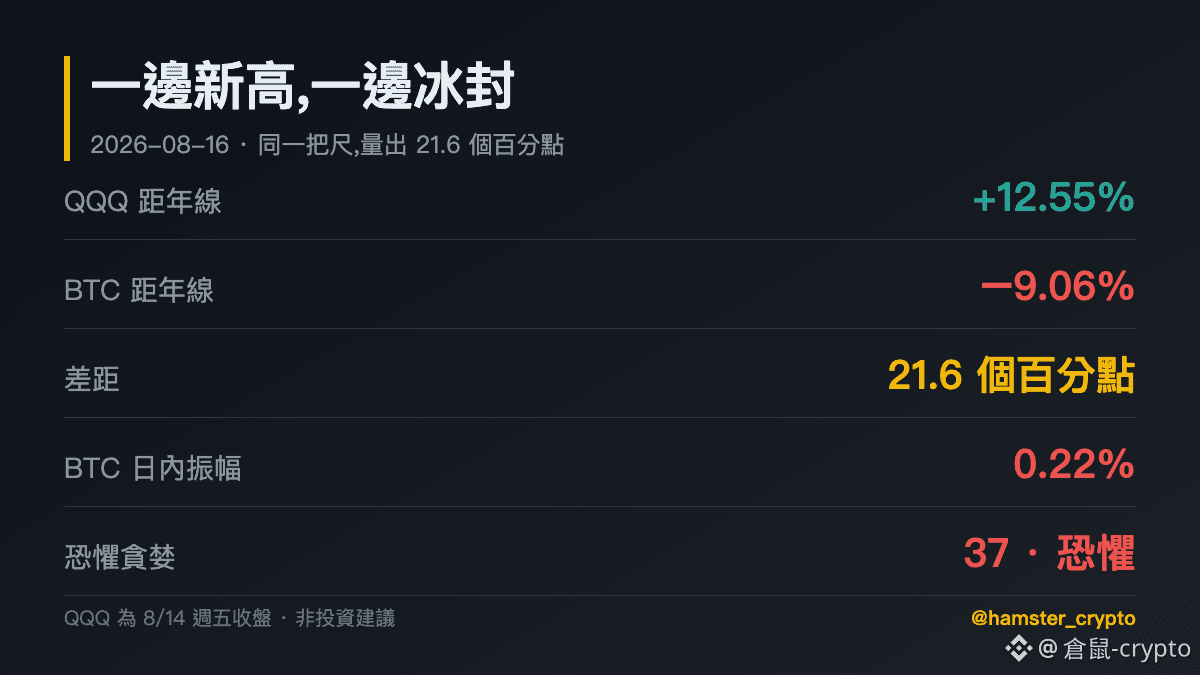
US stocks hit new highs, and the crypto market is almost out of breath—how wide is this gap now?
Using the same ruler: $QQQ is 12.55% above its 200-day moving average, while $BTC is 9.06% below its own 200-day moving average. That’s a spread of 21.6 percentage points.
At the same time, on this side $ETH : for $BTC , yesterday’s intraday range was 0.43%, today so far 0.22%, and the Fear & Greed Index is 37.
📌 From the same global pool of capital—one side is making new highs, while the other can’t even be bothered to move in sync
📌 QQQ is the 8/14 Friday close (US stock market is closed over the weekend), while crypto prices are real-time, so the timing between the two isn’t aligned
📌 I’m not predicting which direction this gap will close—I’m just measuring how wide it is first
Do you think US stocks are anticipating something, or that the crypto market is waiting for something?
⚠️ Structural interpretation only, not investment advice; all price levels are programmatically calculated.
#标普500财报超预期 #BTC #ETH #QQQ #加密货币
Using the same ruler: $QQQ is 12.55% above its 200-day moving average, while $BTC is 9.06% below its own 200-day moving average. That’s a spread of 21.6 percentage points.
At the same time, on this side $ETH : for $BTC , yesterday’s intraday range was 0.43%, today so far 0.22%, and the Fear & Greed Index is 37.
📌 From the same global pool of capital—one side is making new highs, while the other can’t even be bothered to move in sync
📌 QQQ is the 8/14 Friday close (US stock market is closed over the weekend), while crypto prices are real-time, so the timing between the two isn’t aligned
📌 I’m not predicting which direction this gap will close—I’m just measuring how wide it is first
Do you think US stocks are anticipating something, or that the crypto market is waiting for something?
⚠️ Structural interpretation only, not investment advice; all price levels are programmatically calculated.
#标普500财报超预期 #BTC #ETH #QQQ #加密货币
Today Bitcoin’s intraday amplitude is 0.43% — high 63,188, low 62,920, and the whole day only moved $268.
Looking back at the previous seven days: 0.63%, 1.15%, 2.48%, 2.02%, 1.88%, 1.92%, 1.73%. Today is roughly one quarter of this week’s average, and it’s the narrowest one in eight days.
I’m not predicting what will happen next—I’m only describing what’s happening now: the market today is almost not moving.
📌 On days like this, two things are most likely to happen—someone is bored and keeps adding to positions, and someone simply closes the App. Boredom itself is a test, and many people lose because of this, not because of a crash.
On a day with a 0.4% range, did you do anything today? Leave a comment and let’s chat.$BTC $ETH
⚠️ Observational sharing only, not investment advice.
#BTC #加密貨幣 #Market Analysis
Looking back at the previous seven days: 0.63%, 1.15%, 2.48%, 2.02%, 1.88%, 1.92%, 1.73%. Today is roughly one quarter of this week’s average, and it’s the narrowest one in eight days.
I’m not predicting what will happen next—I’m only describing what’s happening now: the market today is almost not moving.
📌 On days like this, two things are most likely to happen—someone is bored and keeps adding to positions, and someone simply closes the App. Boredom itself is a test, and many people lose because of this, not because of a crash.
On a day with a 0.4% range, did you do anything today? Leave a comment and let’s chat.$BTC $ETH
⚠️ Observational sharing only, not investment advice.
#BTC #加密貨幣 #Market Analysis
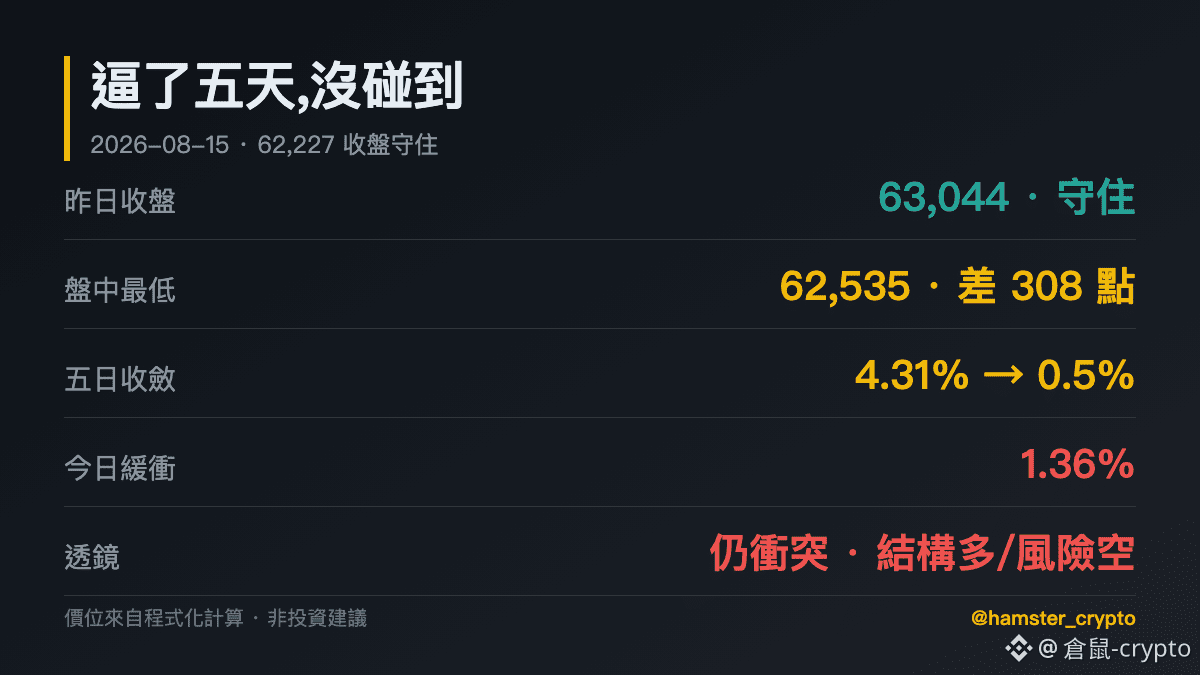
The answer for five days is out: hold on.
I started tracking the distance from Bitcoin to the invalidation level of 62,227 on August 10 — 4.3%, 2.9%, 2.29%, 2.07%. Yesterday, the intraday low was 62,535, only 308 points away. Then it closed at 63,044, trading above that level.
But I’m not going to say “support is valid.” Because that line wasn’t really tested from start to finish — at the closest moment, it still was 308 points away. A line that hasn’t been touched has an unknown strength; it hasn’t been verified.
📌 Today the buffer is back to 1.36%, still thin — this isn’t over
📌 That contradiction is still there too: the structure is somewhat bullish, risk appetite is bearish — the two perspectives are still fighting
📌 $ETH has made some progress: the structure changed from “downtrend” back to “range”
Approaching the five-day level but not being touched — do you think it’s strong, or is it just not its turn yet? Leave a comment and let’s chat.$BTC $BNB
⚠️ Personal market-structure interpretation, not investment advice.
#BTC #ETH #以太坊 #加密貨幣 #Market analysis
I started tracking the distance from Bitcoin to the invalidation level of 62,227 on August 10 — 4.3%, 2.9%, 2.29%, 2.07%. Yesterday, the intraday low was 62,535, only 308 points away. Then it closed at 63,044, trading above that level.
But I’m not going to say “support is valid.” Because that line wasn’t really tested from start to finish — at the closest moment, it still was 308 points away. A line that hasn’t been touched has an unknown strength; it hasn’t been verified.
📌 Today the buffer is back to 1.36%, still thin — this isn’t over
📌 That contradiction is still there too: the structure is somewhat bullish, risk appetite is bearish — the two perspectives are still fighting
📌 $ETH has made some progress: the structure changed from “downtrend” back to “range”
Approaching the five-day level but not being touched — do you think it’s strong, or is it just not its turn yet? Leave a comment and let’s chat.$BTC $BNB
⚠️ Personal market-structure interpretation, not investment advice.
#BTC #ETH #以太坊 #加密貨幣 #Market analysis
A number that’s very easy to misread—I almost wrote it wrong myself too.
I wrote about August 8th and August 4th: the distance between Bitcoin and its 200-day moving average has been shrinking, from -10.7% to -7.8%. It sounds like price is getting closer to the upside.
But if you break it down on both sides, it’s not quite like that—
July 29: price 64,343, moving average 71,903
Today: price 63,484, moving average 69,670
The price is actually falling, down 1.3%. The distance shrinks because the moving average itself dropped 3.1%—the threshold comes down to meet the price, not the price rising to meet the threshold.
📌 “Getting closer and closer to the yearly line” sounds like good news, but first ask one question: is it the price going up, or is the threshold coming down?
When you look at the deviation rate, do you split both sides to calculate? Leave a comment and let’s discuss.$BTC $ETH
⚠️ Sharing observations, not investment advice.
#BTC #加密貨幣 #行情分析
I wrote about August 8th and August 4th: the distance between Bitcoin and its 200-day moving average has been shrinking, from -10.7% to -7.8%. It sounds like price is getting closer to the upside.
But if you break it down on both sides, it’s not quite like that—
July 29: price 64,343, moving average 71,903
Today: price 63,484, moving average 69,670
The price is actually falling, down 1.3%. The distance shrinks because the moving average itself dropped 3.1%—the threshold comes down to meet the price, not the price rising to meet the threshold.
📌 “Getting closer and closer to the yearly line” sounds like good news, but first ask one question: is it the price going up, or is the threshold coming down?
When you look at the deviation rate, do you split both sides to calculate? Leave a comment and let’s discuss.$BTC $ETH
⚠️ Sharing observations, not investment advice.
#BTC #加密貨幣 #行情分析
Ethereum made a decision that looks like surrender, but is actually very mature.
They spent eight years and poured eight-figure dollars into developing a hashing algorithm specifically designed for zero-knowledge proofs. Yesterday, the Foundation announced: give it up, and switch to SHA and BLAKE—old standards that have been used worldwide for decades.
The reason isn’t that the work failed; it’s that the proof technology itself has advanced, and the older algorithms are now fast enough too. The researchers’ exact words were very precise: the key isn’t “a proof-friendly hash,” but “a hash-friendly proof.”
📌 This is exactly two sides of the same coin as the Coldcard incident I wrote about on August 1—back then, it was a problem with their custom random number generator, and 594 bitcoins were stolen.
You tell me: if eight years of results can be discarded like that, do you think it’s a waste, or a reasonable judgment? Comment and let’s discuss.$ETH $BTC
⚠️ Observational sharing only, not investment advice.
#以太坊基金会L1弃用Poseidon哈希 #ETH #BTC #Cryptocurrency
They spent eight years and poured eight-figure dollars into developing a hashing algorithm specifically designed for zero-knowledge proofs. Yesterday, the Foundation announced: give it up, and switch to SHA and BLAKE—old standards that have been used worldwide for decades.
The reason isn’t that the work failed; it’s that the proof technology itself has advanced, and the older algorithms are now fast enough too. The researchers’ exact words were very precise: the key isn’t “a proof-friendly hash,” but “a hash-friendly proof.”
📌 This is exactly two sides of the same coin as the Coldcard incident I wrote about on August 1—back then, it was a problem with their custom random number generator, and 594 bitcoins were stolen.
You tell me: if eight years of results can be discarded like that, do you think it’s a waste, or a reasonable judgment? Comment and let’s discuss.$ETH $BTC
⚠️ Observational sharing only, not investment advice.
#以太坊基金会L1弃用Poseidon哈希 #ETH #BTC #Cryptocurrency
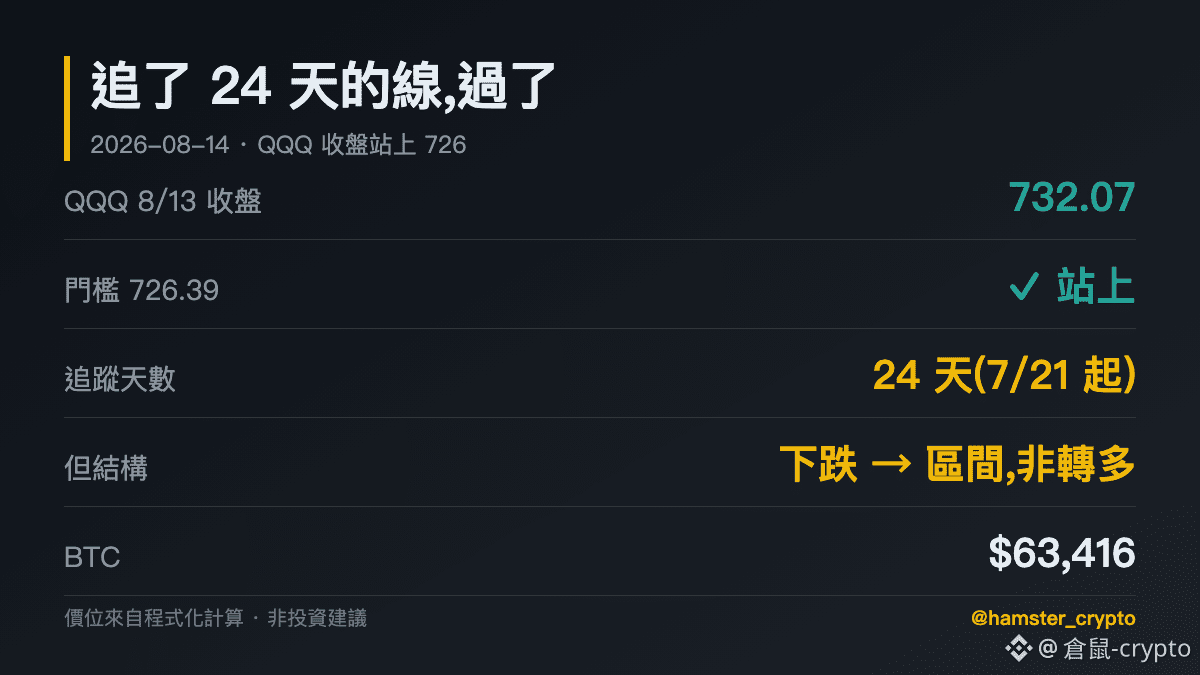
I started following that line on July 21, and yesterday it finally passed.
$QQQ 8 On August 13’s close, it reached 732 and broke above the 726 threshold. I’ve posted about this line nine times in total—at one point it was short by 0.01 USD and didn’t get through, then got pushed back to 717, and last week it came close twice.
But I don’t plan to frame it as “technology stocks turning bullish.” The program only changed the structure from “downtrend” to “range.” The four observation angles are still all neutral. Breaking through a threshold and establishing the direction are two different things.
📌 The significance of breaking above 726 is: the multi-week downtrend structure is解除, not that the uptrend structure has been established
📌 Crypto has completely failed to follow:$BTC 63,488 and $ETH 1,886—both are still stuck in place grinding
The line I followed for 24 days finally passed. Do you think it’s time to chase it, or should we wait to see whether it can hold? See you in the comments.
⚠️ Structural interpretation only—no investment advice. Prices are derived from programmatic calculations.
#QQQ #BTC #ETH #加密貨幣 #科技股
$QQQ 8 On August 13’s close, it reached 732 and broke above the 726 threshold. I’ve posted about this line nine times in total—at one point it was short by 0.01 USD and didn’t get through, then got pushed back to 717, and last week it came close twice.
But I don’t plan to frame it as “technology stocks turning bullish.” The program only changed the structure from “downtrend” to “range.” The four observation angles are still all neutral. Breaking through a threshold and establishing the direction are two different things.
📌 The significance of breaking above 726 is: the multi-week downtrend structure is解除, not that the uptrend structure has been established
📌 Crypto has completely failed to follow:$BTC 63,488 and $ETH 1,886—both are still stuck in place grinding
The line I followed for 24 days finally passed. Do you think it’s time to chase it, or should we wait to see whether it can hold? See you in the comments.
⚠️ Structural interpretation only—no investment advice. Prices are derived from programmatic calculations.
#QQQ #BTC #ETH #加密貨幣 #科技股
A number you can clearly see a shift in emotions.
At the end of July, I wrote about this: over the past half year, during about one third of the time, the majority wasn’t “paying” — they were “receiving” instead, because nobody really wanted to go long.
Today, when you zoom in on the time window — over six months, this ratio is 28.4%, but in the most recent 30 days it has dropped to just 7.8%, and in the last 10 days it’s even only 6.7%.
In other words, the willingness to go long has clearly come back.
📌 The cost has risen too: the six-month average annualized rate is 3.6%, and in the last 30 days it’s 7.1% — about double
📌 When sentiment warms up and costs rise, it’s usually two sides of the same coin; it won’t happen in only one direction
The bullish willingness is back, but the price to pay is also higher. Do you think this is good news? Comment and let’s chat.$BTC $ETH
⚠️ Sharing observations, not investment advice.
#BTC #加密貨幣 #market analysis
At the end of July, I wrote about this: over the past half year, during about one third of the time, the majority wasn’t “paying” — they were “receiving” instead, because nobody really wanted to go long.
Today, when you zoom in on the time window — over six months, this ratio is 28.4%, but in the most recent 30 days it has dropped to just 7.8%, and in the last 10 days it’s even only 6.7%.
In other words, the willingness to go long has clearly come back.
📌 The cost has risen too: the six-month average annualized rate is 3.6%, and in the last 30 days it’s 7.1% — about double
📌 When sentiment warms up and costs rise, it’s usually two sides of the same coin; it won’t happen in only one direction
The bullish willingness is back, but the price to pay is also higher. Do you think this is good news? Comment and let’s chat.$BTC $ETH
⚠️ Sharing observations, not investment advice.
#BTC #加密貨幣 #market analysis
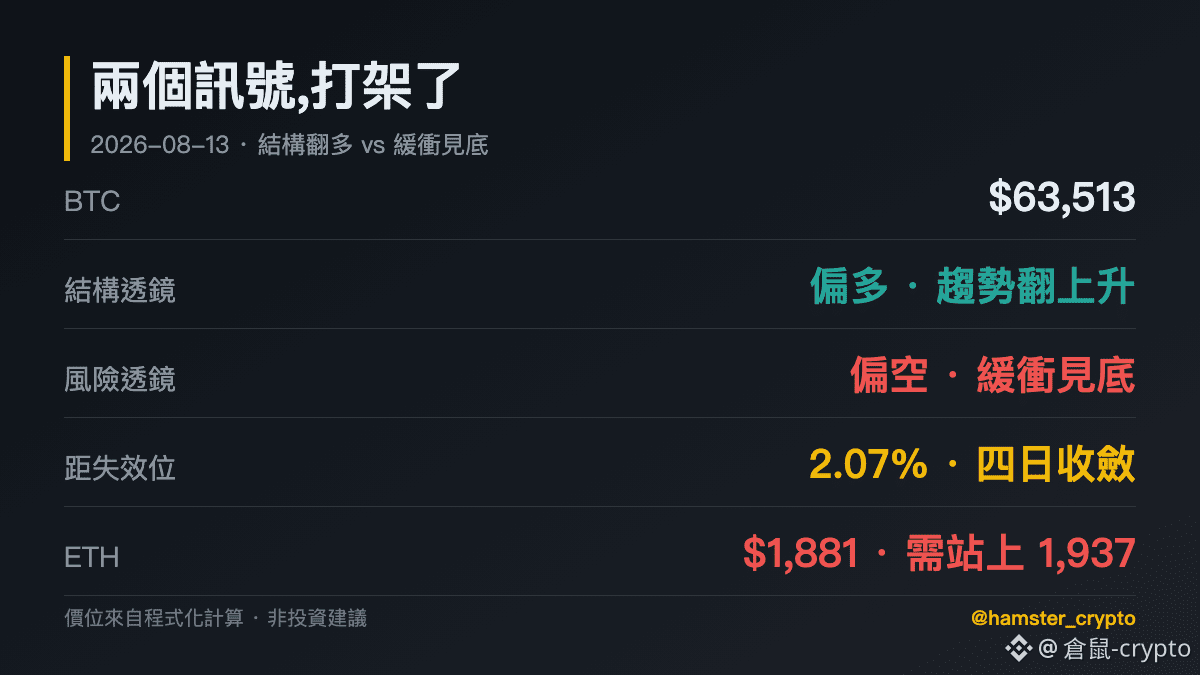
My four observation angles—today is the first time I’ve fought on Bitcoin.
The program changed the BTC trend from “range” to “uptrend,” and from the structure perspective it turned bullish. But in the same set of data, the risk perspective is bearish—because the current price is only 2.07% away from the invalidation level of 62,227.
Four days ago, that distance was still 4.3%, then 2.9%, 2.29%, and today it’s 2.07%. The price hardly moved, yet the downside space has kept getting eaten up.
📌 Structure flips bullish, and the buffer is running out—both things are true at the same time. I’m not going to pick whichever feels better to talk about—the disagreement itself is today’s message.
📌 A close below 62,227 invalidates the structure that just flipped bullish; only if it holds do we get to discuss direction.
📌 $ETH is still below the 1,937 threshold—structurally, it’s still bearish.
When the signals contradict each other, do you choose one to trust, or do you just stay put? Let’s chat in the comments.$BTC $BNB
⚠️ Personal structural interpretation, not investment advice.
#BTC #ETH #以太坊 #加密貨幣 #Market Analysis
The program changed the BTC trend from “range” to “uptrend,” and from the structure perspective it turned bullish. But in the same set of data, the risk perspective is bearish—because the current price is only 2.07% away from the invalidation level of 62,227.
Four days ago, that distance was still 4.3%, then 2.9%, 2.29%, and today it’s 2.07%. The price hardly moved, yet the downside space has kept getting eaten up.
📌 Structure flips bullish, and the buffer is running out—both things are true at the same time. I’m not going to pick whichever feels better to talk about—the disagreement itself is today’s message.
📌 A close below 62,227 invalidates the structure that just flipped bullish; only if it holds do we get to discuss direction.
📌 $ETH is still below the 1,937 threshold—structurally, it’s still bearish.
When the signals contradict each other, do you choose one to trust, or do you just stay put? Let’s chat in the comments.$BTC $BNB
⚠️ Personal structural interpretation, not investment advice.
#BTC #ETH #以太坊 #加密貨幣 #Market Analysis
A number that few people calculate: the “carrying cost” of a Binance BTC/USDT perpetual contract long position—and it itself fluctuates significantly.
Looking back at the six months of data I kept, the funding rate for Binance BTC perpetual contract positions ranged from a highest of 0.01%/8h to a lowest of -0.0205%/8h. Converted to annualized terms, the range is +11% to -22%.
This means that for the same long position, at some times you end up paying an annual cost of 11%, and at other times you actually receive an annual return of 22%.
Today’s present value is 2.6% annualized, which is much lower than the average of 7.1% over the past month.
📌 For people who hold longs long-term, they often only calculate price movements, forgetting that the carrying cost also fluctuates—and not by a small amount.
When you hold contracts, do you look at the funding rate, or do you only watch the price? Leave a comment and let’s chat.$BTC $ETH
⚠️ Observation and sharing only—no investment advice.
#BTC #加密貨幣 #行情分析
Looking back at the six months of data I kept, the funding rate for Binance BTC perpetual contract positions ranged from a highest of 0.01%/8h to a lowest of -0.0205%/8h. Converted to annualized terms, the range is +11% to -22%.
This means that for the same long position, at some times you end up paying an annual cost of 11%, and at other times you actually receive an annual return of 22%.
Today’s present value is 2.6% annualized, which is much lower than the average of 7.1% over the past month.
📌 For people who hold longs long-term, they often only calculate price movements, forgetting that the carrying cost also fluctuates—and not by a small amount.
When you hold contracts, do you look at the funding rate, or do you only watch the price? Leave a comment and let’s chat.$BTC $ETH
⚠️ Observation and sharing only—no investment advice.
#BTC #加密貨幣 #行情分析
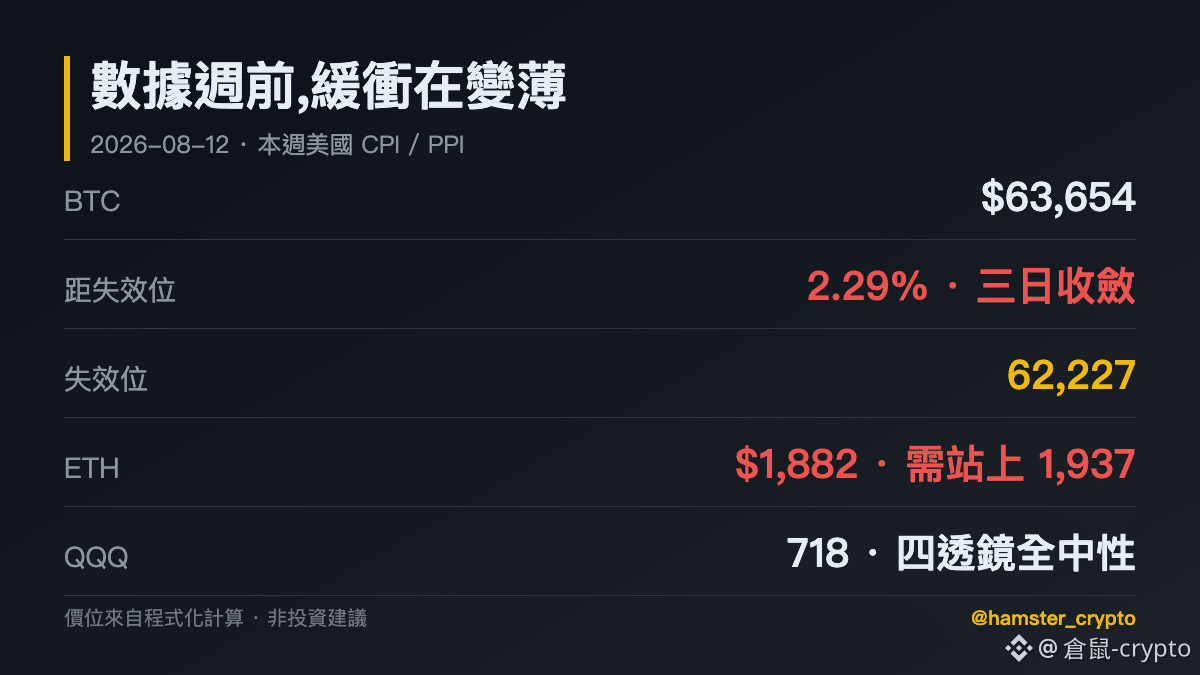
This week there are two sets of data coming out: the US July CPI and PPI, and over 70,000 people in the plaza are discussing it.
I won’t guess the numbers, but I can talk about one thing I’ve seen on my end: Bitcoin’s cushion is getting thinner.
The failure point calculated by the program has always been 62,227.$BTC —its distance: 4.3% three days ago, 2.9% yesterday, and now down to 2.29% today. Prices haven’t crashed, but they’re getting closer day by day.
📌 Before the data is released, tolerance space is worth watching more than directional judgment—because you can’t guess the direction, but you can calculate the space.
📌 $ETH is still under the 1,937 threshold, so the structure is still bearish; $QQQ 718 hits neutral across all four observation angles.
Before the data comes out, will you reduce your position a bit, or stick to the original plan? See you in the comments.
⚠️ Structural interpretation, not investment advice; the price levels come from algorithmic calculations.
#美国7月CPI与PPI数据本周出炉 #BTC #ETH #QQQ #Cryptocurrency
I won’t guess the numbers, but I can talk about one thing I’ve seen on my end: Bitcoin’s cushion is getting thinner.
The failure point calculated by the program has always been 62,227.$BTC —its distance: 4.3% three days ago, 2.9% yesterday, and now down to 2.29% today. Prices haven’t crashed, but they’re getting closer day by day.
📌 Before the data is released, tolerance space is worth watching more than directional judgment—because you can’t guess the direction, but you can calculate the space.
📌 $ETH is still under the 1,937 threshold, so the structure is still bearish; $QQQ 718 hits neutral across all four observation angles.
Before the data comes out, will you reduce your position a bit, or stick to the original plan? See you in the comments.
⚠️ Structural interpretation, not investment advice; the price levels come from algorithmic calculations.
#美国7月CPI与PPI数据本周出炉 #BTC #ETH #QQQ #Cryptocurrency
Flip through your daily savings records and you’ll come across a very interesting comparison set.
Two weeks ago on July 29, the Bitcoin four-hour short-term indicator was 94 — extremely overbought.
Today, the same indicator is 2.6 — extremely oversold.
And what about the prices on these two days? 64,343 and 64,114—only a 0.4% difference.
The indicator went from one end to the other, while the price stayed almost in place.
📌 Extreme readings refer to “where it sits relative to the recent K-bars,” not “it’s about to reverse.” If you treat it as a reversal signal, you’ll be tricked back and forth twice in these two weeks.
When the indicator calls something extreme, will you take it as a signal directly, or will you first check whether the price confirms it? Comment and let’s discuss.$BTC $ETH
⚠️ Observations and sharing only; not investment advice.
#BTC #加密貨幣 #Market Analysis
Two weeks ago on July 29, the Bitcoin four-hour short-term indicator was 94 — extremely overbought.
Today, the same indicator is 2.6 — extremely oversold.
And what about the prices on these two days? 64,343 and 64,114—only a 0.4% difference.
The indicator went from one end to the other, while the price stayed almost in place.
📌 Extreme readings refer to “where it sits relative to the recent K-bars,” not “it’s about to reverse.” If you treat it as a reversal signal, you’ll be tricked back and forth twice in these two weeks.
When the indicator calls something extreme, will you take it as a signal directly, or will you first check whether the price confirms it? Comment and let’s discuss.$BTC $ETH
⚠️ Observations and sharing only; not investment advice.
#BTC #加密貨幣 #Market Analysis
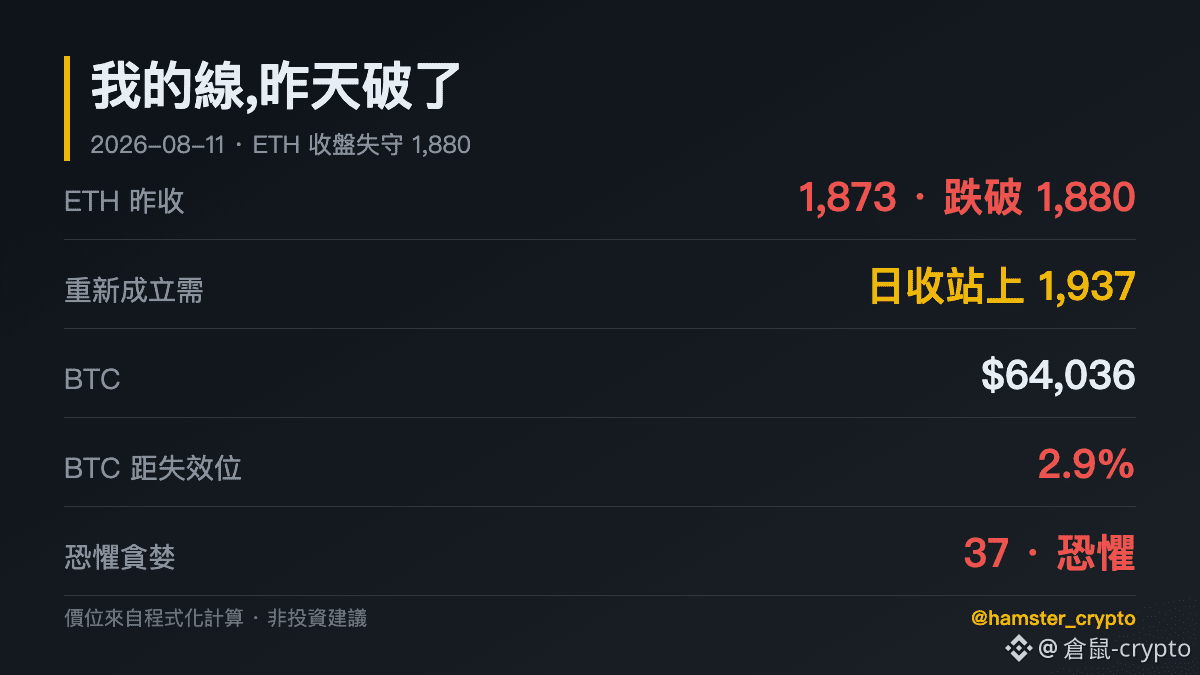
Yesterday I was saying that ETH is just 1.8% away from its invalidation level. And as it happened, by yesterday’s close—1,873—that 1,880 level was broken.
According to my own rules, this repair move is over here. The program also changed ETH’s structure from “range” to “downtrend.” The original buy zone disappears—so if you want to talk about a long setup again, you’ll have to wait for the daily close to stand above 1,937.
Bitcoin wasn’t looking great either: intraday high 65,391, then it kept getting sold all the way down to 63,806, and it closed at 63,970. Compared to my invalidation level of 62,227, the distance shrank from 4.3% to 2.9%. Out of the four observation angles, the risk signal flipped to slightly bearish.
📌 ETH: 1,937 is the re-established threshold; before that, any bounce is only a bounce.
📌 BTC: 62,227 hasn’t been broken yet, but the cushion has gotten thinner.
I drew the lines, and one more got broken. Do you think this kind of public reconciliation has meaning, or is it better to just look at the results? Leave a comment and let’s chat.$ETH $BTC $BNB
⚠️ Personal structural interpretation only—not investment advice.
#ETH #BTC #以太坊 #加密貨幣 #Market Analysis
According to my own rules, this repair move is over here. The program also changed ETH’s structure from “range” to “downtrend.” The original buy zone disappears—so if you want to talk about a long setup again, you’ll have to wait for the daily close to stand above 1,937.
Bitcoin wasn’t looking great either: intraday high 65,391, then it kept getting sold all the way down to 63,806, and it closed at 63,970. Compared to my invalidation level of 62,227, the distance shrank from 4.3% to 2.9%. Out of the four observation angles, the risk signal flipped to slightly bearish.
📌 ETH: 1,937 is the re-established threshold; before that, any bounce is only a bounce.
📌 BTC: 62,227 hasn’t been broken yet, but the cushion has gotten thinner.
I drew the lines, and one more got broken. Do you think this kind of public reconciliation has meaning, or is it better to just look at the results? Leave a comment and let’s chat.$ETH $BTC $BNB
⚠️ Personal structural interpretation only—not investment advice.
#ETH #BTC #以太坊 #加密貨幣 #Market Analysis
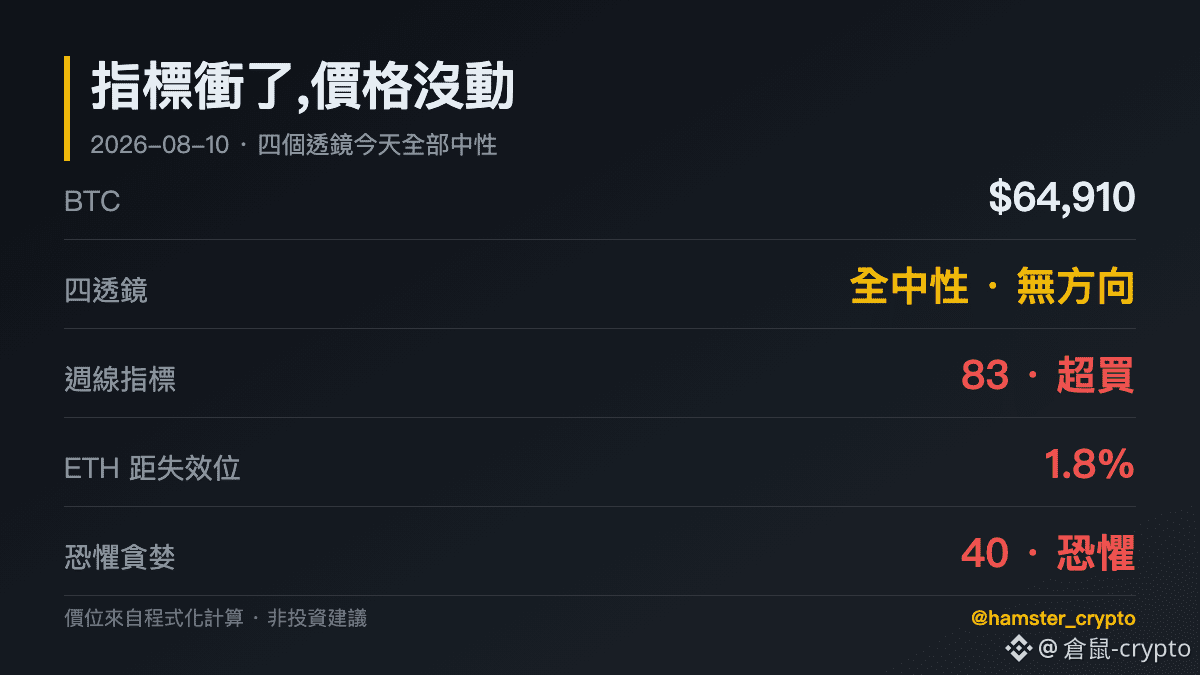
To be honest, everything I’m looking at today has no clear direction.
The four observation angles that the program calculates—structure, moving averages, volume, and risk—are all neutral today. There aren’t any bullish signals, and there aren’t any bearish ones either. $BTC 64, 964, $ETH 1, 915 are all just grinding within the range.
But there’s one number that’s interesting: that commonly used short-term indicator on the weekly chart has climbed from 38 on July 29 to 83 today—it's already entered the overbought zone. In the same period, Bitcoin moved from 64,343 to 64,964, up about 1%.
📌 The indicator surged by 45 points, but the price only moved 1%—because it measures the position “relative to where things have been over the past few weeks,” not how much the price rose
📌 BTC is still 4.3% away from the invalidation level of 62,227; ETH’s 1,880 is only 1.8% away—clearly tighter
On days with no signal, do you just wait with cash on hand, or do you force a direction? Leave a comment and let’s chat. $BNB
⚠️ Personal structural interpretation only, not investment advice.
#BTC #ETH #以太坊 #加密貨幣 #行情分析
The four observation angles that the program calculates—structure, moving averages, volume, and risk—are all neutral today. There aren’t any bullish signals, and there aren’t any bearish ones either. $BTC 64, 964, $ETH 1, 915 are all just grinding within the range.
But there’s one number that’s interesting: that commonly used short-term indicator on the weekly chart has climbed from 38 on July 29 to 83 today—it's already entered the overbought zone. In the same period, Bitcoin moved from 64,343 to 64,964, up about 1%.
📌 The indicator surged by 45 points, but the price only moved 1%—because it measures the position “relative to where things have been over the past few weeks,” not how much the price rose
📌 BTC is still 4.3% away from the invalidation level of 62,227; ETH’s 1,880 is only 1.8% away—clearly tighter
On days with no signal, do you just wait with cash on hand, or do you force a direction? Leave a comment and let’s chat. $BNB
⚠️ Personal structural interpretation only, not investment advice.
#BTC #ETH #以太坊 #加密貨幣 #行情分析
Today, the hottest thing at the Square is the BIP-110 soft fork—over 70,000 people are watching. First, the conclusion: it has actually already failed.
This proposal entered the mandatory signaling period at block 961,632, but the miner support rate is only 2.53%, which is extremely far from the required 55% to activate. It only leaves behind a short-lived minority chain.
However, there’s something worth noting: it doesn’t have built-in replay protection. The developers’ advice is simple—during the split, the safest approach is “don’t move your coins.”
📌 Risky: people who self-custody and who run specific clients
📌 Fine: people whose coins are in an exchange or an ETF—they’re not affected
Where are your coins held right now? This time, exchange users are actually a bit easier. Leave a comment and let’s chat. $BTC
⚠️ Security reminder—no investment advice.
#BIP110软分叉尝试启动 #BTC #加密貨幣
This proposal entered the mandatory signaling period at block 961,632, but the miner support rate is only 2.53%, which is extremely far from the required 55% to activate. It only leaves behind a short-lived minority chain.
However, there’s something worth noting: it doesn’t have built-in replay protection. The developers’ advice is simple—during the split, the safest approach is “don’t move your coins.”
📌 Risky: people who self-custody and who run specific clients
📌 Fine: people whose coins are in an exchange or an ETF—they’re not affected
Where are your coins held right now? This time, exchange users are actually a bit easier. Leave a comment and let’s chat. $BTC
⚠️ Security reminder—no investment advice.
#BIP110软分叉尝试启动 #BTC #加密貨幣
The CLARITY Act for encrypted regulatory oversight, originally scheduled to be voted on before the Senate’s summer recess, didn’t make it onto the agenda and has been pushed to September. The majority leader previously said it would get a floor vote, but the nomination bill and the Russia sanctions bill are taking precedence.
First, let’s make it clear: this is a postponement, not the bill’s death. The Senate reconvenes on September 14, followed by about three weeks of session.
But time really is getting more expensive—the midterm elections are later in November, and the agenda will only become more crowded.
📌 This is only about “getting it onto the agenda for a vote”; there are still many steps before it’s fully enacted: cloture needs 60 votes, integrating with the Agriculture Committee’s version, and passage in the House and signature by the president.
📌 In the crypto space, there’s been absolutely no reaction:$BTC 64,767、$ETH 1,911, fear index 39
Institutional matters always move slower than you’d imagine. Will you treat it as something that will pass eventually, or do you think the wait will prove too long? See you in the comments. $BNB
⚠️ Information for reference only; not investment advice.
#参议院拟9月表决CLARITY法案 #BTC #ETH #加密貨幣 #Market analysis
First, let’s make it clear: this is a postponement, not the bill’s death. The Senate reconvenes on September 14, followed by about three weeks of session.
But time really is getting more expensive—the midterm elections are later in November, and the agenda will only become more crowded.
📌 This is only about “getting it onto the agenda for a vote”; there are still many steps before it’s fully enacted: cloture needs 60 votes, integrating with the Agriculture Committee’s version, and passage in the House and signature by the president.
📌 In the crypto space, there’s been absolutely no reaction:$BTC 64,767、$ETH 1,911, fear index 39
Institutional matters always move slower than you’d imagine. Will you treat it as something that will pass eventually, or do you think the wait will prove too long? See you in the comments. $BNB
⚠️ Information for reference only; not investment advice.
#参议院拟9月表决CLARITY法案 #BTC #ETH #加密貨幣 #Market analysis

Four days ago I mentioned a number: bitcoin is about 10.7% below the 200-day moving average—which means people who entered over the past half year are still, on average, at a loss.
Let’s recalculate today—now it’s down only 7.8%.
In these few days the price hasn’t really risen much, but the gap is narrowing. That’s because the moving average itself is also moving downward, bringing both sides closer together. The number of trapped holders is slightly less now, so the overhead selling pressure from those trying to break even is a bit thinner.
📌 The closer you get to the yearly moving line, the smaller the resistance you’ll face during a rebound; but when conditions truly change, you need to stand above the moving average—not just get close to it.
From a 10.7% loss to a 7.8% loss: do you feel things are improving, or do you feel it’s just falling more slowly? Leave a comment and let’s discuss.$BTC $ETH
⚠️ Observation and sharing only; not investment advice.
#BTC #加密貨幣 #Market analysis
Let’s recalculate today—now it’s down only 7.8%.
In these few days the price hasn’t really risen much, but the gap is narrowing. That’s because the moving average itself is also moving downward, bringing both sides closer together. The number of trapped holders is slightly less now, so the overhead selling pressure from those trying to break even is a bit thinner.
📌 The closer you get to the yearly moving line, the smaller the resistance you’ll face during a rebound; but when conditions truly change, you need to stand above the moving average—not just get close to it.
From a 10.7% loss to a 7.8% loss: do you feel things are improving, or do you feel it’s just falling more slowly? Leave a comment and let’s discuss.$BTC $ETH
⚠️ Observation and sharing only; not investment advice.
#BTC #加密貨幣 #Market analysis
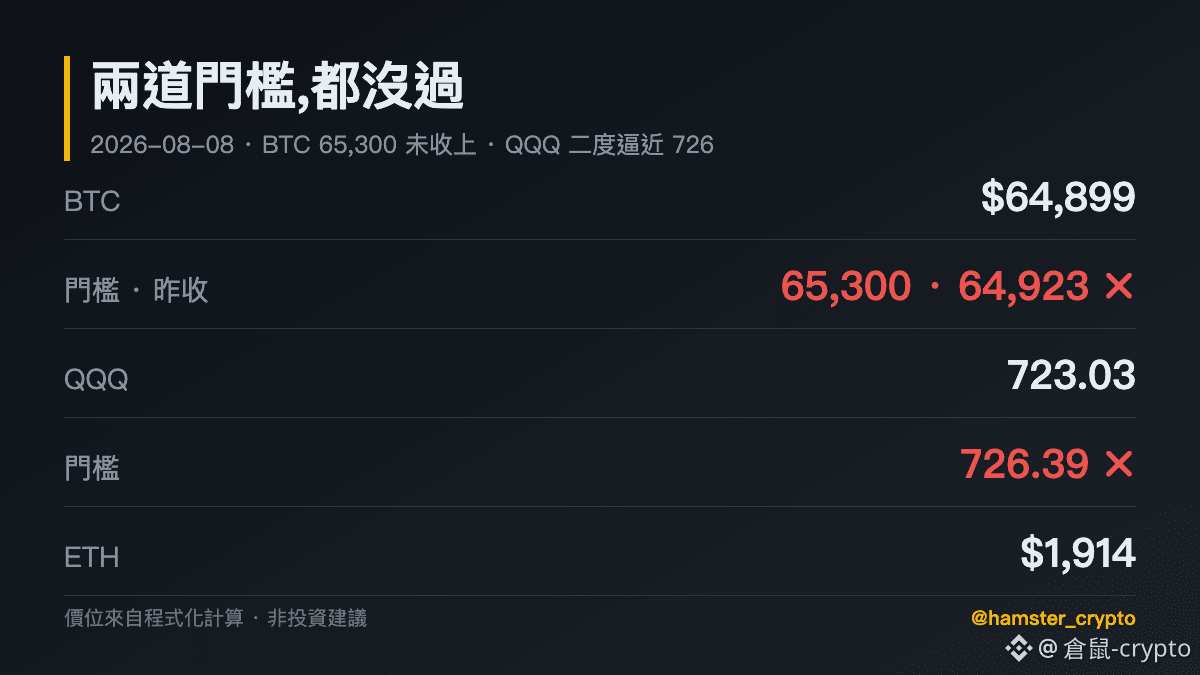
First, the result: it didn’t break above.
During yesterday’s session, Bitcoin touched 65,328 and cleared the 65,300 level I set on July 27—but it closed at 64,923, meaning it closed below the threshold. I said last night, “If it doesn’t break above, it’s another intraday fakeout,” and it really was.
What’s interesting is that tech is the same. <t-2/> $QQQ today 723, and it’s back in front of the 726 threshold—this is the second time it has approached it within three days. Last time it stalled at 726.38, just a cent short.
📌 Two markets, two thresholds—and so far, no one has truly passed them
📌 $BTC 64,900、$ETH 1,914, the crypto market has been moving sideways below the thresholds these days
📌 The Fear Index is 40—three straight weeks in the fear zone, but it’s already the high point for this period
Both sides are stuck at the doorway. Who do you think will be the first to get through? See you in the comments. $ETH
⚠️ Structural interpretation, not investment advice. Price levels come from automated calculations.
#BTC #ETH #QQQ #加密貨幣 #行情分析
During yesterday’s session, Bitcoin touched 65,328 and cleared the 65,300 level I set on July 27—but it closed at 64,923, meaning it closed below the threshold. I said last night, “If it doesn’t break above, it’s another intraday fakeout,” and it really was.
What’s interesting is that tech is the same. <t-2/> $QQQ today 723, and it’s back in front of the 726 threshold—this is the second time it has approached it within three days. Last time it stalled at 726.38, just a cent short.
📌 Two markets, two thresholds—and so far, no one has truly passed them
📌 $BTC 64,900、$ETH 1,914, the crypto market has been moving sideways below the thresholds these days
📌 The Fear Index is 40—three straight weeks in the fear zone, but it’s already the high point for this period
Both sides are stuck at the doorway. Who do you think will be the first to get through? See you in the comments. $ETH
⚠️ Structural interpretation, not investment advice. Price levels come from automated calculations.
#BTC #ETH #QQQ #加密貨幣 #行情分析
This morning I said “we’ve recovered, but we can’t move anymore,” and by night I got slapped in the face.
Bitcoin jumped from 64,166 to 65,328, and Ethereum also climbed to 1,932—both up 1.5%. And the number 65,300 is a bit meaningful: on July 27, I said that for BTC to truly take back the initiative, it needs to close back above 65,300.
Now it touched it during the trading session. Old rule: if it hasn’t closed yet, it doesn’t count.
📌 Close above 65,300 → this is the threshold I set 11 days ago. If it holds, it means this move is not just a repair
📌 If it doesn’t hold, then it’s another intraday fake-out—this month it’s already happened several times
📌 Fear index at 40, the first time in three weeks it’s returned to 40
This kind of moment—said we’re out of steam in the morning, and it’s up at night. When this happens, will you chase, or wait for the close to confirm? Comment and let’s chat.$BTC $ETH
⚠️ Personal market-structure interpretation only, not investment advice.
#BTC #ETH #cryptocurrency
Bitcoin jumped from 64,166 to 65,328, and Ethereum also climbed to 1,932—both up 1.5%. And the number 65,300 is a bit meaningful: on July 27, I said that for BTC to truly take back the initiative, it needs to close back above 65,300.
Now it touched it during the trading session. Old rule: if it hasn’t closed yet, it doesn’t count.
📌 Close above 65,300 → this is the threshold I set 11 days ago. If it holds, it means this move is not just a repair
📌 If it doesn’t hold, then it’s another intraday fake-out—this month it’s already happened several times
📌 Fear index at 40, the first time in three weeks it’s returned to 40
This kind of moment—said we’re out of steam in the morning, and it’s up at night. When this happens, will you chase, or wait for the close to confirm? Comment and let’s chat.$BTC $ETH
⚠️ Personal market-structure interpretation only, not investment advice.
#BTC #ETH #cryptocurrency
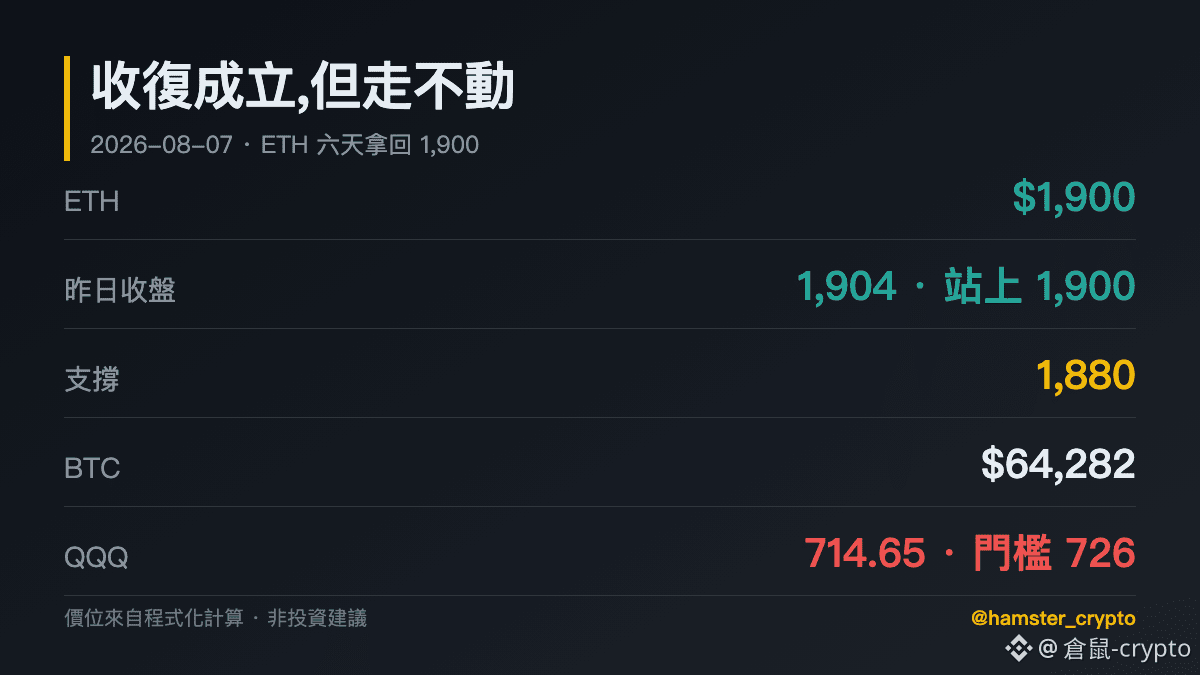
Reply again to yesterday’s question: it’s back on.
Yesterday afternoon, ETH surged to 1,912. I said intraday doesn’t count—you have to look at the close. Yesterday’s daily candle closed at 1,904. It’s now back above 1,900, so the recovery is considered valid. From the day it broke below on July 31, it took six days.
But today it hasn’t followed through. ETH is currently at 1,901, almost moving right along that line; BTC is at 64,340 as well—basically flat. Recovery is one thing; whether it can actually push upward is another.
📌 The program has moved ETH support to 1,880. If it falls back, it means this recovery is only another bounce
📌 Tech remains weak: QQQ 714, and the threshold at 726 is getting farther and farther away
📌 Fear index at 38—has stayed in the fear zone for three weeks without leaving
It’s recovered, but it can’t move—do you see it as building energy, or do you think the momentum has already run out? Leave a comment and chat. $ETH $BTC $BNB
⚠️ Personal structural interpretation, not investment advice.
#ETH #BTC #以太坊 #加密貨幣 #Market analysis
Yesterday afternoon, ETH surged to 1,912. I said intraday doesn’t count—you have to look at the close. Yesterday’s daily candle closed at 1,904. It’s now back above 1,900, so the recovery is considered valid. From the day it broke below on July 31, it took six days.
But today it hasn’t followed through. ETH is currently at 1,901, almost moving right along that line; BTC is at 64,340 as well—basically flat. Recovery is one thing; whether it can actually push upward is another.
📌 The program has moved ETH support to 1,880. If it falls back, it means this recovery is only another bounce
📌 Tech remains weak: QQQ 714, and the threshold at 726 is getting farther and farther away
📌 Fear index at 38—has stayed in the fear zone for three weeks without leaving
It’s recovered, but it can’t move—do you see it as building energy, or do you think the momentum has already run out? Leave a comment and chat. $ETH $BTC $BNB
⚠️ Personal structural interpretation, not investment advice.
#ETH #BTC #以太坊 #加密貨幣 #Market analysis
A slightly counterintuitive comparison—the numbers are what I save every day myself.
On July 29, Bitcoin was 64,343. At the time, the commonly used short-term indicators showed “oversold.” Today, August 6, Bitcoin is 64,562—almost the same price, yet the same indicator shows “overbought.”
The price difference is less than 0.3%, but the signals are completely opposite.
The reason isn’t complicated: these indicators aren’t measuring whether something is “expensive or cheap,” but whether, relative to the last few days, you’re standing near a higher point or a lower point. With the same 64,000 price, if it’s been dropping recently it looks low; if it’s been rising recently it looks high.
📌 The indicators talk about relative position, not value. Don’t treat them as proof of something being cheap or expensive—sooner or later, the same price will “trick” you twice.
Will you use this kind of short-term indicator to decide when to enter and exit, or just use it as a reference? Comment and let’s chat.$BTC $ETH
⚠️ Sharing for observation only, not investment advice.
#BTC #加密貨幣 #行情分析
On July 29, Bitcoin was 64,343. At the time, the commonly used short-term indicators showed “oversold.” Today, August 6, Bitcoin is 64,562—almost the same price, yet the same indicator shows “overbought.”
The price difference is less than 0.3%, but the signals are completely opposite.
The reason isn’t complicated: these indicators aren’t measuring whether something is “expensive or cheap,” but whether, relative to the last few days, you’re standing near a higher point or a lower point. With the same 64,000 price, if it’s been dropping recently it looks low; if it’s been rising recently it looks high.
📌 The indicators talk about relative position, not value. Don’t treat them as proof of something being cheap or expensive—sooner or later, the same price will “trick” you twice.
Will you use this kind of short-term indicator to decide when to enter and exit, or just use it as a reference? Comment and let’s chat.$BTC $ETH
⚠️ Sharing for observation only, not investment advice.
#BTC #加密貨幣 #行情分析
Log in to explore more content