
b圈菜鸟
105 Posts

b圈菜鸟
Report
Block User
Frequent Trader
3.5 Years
19 Following
283 Followers
321 Liked
Posts
All
Quotes
·
--
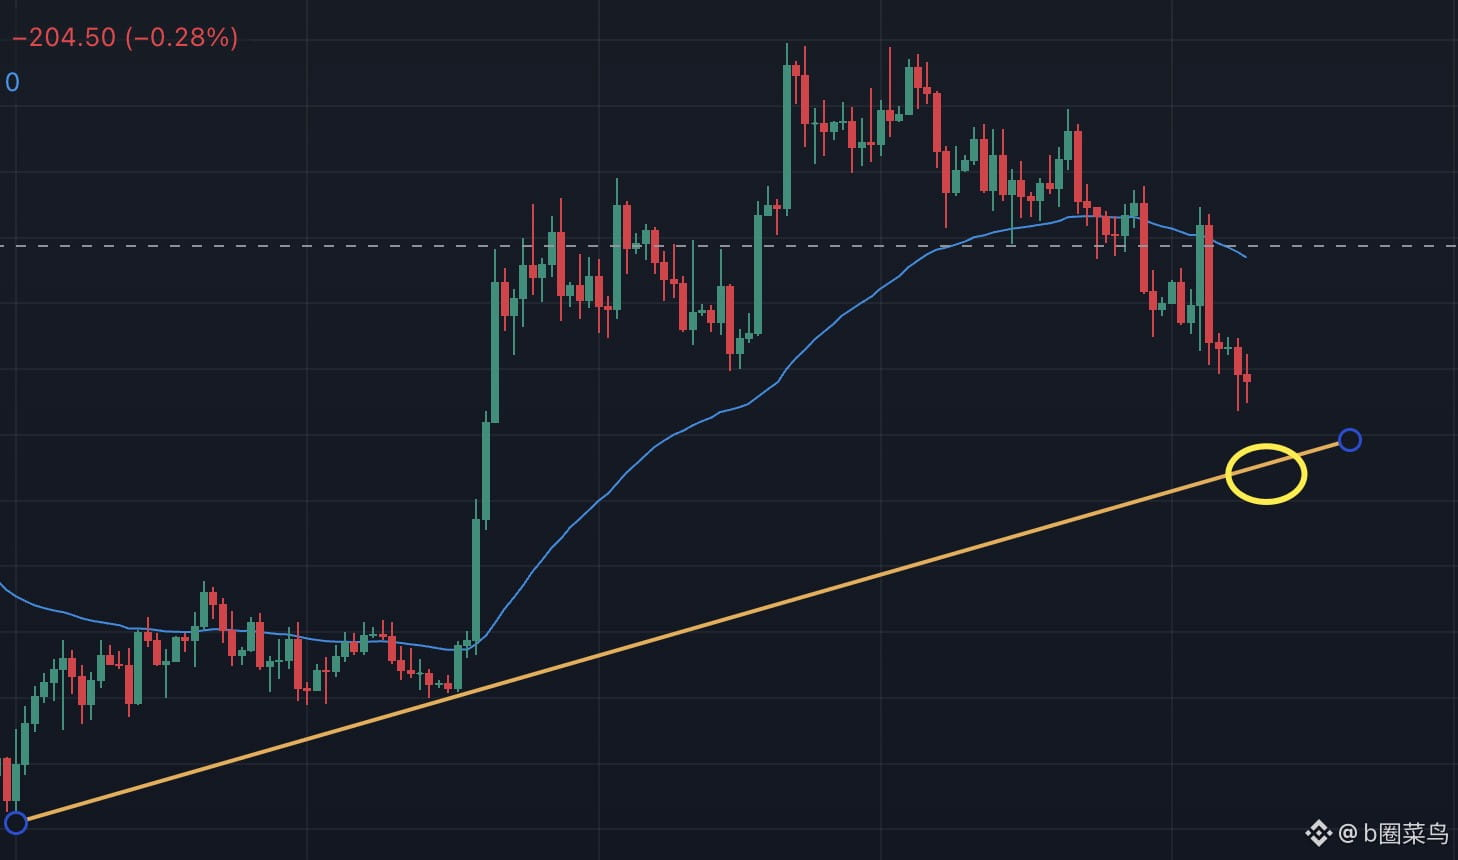
$BTC Perhaps a break below here and reclaim could be a good place to add to the position? #BTC走势分析
{future}(BTCUSDT)
$BTC Perhaps a break below here and reclaim could be a good place to add to the position? #BTC走势分析
341
·
--
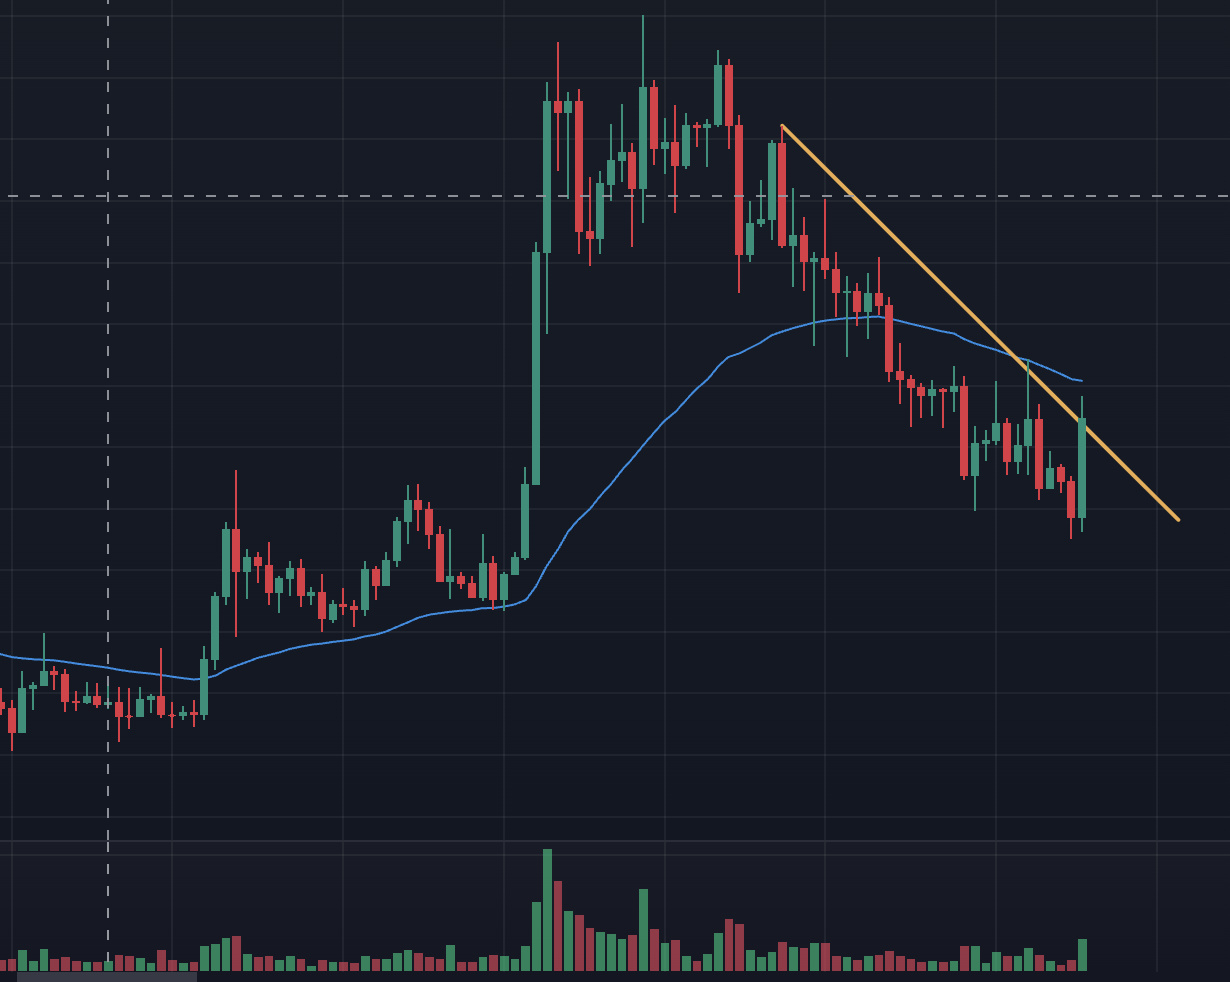
$AVAX This long bullish candlestick drove the price upward toward the descending trendline, while also bringing it close to moving-average resistance. This is a key test area for the current rebound. A single long bullish candlestick only shows that buyers have made a concentrated short-term push; it does not mean the downtrend has immediately reversed.
Whether the market can turn stronger depends above all on whether it can break above the trendline on strong volume and hold there. If the price encounters resistance here and pulls back, this rebound is merely a continuation within the downtrend, and the bears still have an opportunity to press their advantage. Only a decisive breakout and hold above resistance would indicate that the bearish structure is easing. Until a confirmed signal of holding above the trendline appears, the broader descending structure remains unchanged. Don’t rush to buy the dip just because of one bullish candlestick; wait patiently for a clear signal to avoid getting trapped by predicting a reversal too early.#AVAX
{future}(AVAXUSDT)
$AVAX This long bullish candlestick drove the price upward toward the descending trendline, while also bringing it close to moving-average resistance. This is a key test area for the current rebound. A single long bullish candlestick only shows that buyers have made a concentrated short-term push; it does not mean the downtrend has immediately reversed.
Whether the market can turn stronger depends above all on whether it can break above the trendline on strong volume and hold there. If the price encounters resistance here and pulls back, this rebound is merely a continuation within the downtrend, and the bears still have an opportunity to press their advantage. Only a decisive breakout and hold above resistance would indicate that the bearish structure is easing. Until a confirmed signal of holding above the trendline appears, the broader descending structure remains unchanged. Don’t rush to buy the dip just because of one bullish candlestick; wait patiently for a clear signal to avoid getting trapped by predicting a reversal too early.#AVAX
Whether the market can turn stronger depends above all on whether it can break above the trendline on strong volume and hold there. If the price encounters resistance here and pulls back, this rebound is merely a continuation within the downtrend, and the bears still have an opportunity to press their advantage. Only a decisive breakout and hold above resistance would indicate that the bearish structure is easing. Until a confirmed signal of holding above the trendline appears, the broader descending structure remains unchanged. Don’t rush to buy the dip just because of one bullish candlestick; wait patiently for a clear signal to avoid getting trapped by predicting a reversal too early.#AVAX
310
·
--
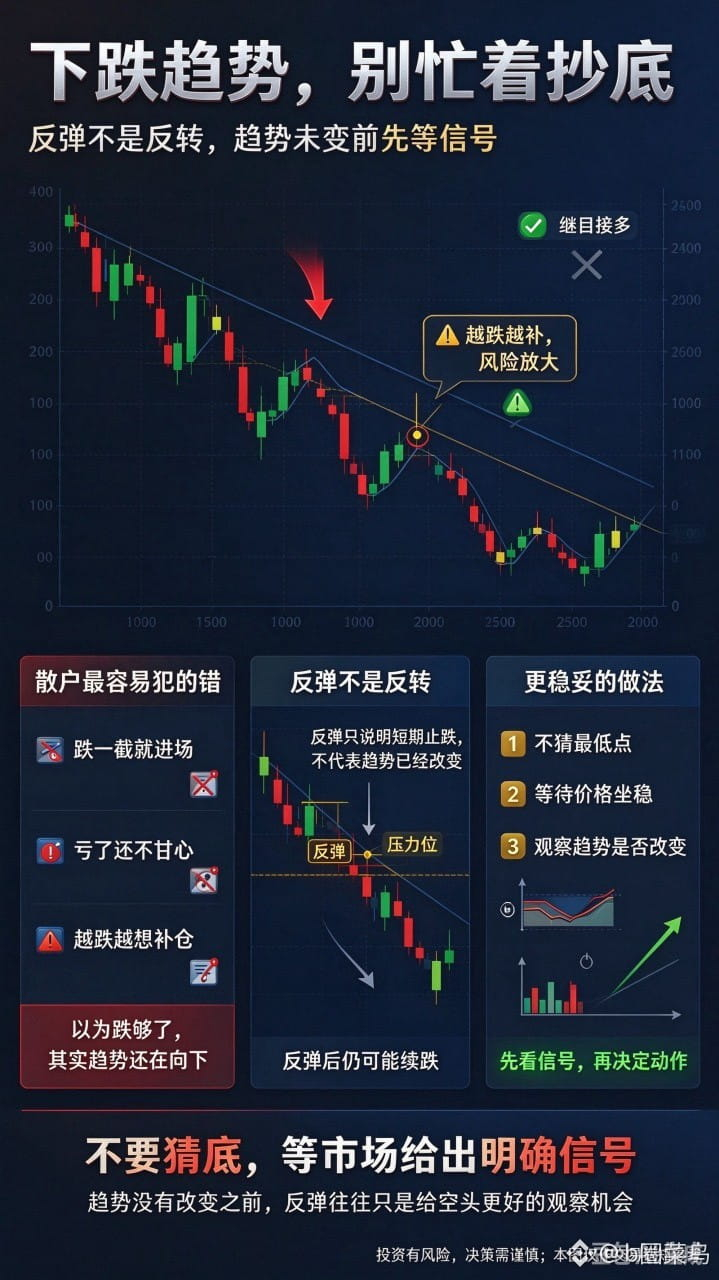
In a falling market, one of the most common mistakes retail traders make is constantly trying to buy the dip. They see prices drop sharply and think they’ve fallen far enough, so they can’t resist jumping in and going long. But as soon as they buy, the market keeps falling. After taking a loss, they still aren’t ready to give up. The more prices fall, the more they want to add to their position, convinced that the next rebound will let them break even. In reality, rebounds are common in a downtrend, but a rebound doesn’t mean the trend has reversed. Instead of wondering every day where the bottom is, it’s better to trade with the trend: wait for prices to rebound to resistance, then look for opportunities to go short. Don’t keep trying to buy at the absolute low and sell at the absolute high. Rather than guessing where the bottom is, retail traders should wait for the market to give a clear signal. Until the trend changes, rebounds often just offer short sellers better entry opportunities.$BTC
{future}(BTCUSDT)
In a falling market, one of the most common mistakes retail traders make is constantly trying to buy the dip. They see prices drop sharply and think they’ve fallen far enough, so they can’t resist jumping in and going long. But as soon as they buy, the market keeps falling. After taking a loss, they still aren’t ready to give up. The more prices fall, the more they want to add to their position, convinced that the next rebound will let them break even. In reality, rebounds are common in a downtrend, but a rebound doesn’t mean the trend has reversed. Instead of wondering every day where the bottom is, it’s better to trade with the trend: wait for prices to rebound to resistance, then look for opportunities to go short. Don’t keep trying to buy at the absolute low and sell at the absolute high. Rather than guessing where the bottom is, retail traders should wait for the market to give a clear signal. Until the trend changes, rebounds often just offer short sellers better entry opportunities.$BTC
292
·
--
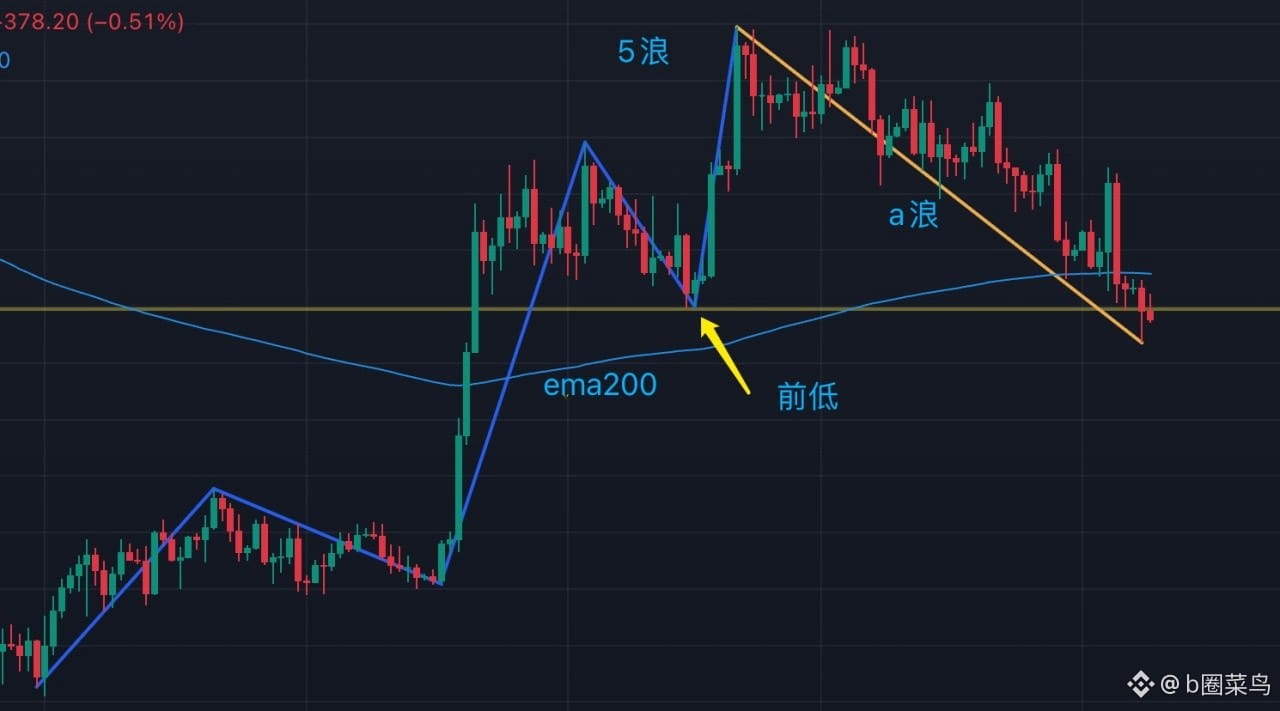
$btc Wave A doesn't necessarily have to fall to a specific price to end; what really matters is whether the downward structure has run its course.
I'd rather wait for three signals to appear together: an important support level holding, a breakout above the short-term declining structure on increased volume, and a successful retest that forms a higher low.
Before these signals appear, even if the price has already fallen quite a bit, we can only say that Wave A may be nearing its end—not declare that it has ended.#BTC走势分析
{future}(BTCUSDT)
$btc Wave A doesn't necessarily have to fall to a specific price to end; what really matters is whether the downward structure has run its course.
I'd rather wait for three signals to appear together: an important support level holding, a breakout above the short-term declining structure on increased volume, and a successful retest that forms a higher low.
Before these signals appear, even if the price has already fallen quite a bit, we can only say that Wave A may be nearing its end—not declare that it has ended.#BTC走势分析
I'd rather wait for three signals to appear together: an important support level holding, a breakout above the short-term declining structure on increased volume, and a successful retest that forms a higher low.
Before these signals appear, even if the price has already fallen quite a bit, we can only say that Wave A may be nearing its end—not declare that it has ended.#BTC走势分析
207
·
--
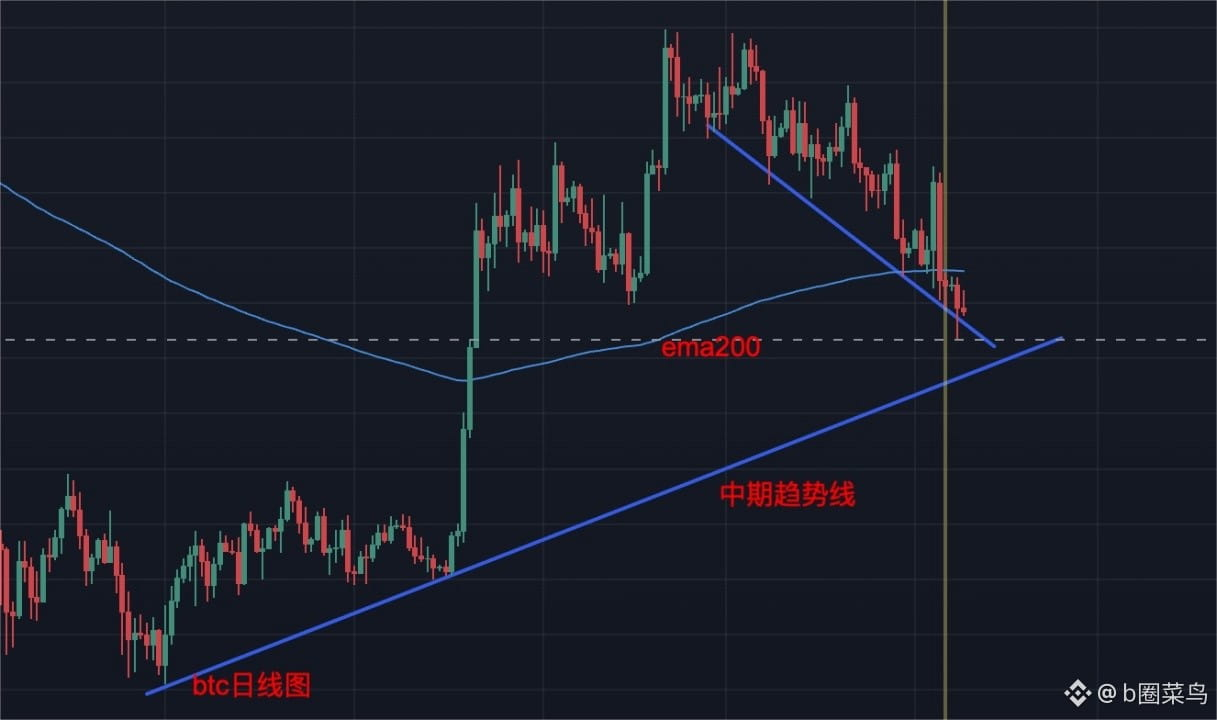
$BTC On the daily chart, the price has now fallen below the EMA200, and the short-term trend has clearly weakened. The descending trendline overhead continues to cap the price, with highs moving lower, indicating that bears still have some control. The price is currently testing the medium-term ascending trendline below, which is also an important support level for the broader uptrend.
Pay close attention to two things next: first, whether the price can reclaim the EMA200. If it continues to fail to move back above it, any rebound may be no more than a weak recovery. Second, whether the ascending trendline below can hold. If the price breaks below it decisively again, it would mean that the previous uptrend structure may have been damaged, and the market could enter a larger correction.
In summary: the descending trendline overhead is acting as resistance, the EMA200 in the middle has already been lost, and the ascending trendline below is now being tested. Bulls are currently on the back foot, and whether the trendline holds will be the most important thing to watch on BTC’s daily chart.#BTC走势分析
{future}(BTCUSDT)
$BTC On the daily chart, the price has now fallen below the EMA200, and the short-term trend has clearly weakened. The descending trendline overhead continues to cap the price, with highs moving lower, indicating that bears still have some control. The price is currently testing the medium-term ascending trendline below, which is also an important support level for the broader uptrend.
Pay close attention to two things next: first, whether the price can reclaim the EMA200. If it continues to fail to move back above it, any rebound may be no more than a weak recovery. Second, whether the ascending trendline below can hold. If the price breaks below it decisively again, it would mean that the previous uptrend structure may have been damaged, and the market could enter a larger correction.
In summary: the descending trendline overhead is acting as resistance, the EMA200 in the middle has already been lost, and the ascending trendline below is now being tested. Bulls are currently on the back foot, and whether the trendline holds will be the most important thing to watch on BTC’s daily chart.#BTC走势分析
Pay close attention to two things next: first, whether the price can reclaim the EMA200. If it continues to fail to move back above it, any rebound may be no more than a weak recovery. Second, whether the ascending trendline below can hold. If the price breaks below it decisively again, it would mean that the previous uptrend structure may have been damaged, and the market could enter a larger correction.
In summary: the descending trendline overhead is acting as resistance, the EMA200 in the middle has already been lost, and the ascending trendline below is now being tested. Bulls are currently on the back foot, and whether the trendline holds will be the most important thing to watch on BTC’s daily chart.#BTC走势分析
127
·
--
The mindset of bulls lately:
At first, they were full of confidence, convinced that every pullback was an opportunity. Later, they reassured themselves that every drop was just a shakeout, and hoped that every rebound meant the rally was starting up again. But as one hope after another failed to materialize, what slowly wore down wasn’t just their account profits, but also their patience with their positions and their confidence in the market. At first, they dared to add to their positions; now they hesitate. At first, the more prices fell, the more they wanted to buy the dip; now they just hope for a rebound that will give them a chance to get out. The most grueling part isn’t a string of steep declines—it’s being given hope again and again, only to be disappointed again and again. After a month of this, bulls may not have lost faith in the market’s prospects; they may simply have been worn down to the point where they no longer dare to believe in a rally.
Rushing in to buy the dip without a clear signal that prices have bottomed is essentially gambling on luck, not trading. The fact that prices have fallen a lot doesn’t mean they’ll rebound right away; looking cheap doesn’t mean they’ve hit bottom. Many people are always trying to buy at the absolute low, overlooking the fact that a genuine market reversal needs confirmation from signals. It’s fine to miss the bottom; there’s no need to use your own money to test for one. Rather than trying to guess the bottom in advance, wait for signals such as prices stabilizing, a high-volume rebound, and a recovery in market structure to emerge, then consider entering. Trading isn’t about who buys the dip earliest; it’s about who acts when the odds are more clearly in their favor.
A quick review:
Although the big bullish candle from the day before yesterday was strong, the market was still in a downtrend at the time. Since it hadn’t made a higher high, the bulls really got carried away. They should have waited for a higher low before entering.#BTC
{future}(BTCUSDT)
The mindset of bulls lately:
At first, they were full of confidence, convinced that every pullback was an opportunity. Later, they reassured themselves that every drop was just a shakeout, and hoped that every rebound meant the rally was starting up again. But as one hope after another failed to materialize, what slowly wore down wasn’t just their account profits, but also their patience with their positions and their confidence in the market. At first, they dared to add to their positions; now they hesitate. At first, the more prices fell, the more they wanted to buy the dip; now they just hope for a rebound that will give them a chance to get out. The most grueling part isn’t a string of steep declines—it’s being given hope again and again, only to be disappointed again and again. After a month of this, bulls may not have lost faith in the market’s prospects; they may simply have been worn down to the point where they no longer dare to believe in a rally.
Rushing in to buy the dip without a clear signal that prices have bottomed is essentially gambling on luck, not trading. The fact that prices have fallen a lot doesn’t mean they’ll rebound right away; looking cheap doesn’t mean they’ve hit bottom. Many people are always trying to buy at the absolute low, overlooking the fact that a genuine market reversal needs confirmation from signals. It’s fine to miss the bottom; there’s no need to use your own money to test for one. Rather than trying to guess the bottom in advance, wait for signals such as prices stabilizing, a high-volume rebound, and a recovery in market structure to emerge, then consider entering. Trading isn’t about who buys the dip earliest; it’s about who acts when the odds are more clearly in their favor.
A quick review:
Although the big bullish candle from the day before yesterday was strong, the market was still in a downtrend at the time. Since it hadn’t made a higher high, the bulls really got carried away. They should have waited for a higher low before entering.#BTC
At first, they were full of confidence, convinced that every pullback was an opportunity. Later, they reassured themselves that every drop was just a shakeout, and hoped that every rebound meant the rally was starting up again. But as one hope after another failed to materialize, what slowly wore down wasn’t just their account profits, but also their patience with their positions and their confidence in the market. At first, they dared to add to their positions; now they hesitate. At first, the more prices fell, the more they wanted to buy the dip; now they just hope for a rebound that will give them a chance to get out. The most grueling part isn’t a string of steep declines—it’s being given hope again and again, only to be disappointed again and again. After a month of this, bulls may not have lost faith in the market’s prospects; they may simply have been worn down to the point where they no longer dare to believe in a rally.
Rushing in to buy the dip without a clear signal that prices have bottomed is essentially gambling on luck, not trading. The fact that prices have fallen a lot doesn’t mean they’ll rebound right away; looking cheap doesn’t mean they’ve hit bottom. Many people are always trying to buy at the absolute low, overlooking the fact that a genuine market reversal needs confirmation from signals. It’s fine to miss the bottom; there’s no need to use your own money to test for one. Rather than trying to guess the bottom in advance, wait for signals such as prices stabilizing, a high-volume rebound, and a recovery in market structure to emerge, then consider entering. Trading isn’t about who buys the dip earliest; it’s about who acts when the odds are more clearly in their favor.
A quick review:
Although the big bullish candle from the day before yesterday was strong, the market was still in a downtrend at the time. Since it hadn’t made a higher high, the bulls really got carried away. They should have waited for a higher low before entering.#BTC
151
·
--
{future}(XAUTUSDT)
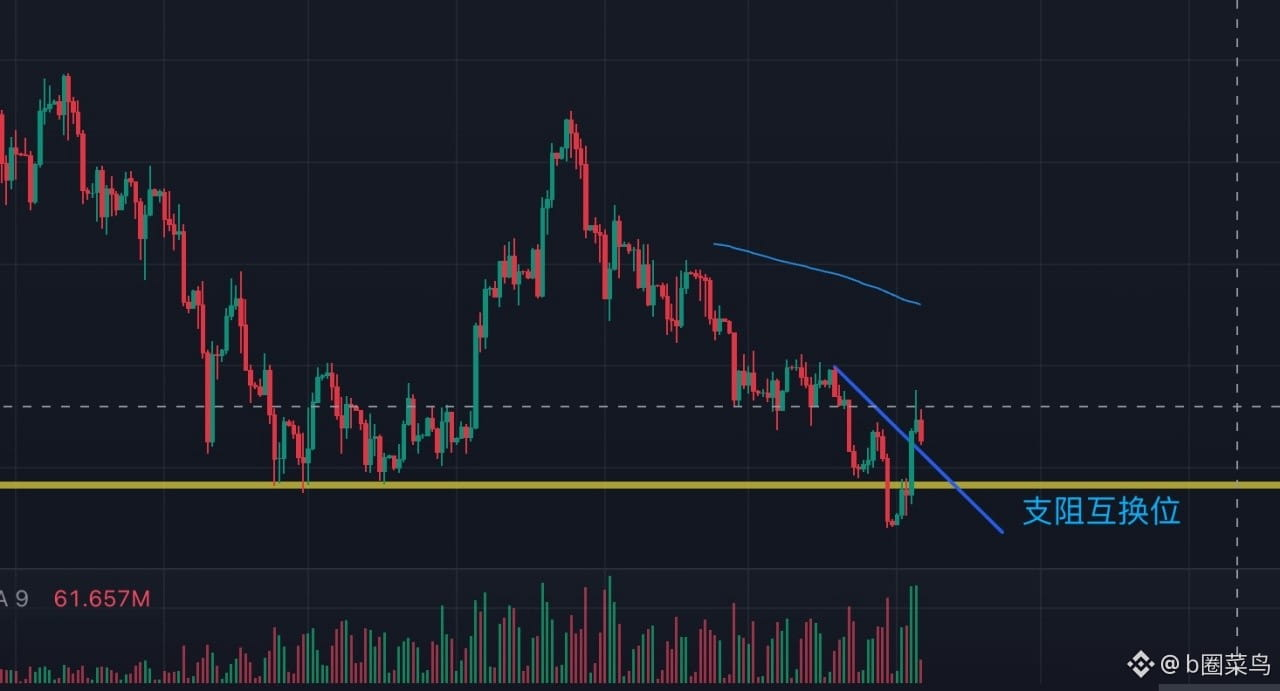
Gold Daily Chart
The yellow horizontal line marks the most important support-resistance flip level on the gold daily chart. Previously, prices found support here several times, indicating that buying pressure had built up in this area. However, after recently breaking below it on heavy volume, the former support may turn into new resistance. Although prices have rebounded sharply and climbed back above the yellow zone, it remains to be confirmed whether they can hold above it. If a subsequent pullback holds above the yellow level, the support-resistance flip may be complete, giving prices fresh momentum to move higher. Conversely, if the rebound lacks strength and prices fall below the yellow line again, this recovery may prove to be only a brief false breakout, and a second test of lower levels should still be watched for. The key is not whether prices can get above the level, but whether they can stay above it. #黄金
Gold Daily Chart
The yellow horizontal line marks the most important support-resistance flip level on the gold daily chart. Previously, prices found support here several times, indicating that buying pressure had built up in this area. However, after recently breaking below it on heavy volume, the former support may turn into new resistance. Although prices have rebounded sharply and climbed back above the yellow zone, it remains to be confirmed whether they can hold above it. If a subsequent pullback holds above the yellow level, the support-resistance flip may be complete, giving prices fresh momentum to move higher. Conversely, if the rebound lacks strength and prices fall below the yellow line again, this recovery may prove to be only a brief false breakout, and a second test of lower levels should still be watched for. The key is not whether prices can get above the level, but whether they can stay above it. #黄金
The yellow horizontal line marks the most important support-resistance flip level on the gold daily chart. Previously, prices found support here several times, indicating that buying pressure had built up in this area. However, after recently breaking below it on heavy volume, the former support may turn into new resistance. Although prices have rebounded sharply and climbed back above the yellow zone, it remains to be confirmed whether they can hold above it. If a subsequent pullback holds above the yellow level, the support-resistance flip may be complete, giving prices fresh momentum to move higher. Conversely, if the rebound lacks strength and prices fall below the yellow line again, this recovery may prove to be only a brief false breakout, and a second test of lower levels should still be watched for. The key is not whether prices can get above the level, but whether they can stay above it. #黄金
244
·
--
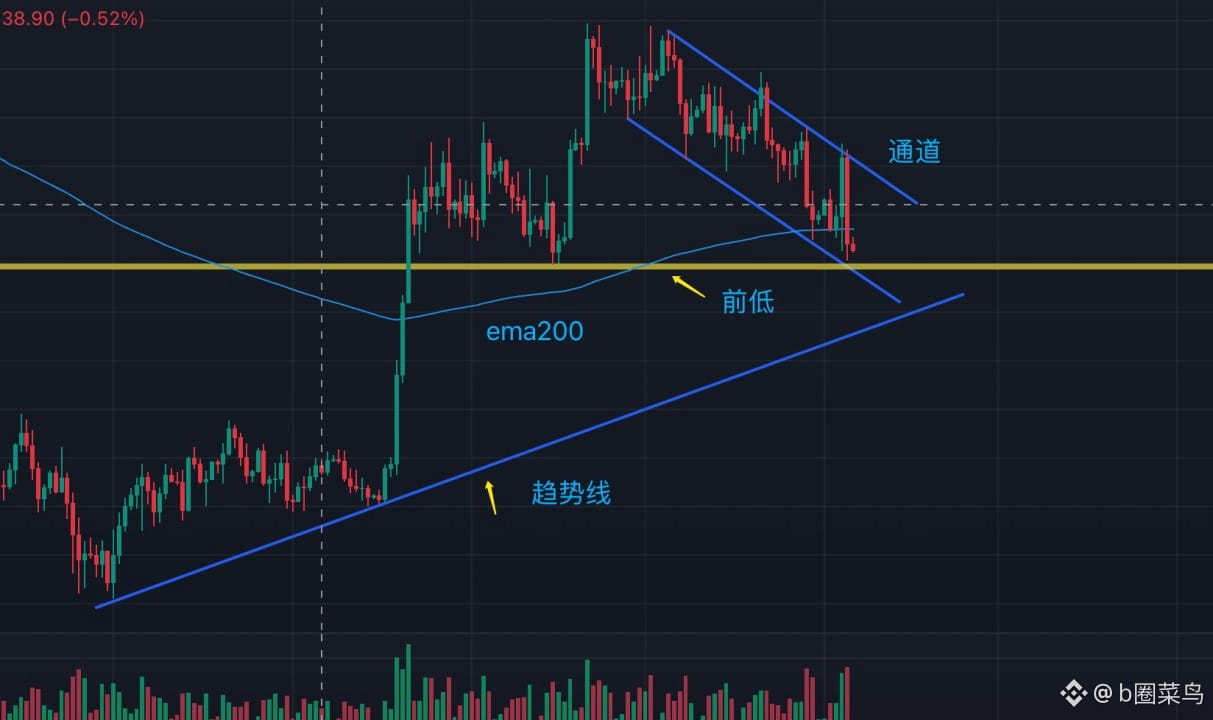
$BTC BTC daily chart
The price has now fallen below the EMA200 and retreated to near the previous low, indicating that bullish defenses are under increasing pressure. Next, focus on the yellow horizontal support and the rising trendline below. If the previous low fails and the price falls further below the rising trendline, the previous uptrend structure may be damaged, and the market could shift from a normal pullback to a larger-scale correction. Of course, if the price can reclaim the EMA200 and break above the upper boundary of the descending channel, there may still be a chance to reverse the weakness. The EMA200 has already been breached, so the trendline will be the next important line of defense. Whether it holds will directly affect the market structure going forward.#BTC走势分析
{future}(BTCUSDT)
$BTC BTC daily chart
The price has now fallen below the EMA200 and retreated to near the previous low, indicating that bullish defenses are under increasing pressure. Next, focus on the yellow horizontal support and the rising trendline below. If the previous low fails and the price falls further below the rising trendline, the previous uptrend structure may be damaged, and the market could shift from a normal pullback to a larger-scale correction. Of course, if the price can reclaim the EMA200 and break above the upper boundary of the descending channel, there may still be a chance to reverse the weakness. The EMA200 has already been breached, so the trendline will be the next important line of defense. Whether it holds will directly affect the market structure going forward.#BTC走势分析
The price has now fallen below the EMA200 and retreated to near the previous low, indicating that bullish defenses are under increasing pressure. Next, focus on the yellow horizontal support and the rising trendline below. If the previous low fails and the price falls further below the rising trendline, the previous uptrend structure may be damaged, and the market could shift from a normal pullback to a larger-scale correction. Of course, if the price can reclaim the EMA200 and break above the upper boundary of the descending channel, there may still be a chance to reverse the weakness. The EMA200 has already been breached, so the trendline will be the next important line of defense. Whether it holds will directly affect the market structure going forward.#BTC走势分析
316
·
--
I had just drawn the door by hand, and it came down 😂#BTC走势分析
{future}(BTCUSDT)
I had just drawn the door by hand, and it came down 😂#BTC走势分析
b圈菜鸟
·
--
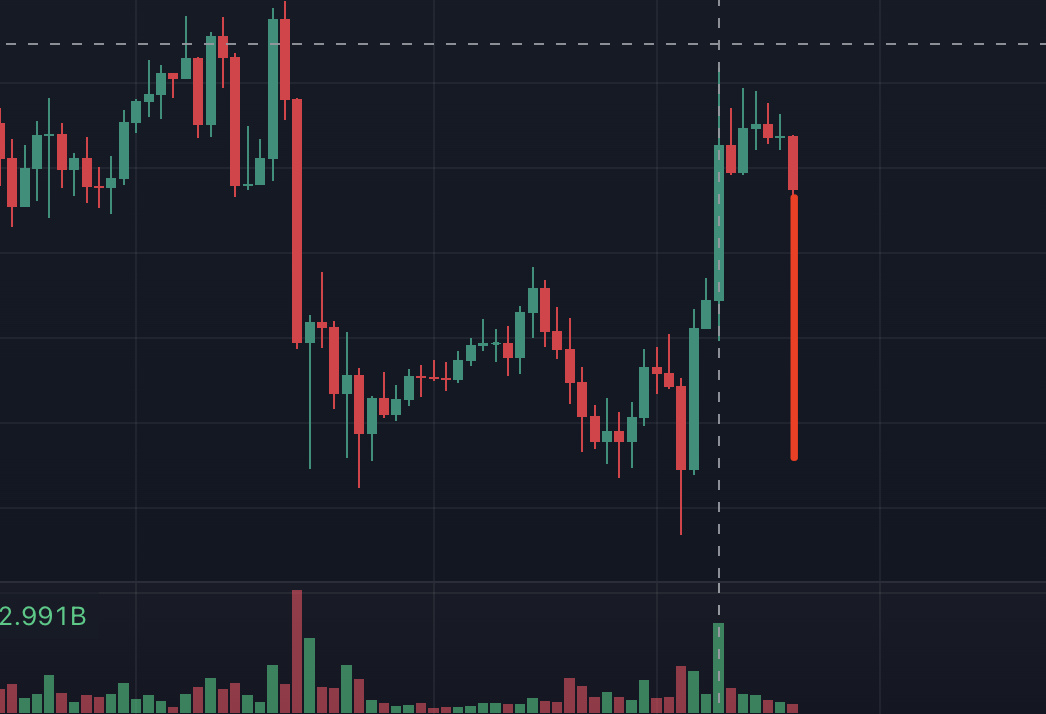
$BTC The cruelest kind of market manipulation isn't stopping you from making money—it's making you feel like you're just about to, then taking away your confidence along with your profits.
If this really plays out, it'll probably be another major bloodbath where both bulls and bears get slaughtered.
If this really plays out, it'll probably be another major bloodbath where both bulls and bears get slaughtered.
291
·
--
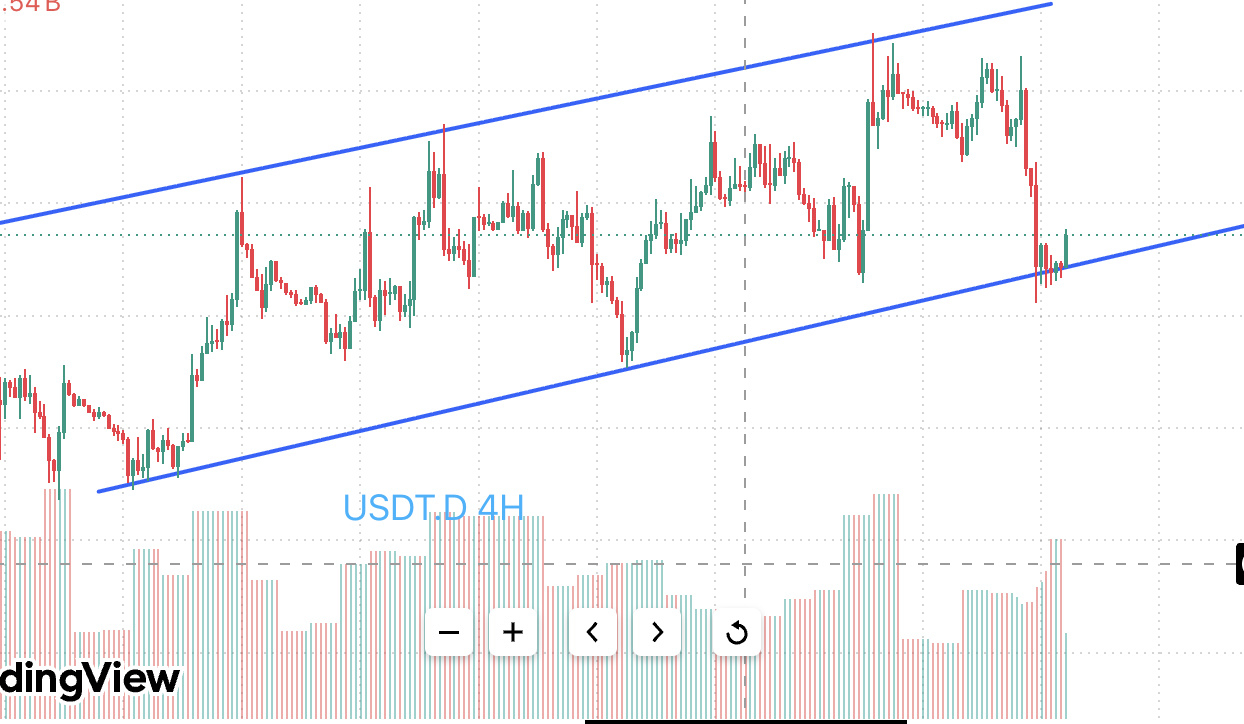
From a broader structural perspective, USDT.D remains within an ascending channel, but price action on the right side of the chart has clearly weakened. Several earlier attempts to break above the channel’s upper boundary failed, followed by consecutive large bearish candles and a noticeable increase in volume. This indicates heavy selling pressure overhead, with bears beginning to take control in the short term. Price has now retreated to near the channel’s lower boundary, a key support area. If it stabilizes here and volume picks up, it could rebound toward the middle or upper part of the channel. However, if the rebound is weak and price later breaks below the lower boundary on increased volume, be cautious and don’t rush to buy the dip. The key is to watch whether the lower boundary holds.
From a broader structural perspective, USDT.D remains within an ascending channel, but price action on the right side of the chart has clearly weakened. Several earlier attempts to break above the channel’s upper boundary failed, followed by consecutive large bearish candles and a noticeable increase in volume. This indicates heavy selling pressure overhead, with bears beginning to take control in the short term. Price has now retreated to near the channel’s lower boundary, a key support area. If it stabilizes here and volume picks up, it could rebound toward the middle or upper part of the channel. However, if the rebound is weak and price later breaks below the lower boundary on increased volume, be cautious and don’t rush to buy the dip. The key is to watch whether the lower boundary holds.
97
·
--
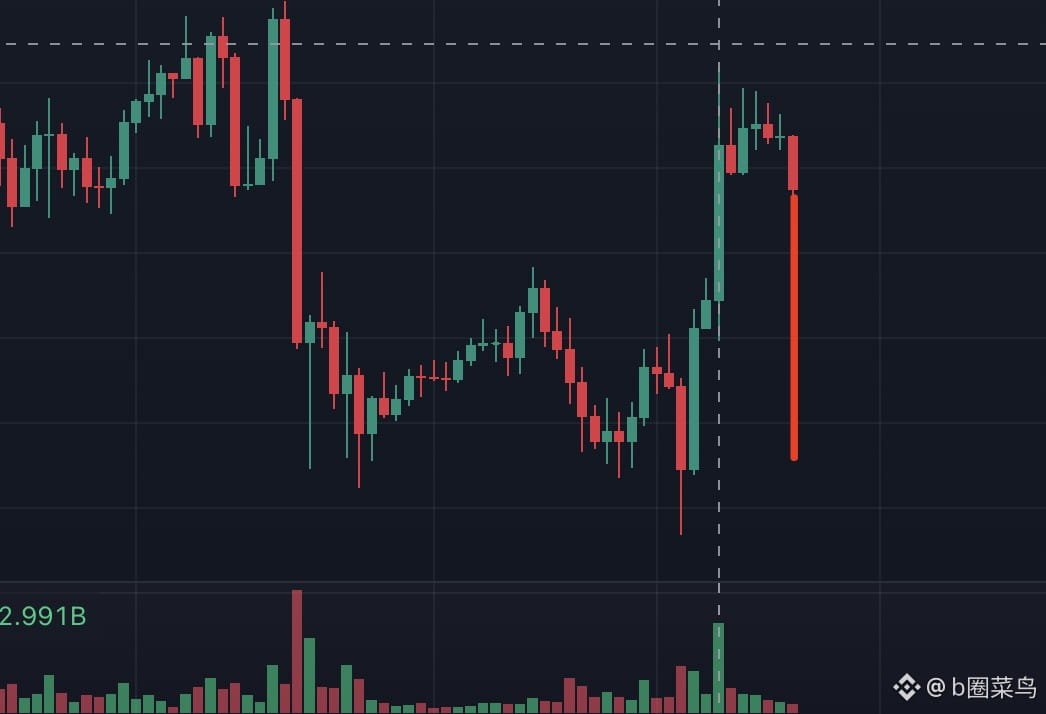
$BTC The cruelest kind of market manipulation isn't stopping you from making money—it's making you feel like you're just about to, then taking away your confidence along with your profits.
If this really plays out, it'll probably be another major bloodbath where both bulls and bears get slaughtered.
{future}(BTCUSDT)
$BTC The cruelest kind of market manipulation isn't stopping you from making money—it's making you feel like you're just about to, then taking away your confidence along with your profits.
If this really plays out, it'll probably be another major bloodbath where both bulls and bears get slaughtered.
If this really plays out, it'll probably be another major bloodbath where both bulls and bears get slaughtered.
1
1
900
·
--
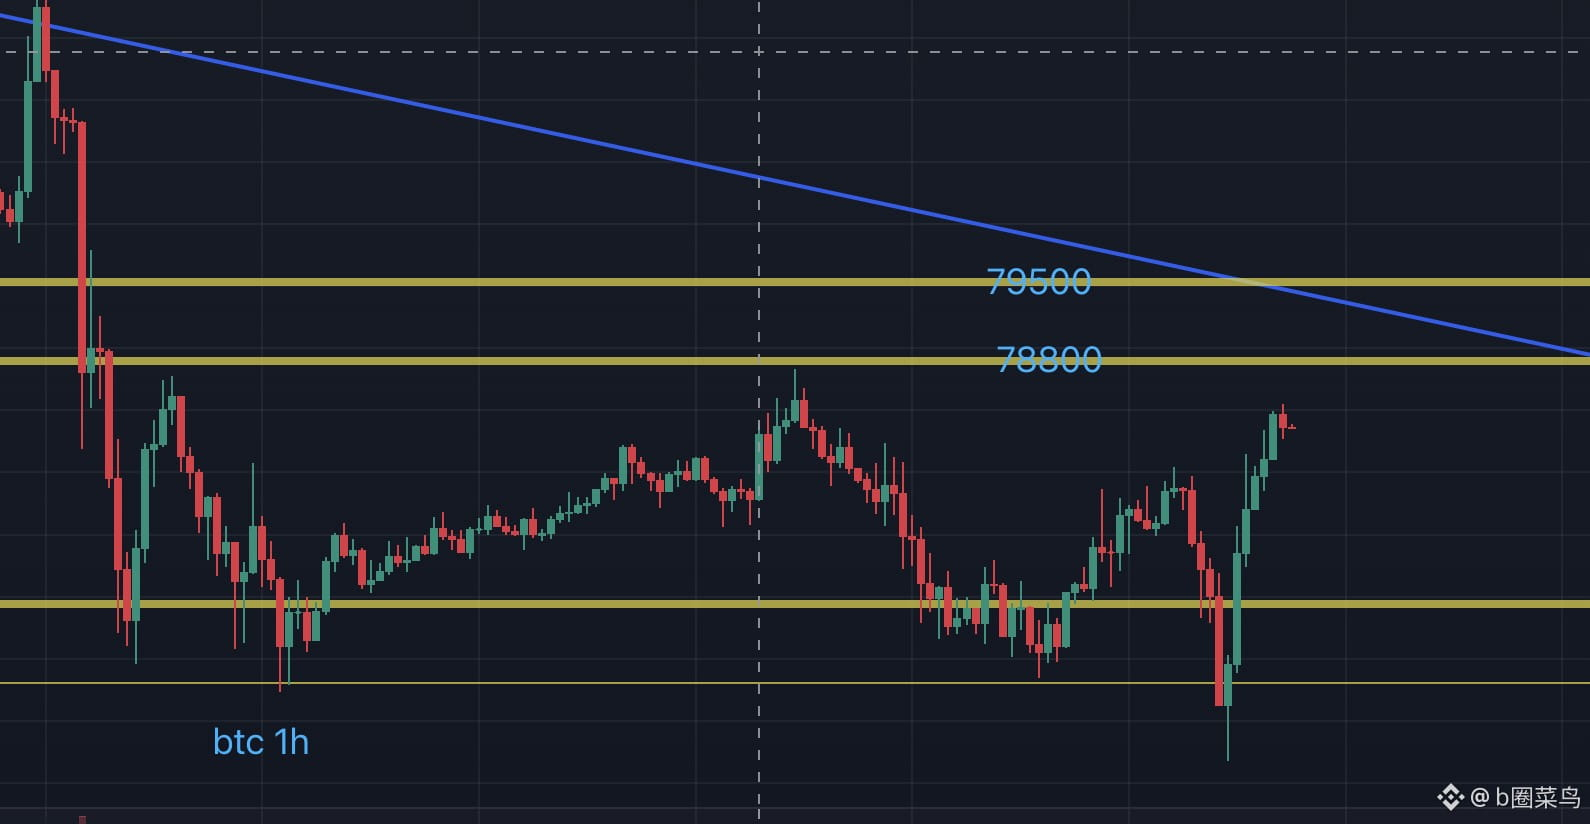
$BTC on the 1-hour timeframe: Price previously broke below the equal-lows area, but quickly reclaimed it, forming a fairly clear false breakdown. This suggests that some liquidity below has been cleared. The bears failed to gain any sustained advantage during the breakdown; instead, price quickly rebounded. Volume is also providing some confirmation, suggesting this bounce is not driven solely by price momentum, and that short-term buyers are offering some support.
Next, watch the 78800–79500 resistance zone closely. Of these levels, 78800 is currently a key dividing line. If price can move decisively above it and hold there, that would suggest the short-term bulls still have the initiative, creating an opportunity for a further test of 79500.
79500 is an important former support-resistance flip zone, and it also coincides with resistance from the descending trendline, making it a key resistance area. A direct breakout may be difficult the first time price reaches this level. If price spikes and then pulls back, stalls on increased volume, or forms a prominent upper wick, a small short position could be considered. However, avoid blindly trying to pick the top in advance; it is better to wait for a clear sign of rejection.
To the downside, keep a close eye on support around 76900. If price pulls back and stabilizes at this level without a clear breakdown on increased volume, a low-risk long opportunity may be worth considering. The overall approach is to watch for bullish continuation above 78800, monitor the reaction to resistance near 79500, and treat 76900 as a key support level. #BTC走势分析
{spot}(BTCUSDT)
$BTC on the 1-hour timeframe: Price previously broke below the equal-lows area, but quickly reclaimed it, forming a fairly clear false breakdown. This suggests that some liquidity below has been cleared. The bears failed to gain any sustained advantage during the breakdown; instead, price quickly rebounded. Volume is also providing some confirmation, suggesting this bounce is not driven solely by price momentum, and that short-term buyers are offering some support.
Next, watch the 78800–79500 resistance zone closely. Of these levels, 78800 is currently a key dividing line. If price can move decisively above it and hold there, that would suggest the short-term bulls still have the initiative, creating an opportunity for a further test of 79500.
79500 is an important former support-resistance flip zone, and it also coincides with resistance from the descending trendline, making it a key resistance area. A direct breakout may be difficult the first time price reaches this level. If price spikes and then pulls back, stalls on increased volume, or forms a prominent upper wick, a small short position could be considered. However, avoid blindly trying to pick the top in advance; it is better to wait for a clear sign of rejection.
To the downside, keep a close eye on support around 76900. If price pulls back and stabilizes at this level without a clear breakdown on increased volume, a low-risk long opportunity may be worth considering. The overall approach is to watch for bullish continuation above 78800, monitor the reaction to resistance near 79500, and treat 76900 as a key support level. #BTC走势分析
Next, watch the 78800–79500 resistance zone closely. Of these levels, 78800 is currently a key dividing line. If price can move decisively above it and hold there, that would suggest the short-term bulls still have the initiative, creating an opportunity for a further test of 79500.
79500 is an important former support-resistance flip zone, and it also coincides with resistance from the descending trendline, making it a key resistance area. A direct breakout may be difficult the first time price reaches this level. If price spikes and then pulls back, stalls on increased volume, or forms a prominent upper wick, a small short position could be considered. However, avoid blindly trying to pick the top in advance; it is better to wait for a clear sign of rejection.
To the downside, keep a close eye on support around 76900. If price pulls back and stabilizes at this level without a clear breakdown on increased volume, a low-risk long opportunity may be worth considering. The overall approach is to watch for bullish continuation above 78800, monitor the reaction to resistance near 79500, and treat 76900 as a key support level. #BTC走势分析
1
424
·
--
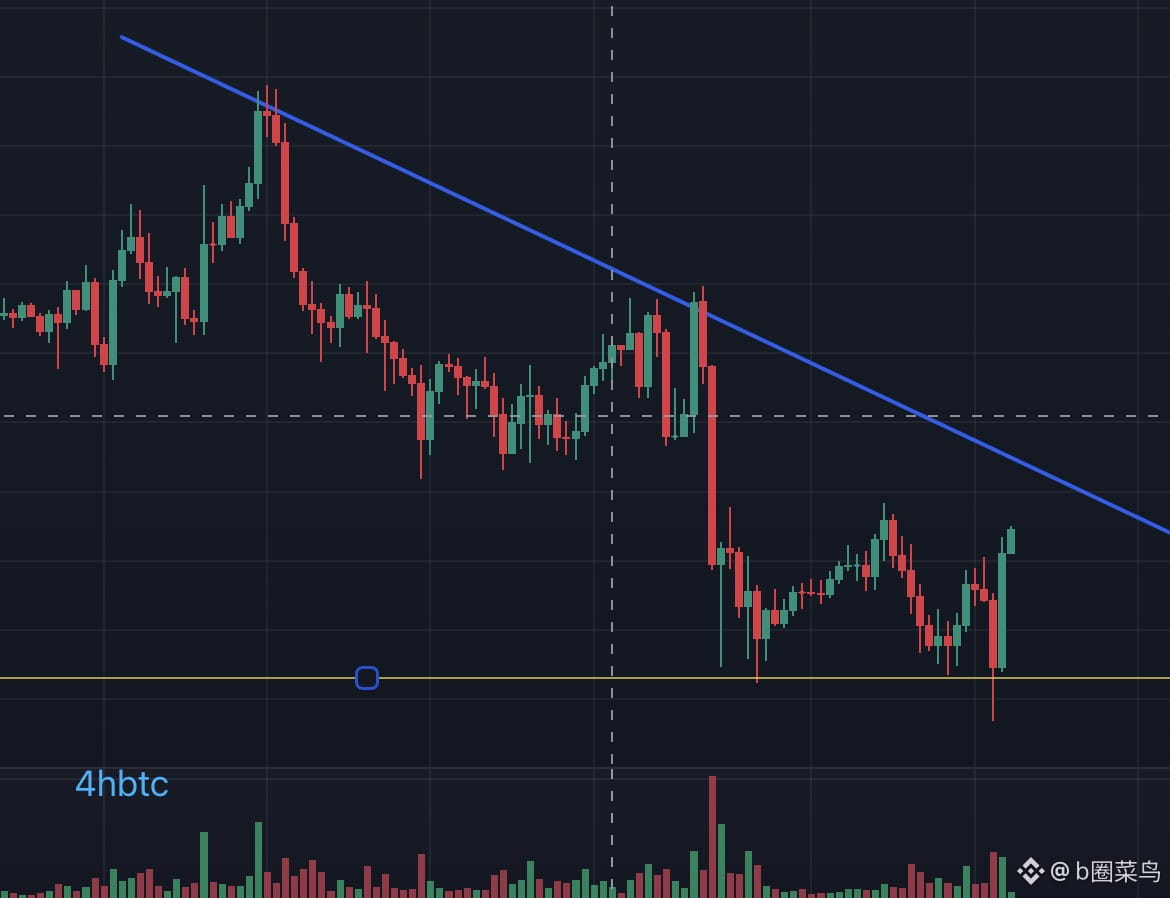
$BTC Looking at the BTC 4-hour candlestick chart, after the price broke below the previous horizontal support level, it did not continue moving lower. Instead, it quickly rebounded above the support line, forming a pronounced lower wick. This indicates strong buying interest below.
Trading volume increased noticeably during the breakdown, suggesting intense buying and selling at that level. However, the price did not continue falling; it quickly recovered instead, indicating that selling pressure may have been absorbed. This combination of a high-volume breakdown followed by a rapid recovery warrants caution, as it could be a false breakdown.
However, it is too early to conclude that the trend has reversed. The blue descending trendline above still presents clear resistance. Going forward, we need to watch whether the price can hold above the yellow support line and break above the descending trendline on rising volume before a reversal becomes possible. #BTC
{future}(BTCUSDT)
$BTC Looking at the BTC 4-hour candlestick chart, after the price broke below the previous horizontal support level, it did not continue moving lower. Instead, it quickly rebounded above the support line, forming a pronounced lower wick. This indicates strong buying interest below.
Trading volume increased noticeably during the breakdown, suggesting intense buying and selling at that level. However, the price did not continue falling; it quickly recovered instead, indicating that selling pressure may have been absorbed. This combination of a high-volume breakdown followed by a rapid recovery warrants caution, as it could be a false breakdown.
However, it is too early to conclude that the trend has reversed. The blue descending trendline above still presents clear resistance. Going forward, we need to watch whether the price can hold above the yellow support line and break above the descending trendline on rising volume before a reversal becomes possible. #BTC
Trading volume increased noticeably during the breakdown, suggesting intense buying and selling at that level. However, the price did not continue falling; it quickly recovered instead, indicating that selling pressure may have been absorbed. This combination of a high-volume breakdown followed by a rapid recovery warrants caution, as it could be a false breakdown.
However, it is too early to conclude that the trend has reversed. The blue descending trendline above still presents clear resistance. Going forward, we need to watch whether the price can hold above the yellow support line and break above the descending trendline on rising volume before a reversal becomes possible. #BTC
217
·
--
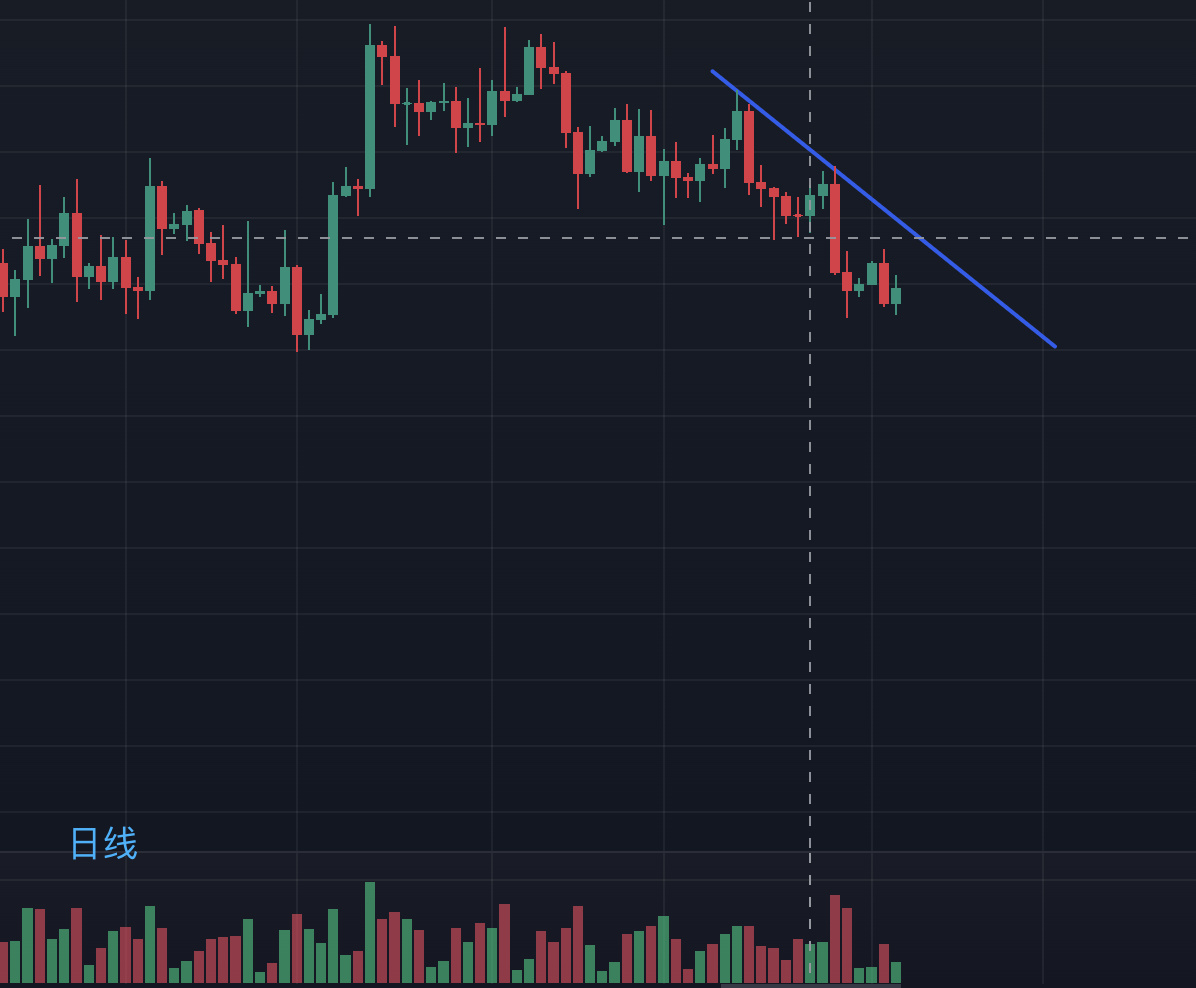
$BTC The price is generally following a choppy downward trend, with successive lower highs. On the daily chart, it remains clearly capped by the descending trendline, and the bearish trend has yet to reverse decisively. Although a slight rebound has emerged, many traders are chasing the downside and trading volume is insufficient, so it is difficult to confirm a reversal signal for now. #BTC走势分析
{future}(BTCUSDT)
$BTC The price is generally following a choppy downward trend, with successive lower highs. On the daily chart, it remains clearly capped by the descending trendline, and the bearish trend has yet to reverse decisively. Although a slight rebound has emerged, many traders are chasing the downside and trading volume is insufficient, so it is difficult to confirm a reversal signal for now. #BTC走势分析
171
·
--
{future}(BTCUSDT)
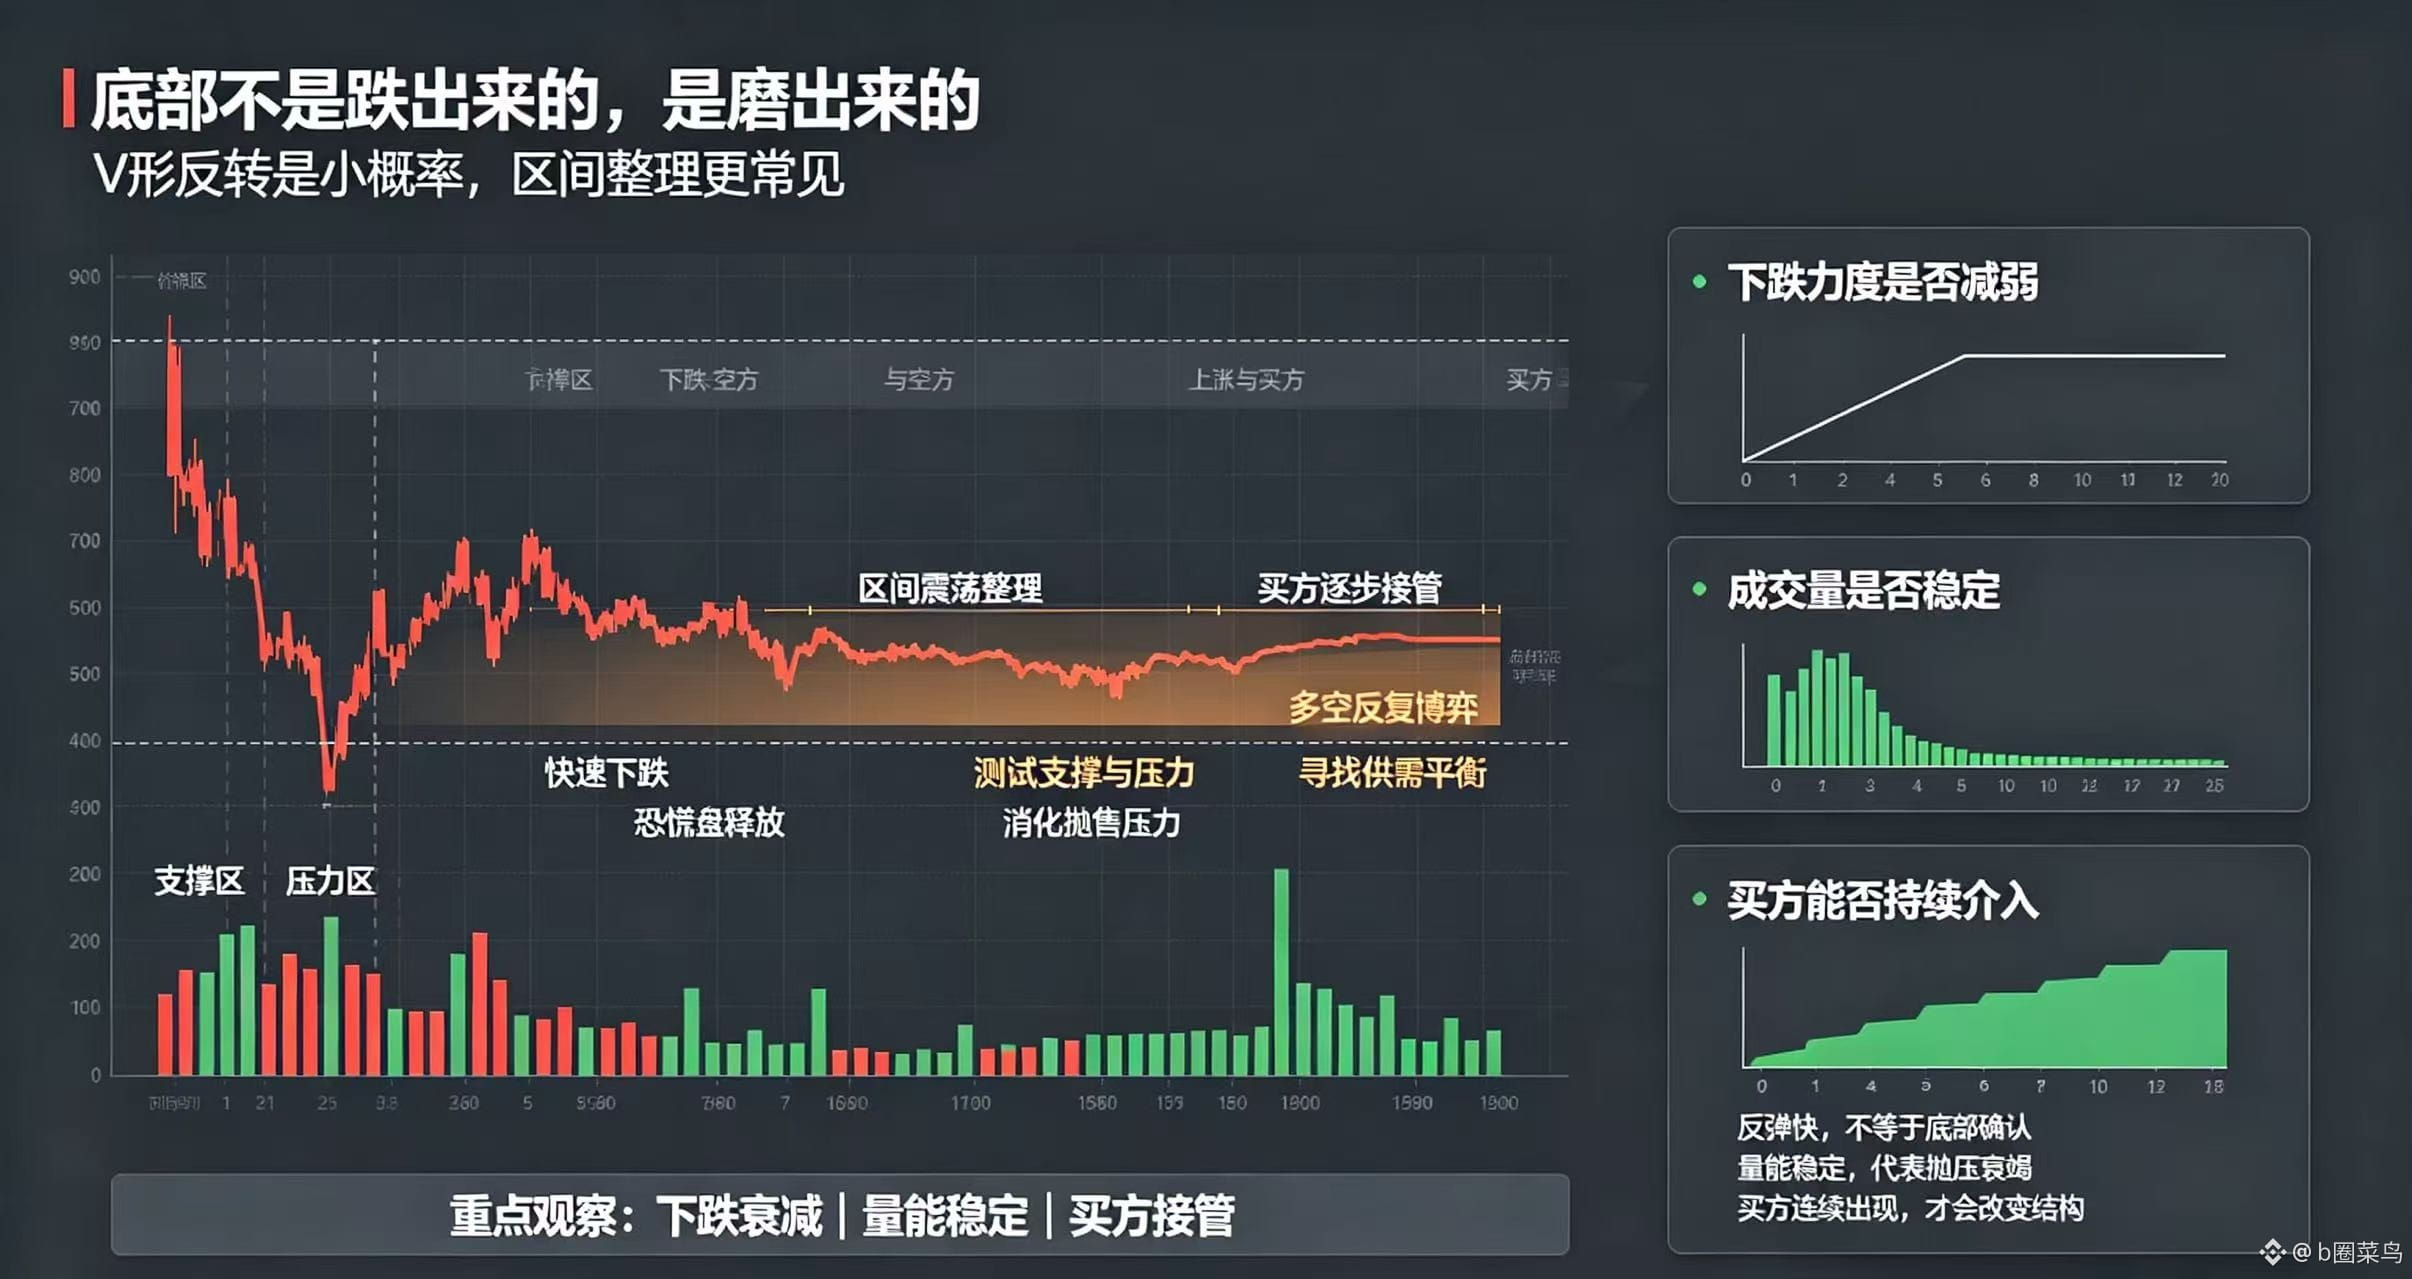
$BTC Market bottoms are rarely formed through a V-shaped reversal; more often, they require a period of consolidation. After a sharp decline, market sentiment does not recover immediately. Panic selling, trapped investors, and bargain hunters continue to battle it out. Prices may fluctuate within a range, repeatedly testing support and resistance while absorbing selling pressure built up earlier. This process can seem tedious and may even make people wonder whether a bottom has really formed. In reality, the market is searching for a new balance between supply and demand. What matters is not whether prices can rebound quickly, but whether the downward momentum is easing, trading volume is stabilizing, and buyers are gradually taking control. A bottom is rarely formed by falling alone; it takes shape gradually through repeated fluctuations and battles between buyers and sellers.
$BTC Market bottoms are rarely formed through a V-shaped reversal; more often, they require a period of consolidation. After a sharp decline, market sentiment does not recover immediately. Panic selling, trapped investors, and bargain hunters continue to battle it out. Prices may fluctuate within a range, repeatedly testing support and resistance while absorbing selling pressure built up earlier. This process can seem tedious and may even make people wonder whether a bottom has really formed. In reality, the market is searching for a new balance between supply and demand. What matters is not whether prices can rebound quickly, but whether the downward momentum is easing, trading volume is stabilizing, and buyers are gradually taking control. A bottom is rarely formed by falling alone; it takes shape gradually through repeated fluctuations and battles between buyers and sellers.
1
398
·
--
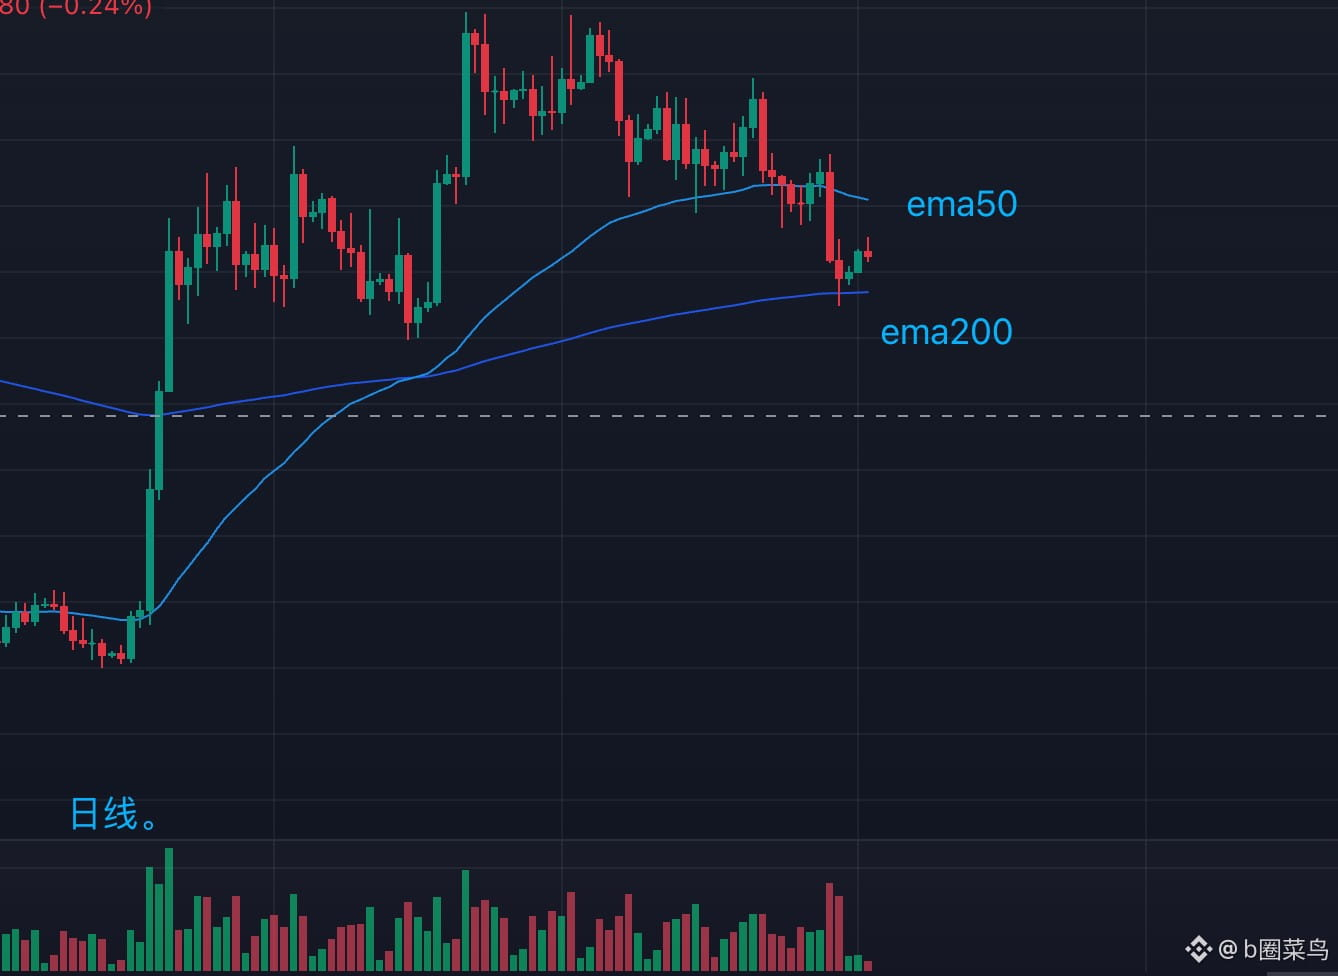
B$BTC The daily price has fallen below EMA50, weakening short-term upward momentum, and EMA50 is gradually forming resistance overhead. EMA200 continues to trend upward, so the medium- to long-term trend has not completely deteriorated for now.
Looking at trading volume, volume has increased somewhat during the recent decline, while it has contracted noticeably during rebounds. This indicates that selling pressure is currently relatively strong, while buying support remains insufficient.
Going forward, pay close attention to support at EMA200. If the price stabilizes near EMA200, accompanied by a recovery in volume, and climbs back above EMA50, a further rebound may follow. Conversely, if it breaks below EMA200 on increased volume, be alert to a further correction, as the medium-term outlook may weaken.#BTC走势分析
{spot}(BTCUSDT)
B$BTC The daily price has fallen below EMA50, weakening short-term upward momentum, and EMA50 is gradually forming resistance overhead. EMA200 continues to trend upward, so the medium- to long-term trend has not completely deteriorated for now.
Looking at trading volume, volume has increased somewhat during the recent decline, while it has contracted noticeably during rebounds. This indicates that selling pressure is currently relatively strong, while buying support remains insufficient.
Going forward, pay close attention to support at EMA200. If the price stabilizes near EMA200, accompanied by a recovery in volume, and climbs back above EMA50, a further rebound may follow. Conversely, if it breaks below EMA200 on increased volume, be alert to a further correction, as the medium-term outlook may weaken.#BTC走势分析
Looking at trading volume, volume has increased somewhat during the recent decline, while it has contracted noticeably during rebounds. This indicates that selling pressure is currently relatively strong, while buying support remains insufficient.
Going forward, pay close attention to support at EMA200. If the price stabilizes near EMA200, accompanied by a recovery in volume, and climbs back above EMA50, a further rebound may follow. Conversely, if it breaks below EMA200 on increased volume, be alert to a further correction, as the medium-term outlook may weaken.#BTC走势分析
182
·
--
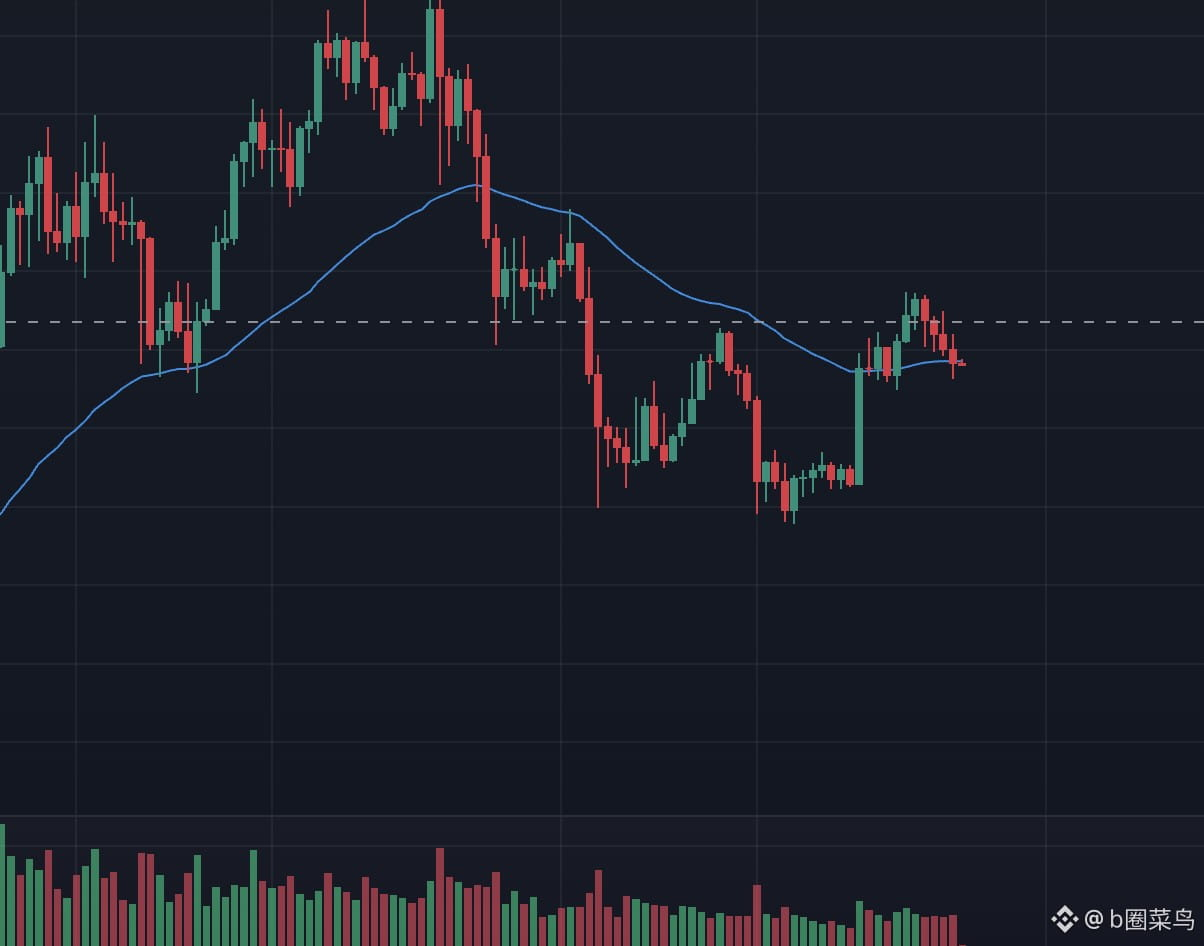
$BTC On the weekly timeframe, the overall structure remains bearish. EMA50 has turned from support into resistance, and the recent rebound looks more like a recovery within the downtrend than a confirmed trend reversal.#BTC
{future}(BTCUSDT)
$BTC On the weekly timeframe, the overall structure remains bearish. EMA50 has turned from support into resistance, and the recent rebound looks more like a recovery within the downtrend than a confirmed trend reversal.#BTC
123
·
--
$BTC The most harmful thing in the market is often these two phrases: "I feel it will go up," "I feel it will go down." Feelings are just subjective emotions, not market signals. When prices rise, greedy instincts will make you chase the rally; when prices fall, fear-driven instincts will make you cut losses. The market will not move according to people’s hunches. Being right for a moment is just luck; when you place trades based on feeling, profits and losses are all a gamble. Trading requires setting feelings aside and making judgments based on your trading rules, support and resistance, and volume structure. You can have a hunch, but you cannot use it as the basis for entry. First decide on stop-loss and position size, then act only after the signal is confirmed. Don’t let a fleeting feeling dominate the whole trade.
{future}(BTCUSDT)
$BTC The most harmful thing in the market is often these two phrases: "I feel it will go up," "I feel it will go down." Feelings are just subjective emotions, not market signals. When prices rise, greedy instincts will make you chase the rally; when prices fall, fear-driven instincts will make you cut losses. The market will not move according to people’s hunches. Being right for a moment is just luck; when you place trades based on feeling, profits and losses are all a gamble. Trading requires setting feelings aside and making judgments based on your trading rules, support and resistance, and volume structure. You can have a hunch, but you cannot use it as the basis for entry. First decide on stop-loss and position size, then act only after the signal is confirmed. Don’t let a fleeting feeling dominate the whole trade.
321
·
--
$SOL On the daily chart, SOL has made a three-wave decline, and volume on the bearish candles is getting smaller, indicating that selling pressure is easing. Price is currently being held down by the descending trendline. If it breaks above the trendline successfully with strong volume, consider entering. However, the liquidity at the low marked by the circle ahead has not yet been swept, so another dip to sweep that liquidity cannot be ruled out. #Solana
{future}(SOLUSDT)
$SOL On the daily chart, SOL has made a three-wave decline, and volume on the bearish candles is getting smaller, indicating that selling pressure is easing. Price is currently being held down by the descending trendline. If it breaks above the trendline successfully with strong volume, consider entering. However, the liquidity at the low marked by the circle ahead has not yet been swept, so another dip to sweep that liquidity cannot be ruled out. #Solana
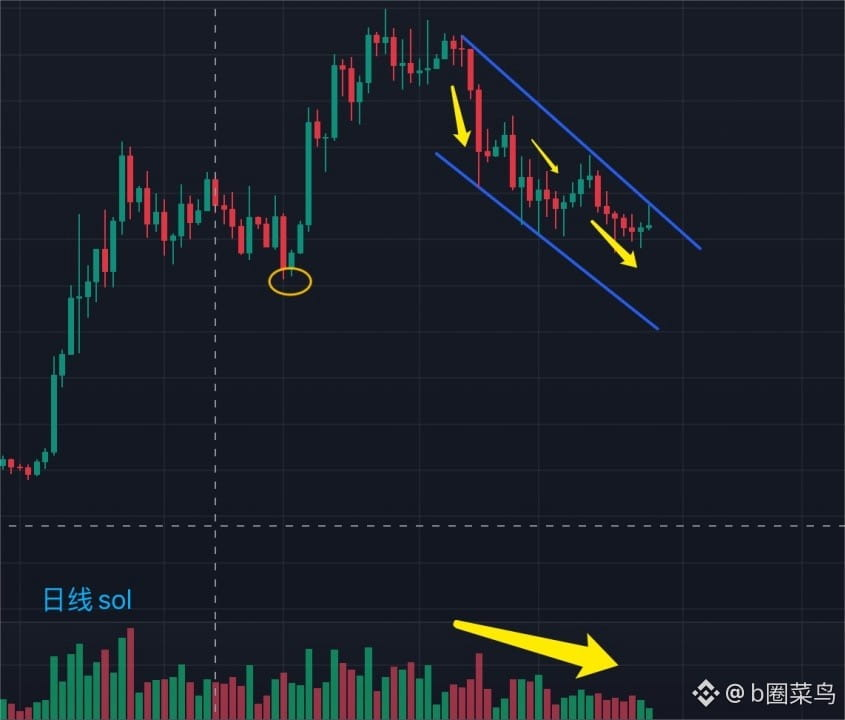
313
·
--
$BTC This week, markets warrant extra caution. Interest rate decisions and earnings reports from major tech companies are coming one after another, and remarks from the Federal Reserve, European Central Bank, and Bank of Japan could all affect market sentiment. Earnings reports from giants like Microsoft, Google, and Amazon will also test whether AI investments can truly translate into profits.
At times like this, markets can swing sharply. Good news doesn’t necessarily mean prices will rise, and bad news may already be priced in. Don’t rush to chase rallies or sell off in a panic. Manage your position size, set stop-losses, and wait for the news to come out and the direction to become clearer before acting. That’s more important than blindly betting on which way the market will go.
{future}(BTCUSDT)
$BTC This week, markets warrant extra caution. Interest rate decisions and earnings reports from major tech companies are coming one after another, and remarks from the Federal Reserve, European Central Bank, and Bank of Japan could all affect market sentiment. Earnings reports from giants like Microsoft, Google, and Amazon will also test whether AI investments can truly translate into profits.
At times like this, markets can swing sharply. Good news doesn’t necessarily mean prices will rise, and bad news may already be priced in. Don’t rush to chase rallies or sell off in a panic. Manage your position size, set stop-losses, and wait for the news to come out and the direction to become clearer before acting. That’s more important than blindly betting on which way the market will go.
At times like this, markets can swing sharply. Good news doesn’t necessarily mean prices will rise, and bad news may already be priced in. Don’t rush to chase rallies or sell off in a panic. Manage your position size, set stop-losses, and wait for the news to come out and the direction to become clearer before acting. That’s more important than blindly betting on which way the market will go.
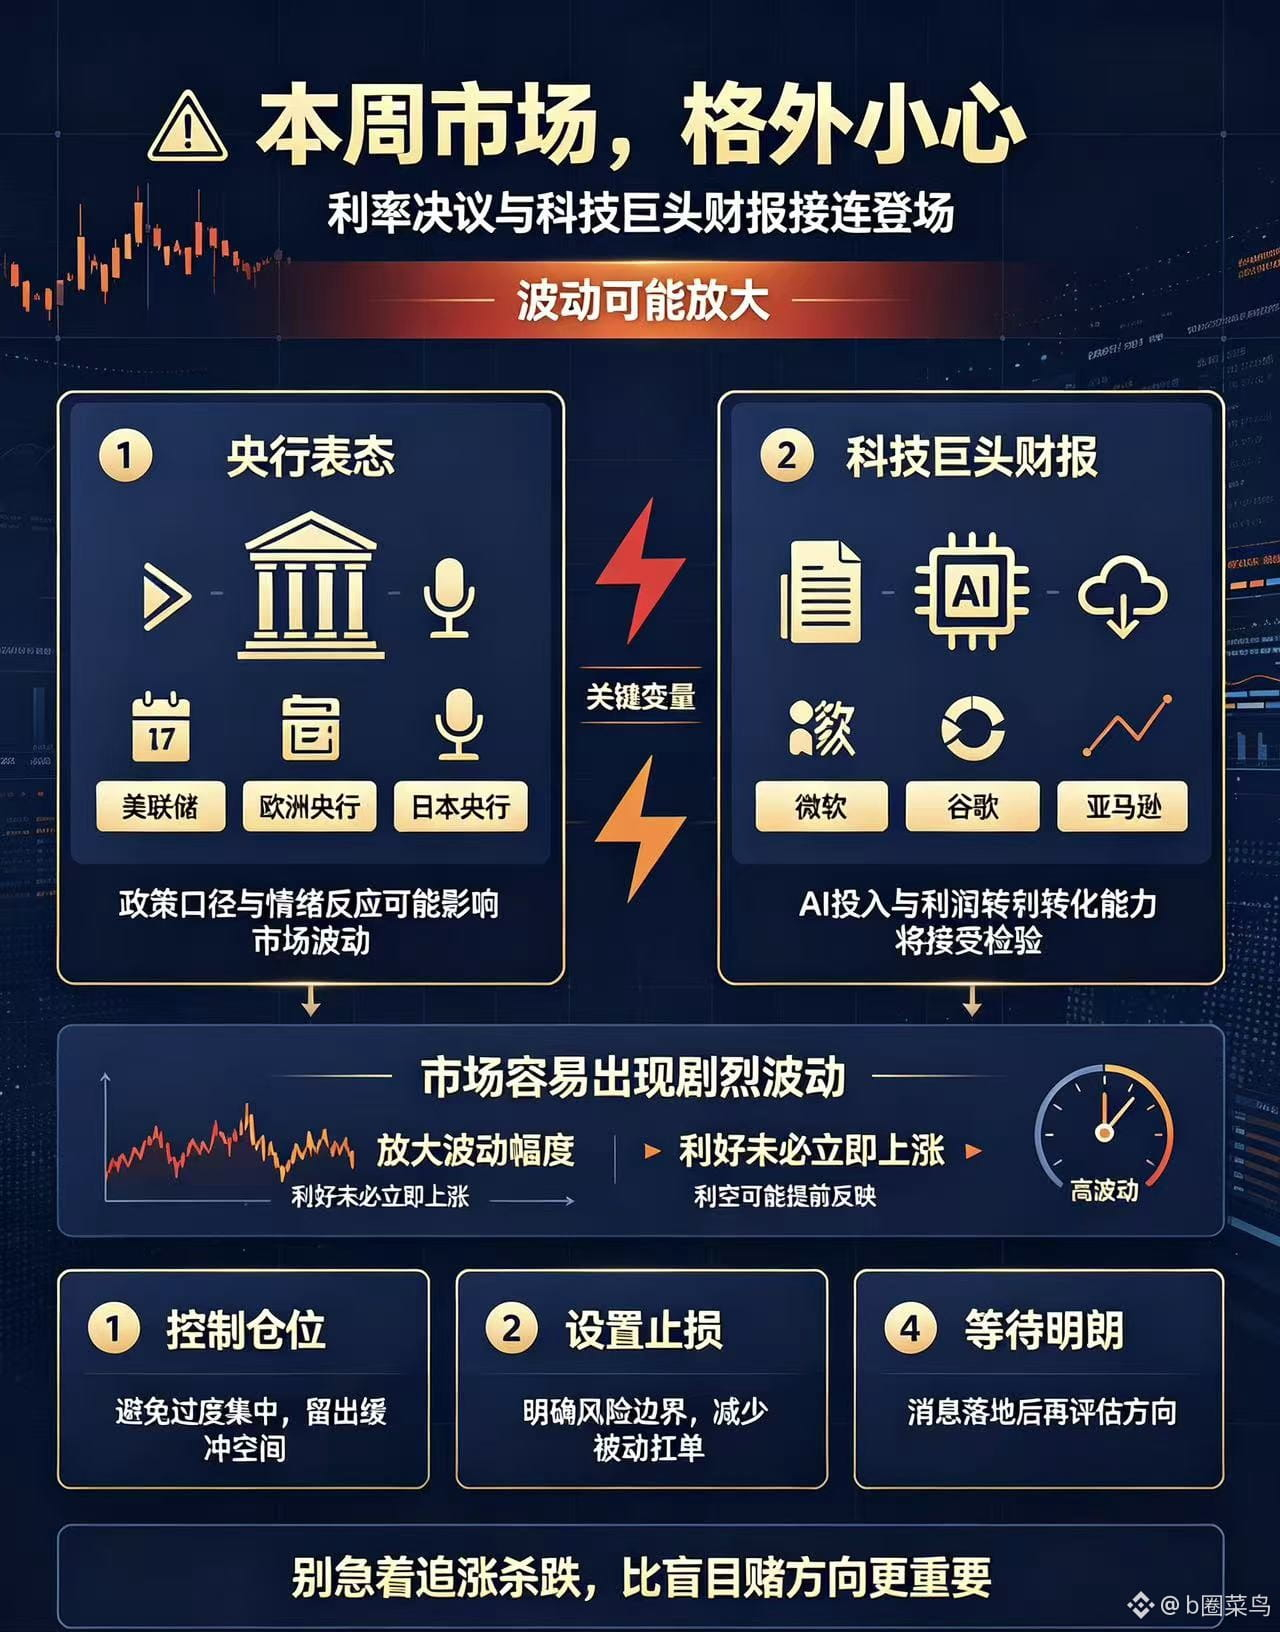
183
Log in to explore more content
Join global crypto users on Binance Square
⚡️ Get latest and useful information about crypto.
💬 Trusted by the world’s largest crypto exchange.
👍 Discover real insights from verified creators.
Email / Phone number
Trending Topics
NvidiaInvestigatesAfterHuang’sAffairApology
195,134 views
1,661 Discussing
Nvidia Board Opens Probe Into Whether Huang Was Target of Foreign Intelligence Effort
Binance News
·21 Likes
·54.8k views
BitcoinFiveWeeklyLosses
220,736 views
2,123 Discussing
AIChipSlumpNasdaq
119,637 views
1,310 Discussing