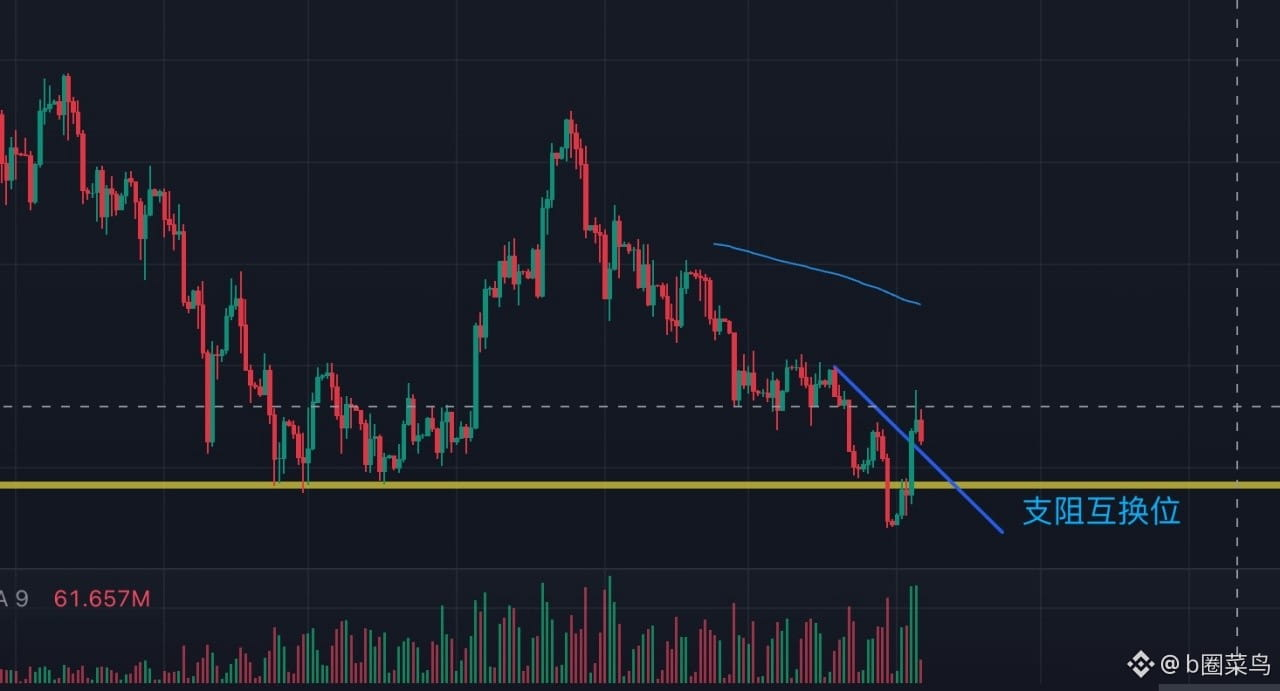
Gold Daily Chart
The yellow horizontal line marks the most important support-resistance flip level on the gold daily chart. Previously, prices found support here several times, indicating that buying pressure had built up in this area. However, after recently breaking below it on heavy volume, the former support may turn into new resistance. Although prices have rebounded sharply and climbed back above the yellow zone, it remains to be confirmed whether they can hold above it. If a subsequent pullback holds above the yellow level, the support-resistance flip may be complete, giving prices fresh momentum to move higher. Conversely, if the rebound lacks strength and prices fall below the yellow line again, this recovery may prove to be only a brief false breakout, and a second test of lower levels should still be watched for. The key is not whether prices can get above the level, but whether they can stay above it. #黄金
The yellow horizontal line marks the most important support-resistance flip level on the gold daily chart. Previously, prices found support here several times, indicating that buying pressure had built up in this area. However, after recently breaking below it on heavy volume, the former support may turn into new resistance. Although prices have rebounded sharply and climbed back above the yellow zone, it remains to be confirmed whether they can hold above it. If a subsequent pullback holds above the yellow level, the support-resistance flip may be complete, giving prices fresh momentum to move higher. Conversely, if the rebound lacks strength and prices fall below the yellow line again, this recovery may prove to be only a brief false breakout, and a second test of lower levels should still be watched for. The key is not whether prices can get above the level, but whether they can stay above it. #黄金