

Huutruong
10.3k Posts

Huutruong
Report
Block User
💰 Theo dõi Crypto | Tìm kiếm cơ hội mỗi ngày ( KITE-277880 )
Open Trade
Frequent Trader
5.5 Years
3.6K+ Following
2.4K+ Followers
846 Liked
Posts
Portfolio
All
Quotes
Videos
Live
·
--
Bearish
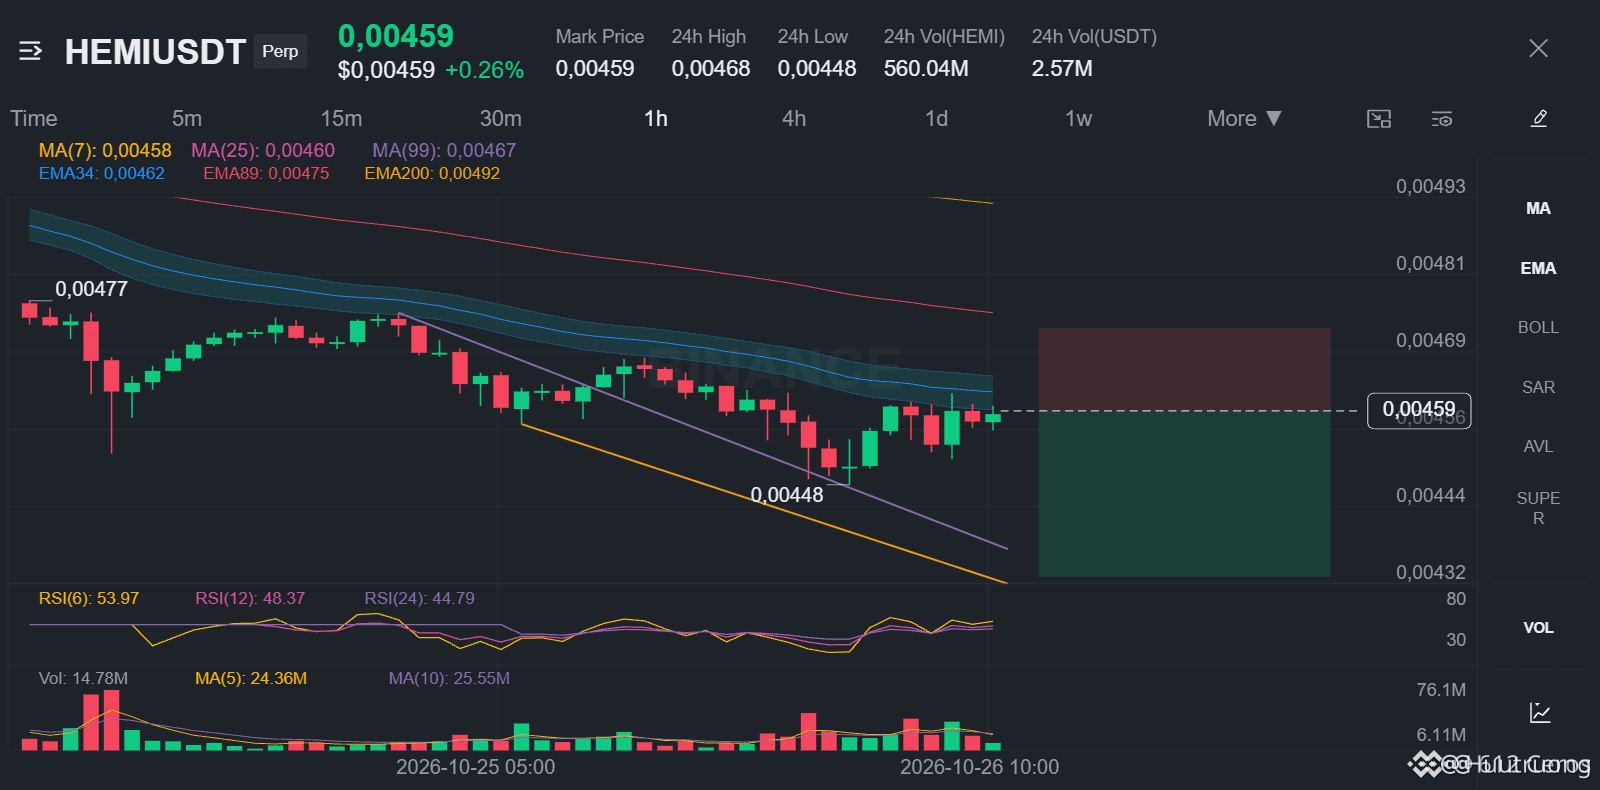
HEMI keeps stacking bearish candles on every trend
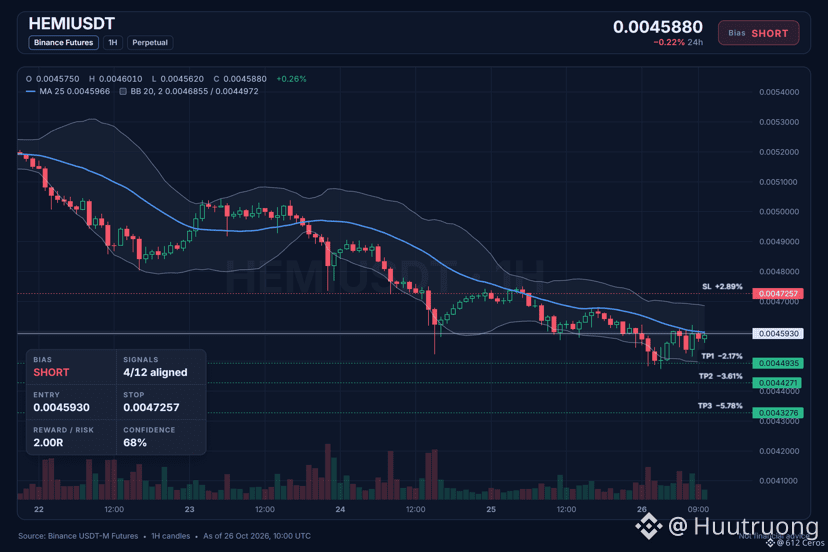
🔴 SHORT $HEMI /USDT: expecting price to go DOWN
Bias: SHORT · Leaning
Entry: 0.0045866 – 0.0045994
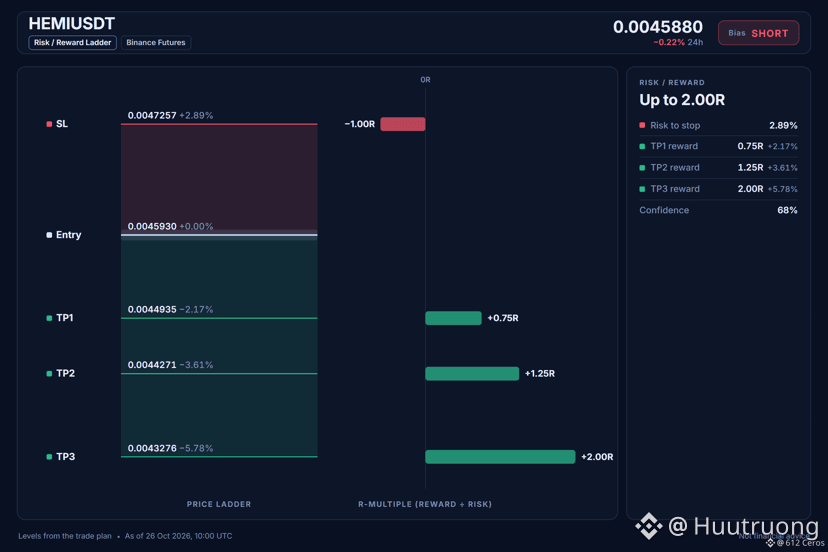
TP1: 0.0044935 (-2.2%)
TP2: 0.0044271 (-3.6%)
TP3: 0.0043276 (-5.8%)
SL: 0.0047257 (+2.9%)
Plan: enter only inside the zone, close 50% at TP1, 25% at TP2, 25% at TP3, and move the stop to entry after TP1.
Note: moderate conviction only, keep size light.
Why SHORT? 4/12 signals agree, 0 against.
• Daily trend down (below EMA50 & EMA200)
• 4h trend down (below EMA50 & EMA200)
• 1h trend down (below EMA50 & EMA200)
Q: Why short when the 1h RSI is neutral?
A: The 1h RSI at 47.1 shows momentum is undecided, so the short relies on the daily and 4h bearish stacks.
Q: When is this trade wrong if the daily trend flips?
A: The daily trend is bearish with price below EMA50 and EMA200, so a break above that stack invalidates the setup.
What is your HEMI level or counter-argument?
{spot}(HEMIUSDT)
HEMI keeps stacking bearish candles on every trend
🔴 SHORT $HEMI /USDT: expecting price to go DOWN
Bias: SHORT · Leaning
Entry: 0.0045866 – 0.0045994
TP1: 0.0044935 (-2.2%)
TP2: 0.0044271 (-3.6%)
TP3: 0.0043276 (-5.8%)
SL: 0.0047257 (+2.9%)
Plan: enter only inside the zone, close 50% at TP1, 25% at TP2, 25% at TP3, and move the stop to entry after TP1.
Note: moderate conviction only, keep size light.
Why SHORT? 4/12 signals agree, 0 against.
• Daily trend down (below EMA50 & EMA200)
• 4h trend down (below EMA50 & EMA200)
• 1h trend down (below EMA50 & EMA200)
Q: Why short when the 1h RSI is neutral?
A: The 1h RSI at 47.1 shows momentum is undecided, so the short relies on the daily and 4h bearish stacks.
Q: When is this trade wrong if the daily trend flips?
A: The daily trend is bearish with price below EMA50 and EMA200, so a break above that stack invalidates the setup.
What is your HEMI level or counter-argument?
1
·
--
Bearish
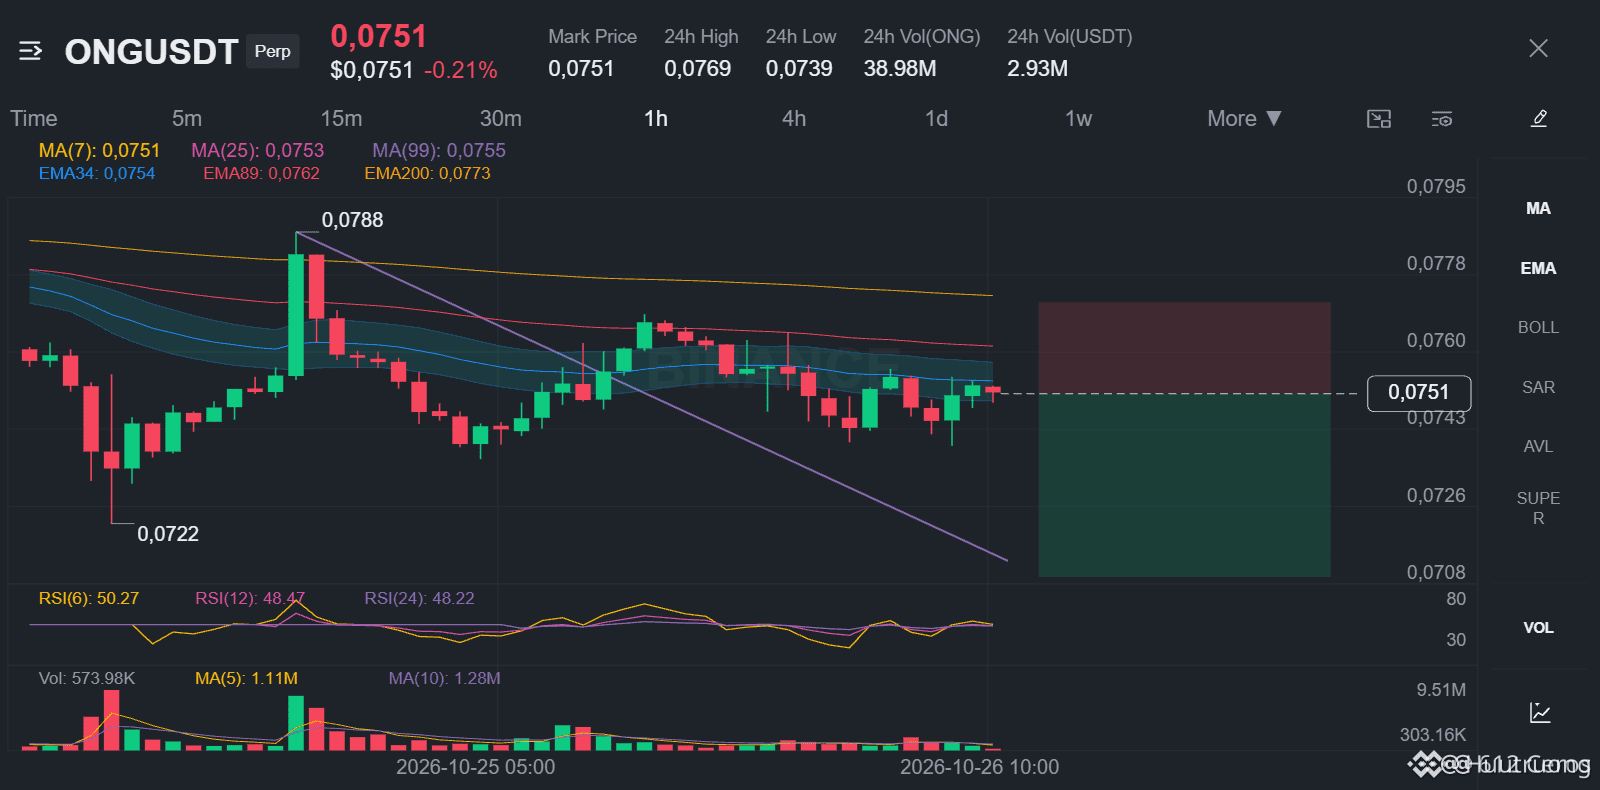
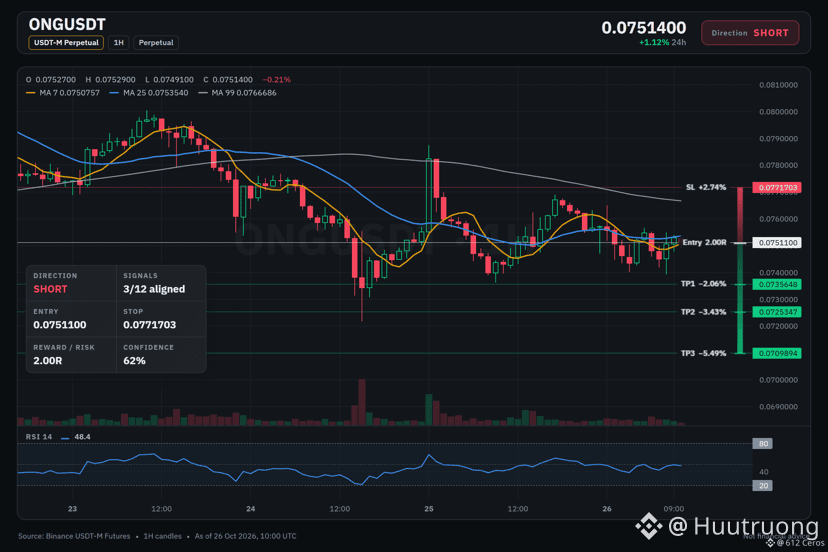
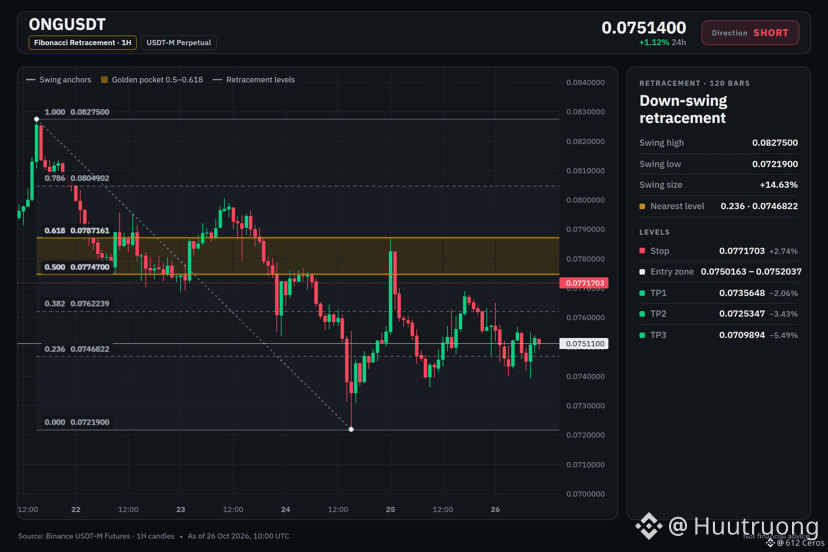
ONG keeps selling below EMA50.
🔴 SHORT $ONG /USDT: expecting price to go DOWN
Bias: SHORT · Leaning
Entry: 0.0750163 – 0.0752037
TP1: 0.0735648 (-2.1%)
TP2: 0.0725347 (-3.4%)
TP3: 0.0709894 (-5.5%)
SL: 0.0771703 (+2.7%)
Plan: enter only inside the zone, close 50% at TP1, 25% at TP2, 25% at TP3, and move the stop to entry after TP1.
Note: moderate conviction only, keep size light.
Why SHORT? ONG checklist: 3/12 agree, 0 against.
• 4h trend down (below EMA50 & EMA200)
• 1h trend down (below EMA50 & EMA200)
• Sellers have the momentum (4h RSI 41.6)
Watch: The idea is wrong if price reaches the stop at 0.0771703
Bottom line: The 4h trend is down with price below EMA50 and EMA200, which means the swing is bearish. The 1h trend is also down, and 4h RSI is below 45, showing sellers have momentum. However, conviction is moderate because some factors disagree.
Do you see a better short level?
{spot}(ONGUSDT)
ONG keeps selling below EMA50.
🔴 SHORT $ONG /USDT: expecting price to go DOWN
Bias: SHORT · Leaning
Entry: 0.0750163 – 0.0752037
TP1: 0.0735648 (-2.1%)
TP2: 0.0725347 (-3.4%)
TP3: 0.0709894 (-5.5%)
SL: 0.0771703 (+2.7%)
Plan: enter only inside the zone, close 50% at TP1, 25% at TP2, 25% at TP3, and move the stop to entry after TP1.
Note: moderate conviction only, keep size light.
Why SHORT? ONG checklist: 3/12 agree, 0 against.
• 4h trend down (below EMA50 & EMA200)
• 1h trend down (below EMA50 & EMA200)
• Sellers have the momentum (4h RSI 41.6)
Watch: The idea is wrong if price reaches the stop at 0.0771703
Bottom line: The 4h trend is down with price below EMA50 and EMA200, which means the swing is bearish. The 1h trend is also down, and 4h RSI is below 45, showing sellers have momentum. However, conviction is moderate because some factors disagree.
Do you see a better short level?
3
·
--
Bearish
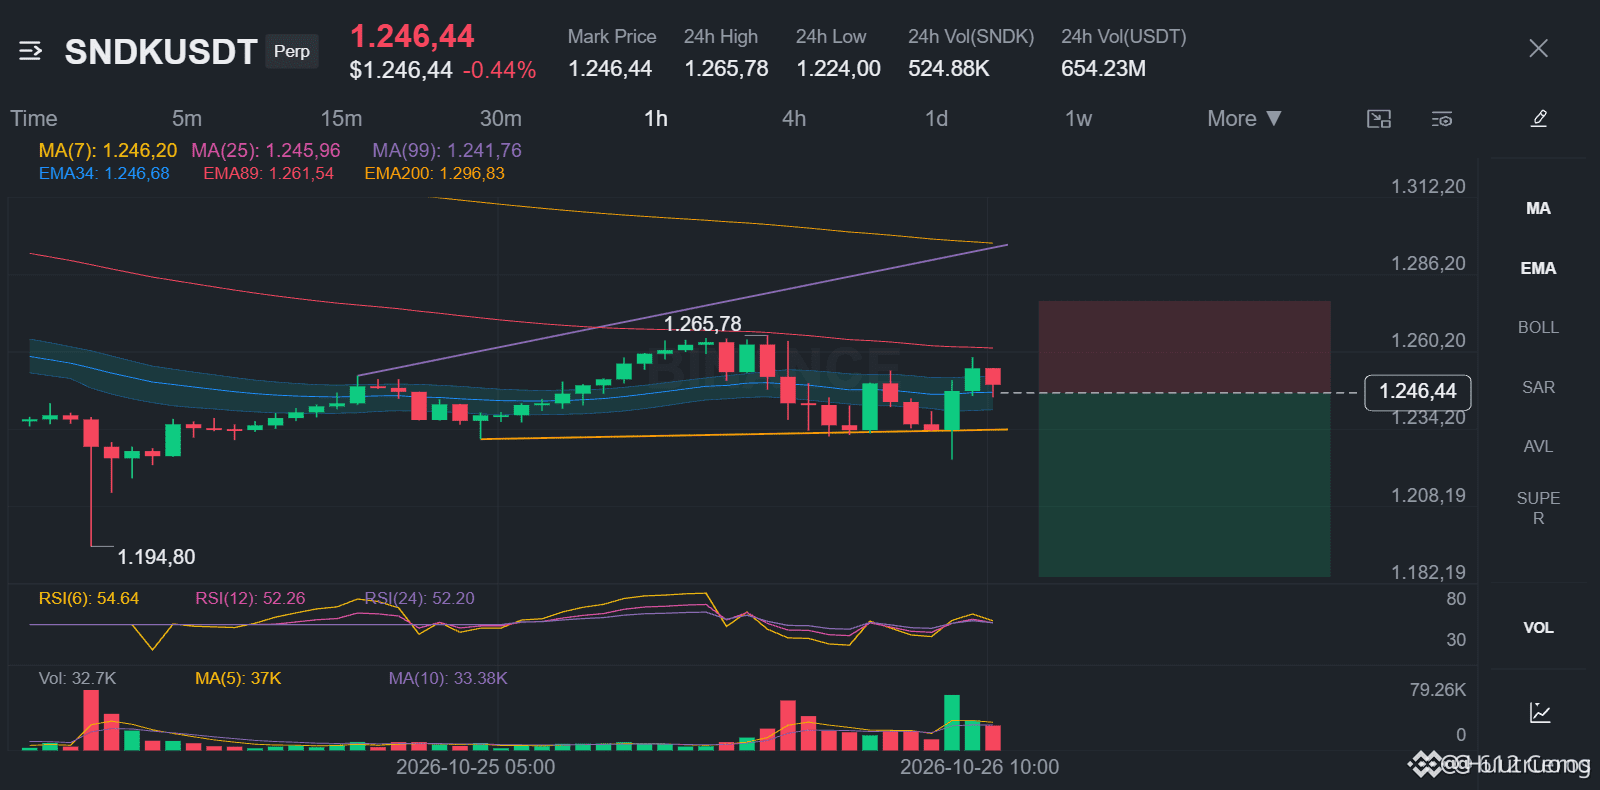
SNDK looks weak, but I need to see more proof.
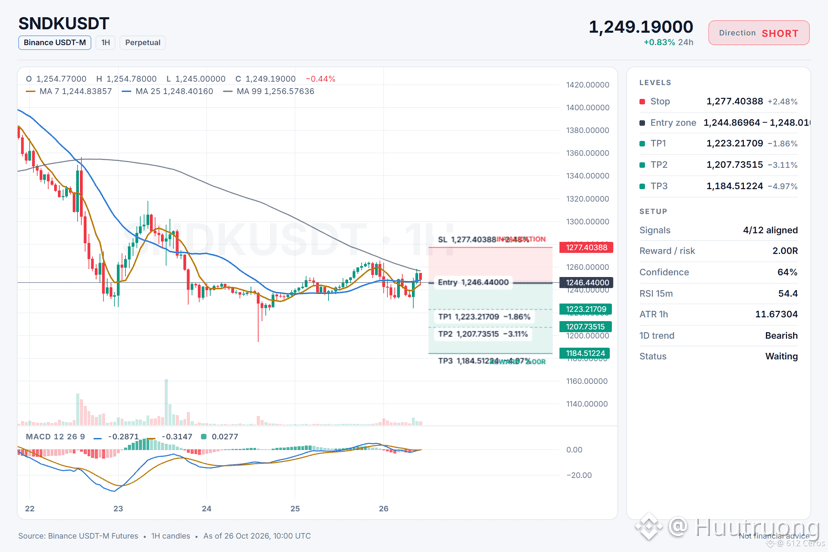
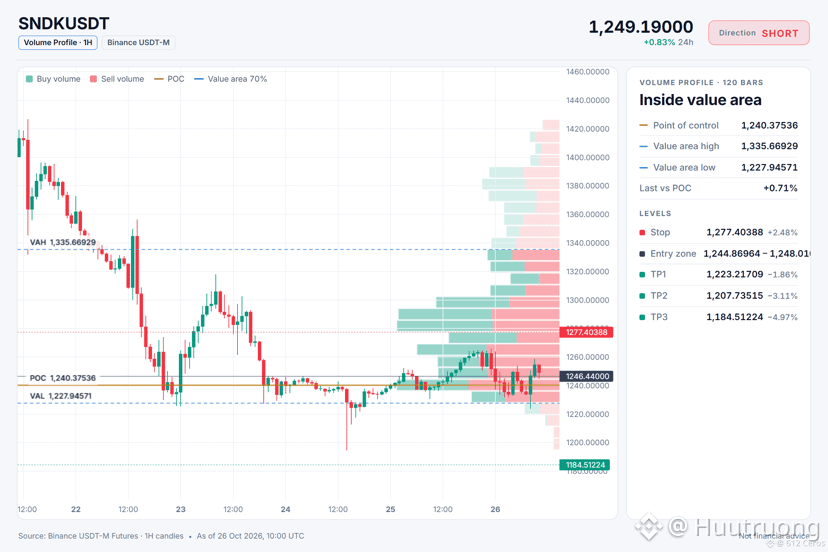
🔴 SHORT $SNDK /USDT: expecting price to go DOWN
Bias: SHORT · Leaning
Entry: 1244.86964 – 1248.01036
TP1: 1223.21709 (-1.9%)
TP2: 1207.73515 (-3.1%)
TP3: 1184.51224 (-5.0%)
SL: 1277.40388 (+2.5%)
Plan: enter only inside the zone, close 50% at TP1, 25% at TP2, 25% at TP3, and move the stop to entry after TP1.
Note: moderate conviction only, keep size light.
Why SHORT? 4/12 signals agree, 1 against.
• Daily trend down (below EMA50 & EMA200)
• 4h trend down (below EMA50 & EMA200)
• 1h trend down (below EMA50 & EMA200)
Risk: BTC is rising, this coin follows (corr 0.62)
Journal note: SNDK
I'm watching SNDK for a short trade. The daily trend is bearish and the 4h trend is bearish too, which means the big and swing picture are both down. I want to see price hold below the 1h EMA50, currently 1246.44, before I take it.
Where would you set your invalidation level?
4
·
--
Bearish
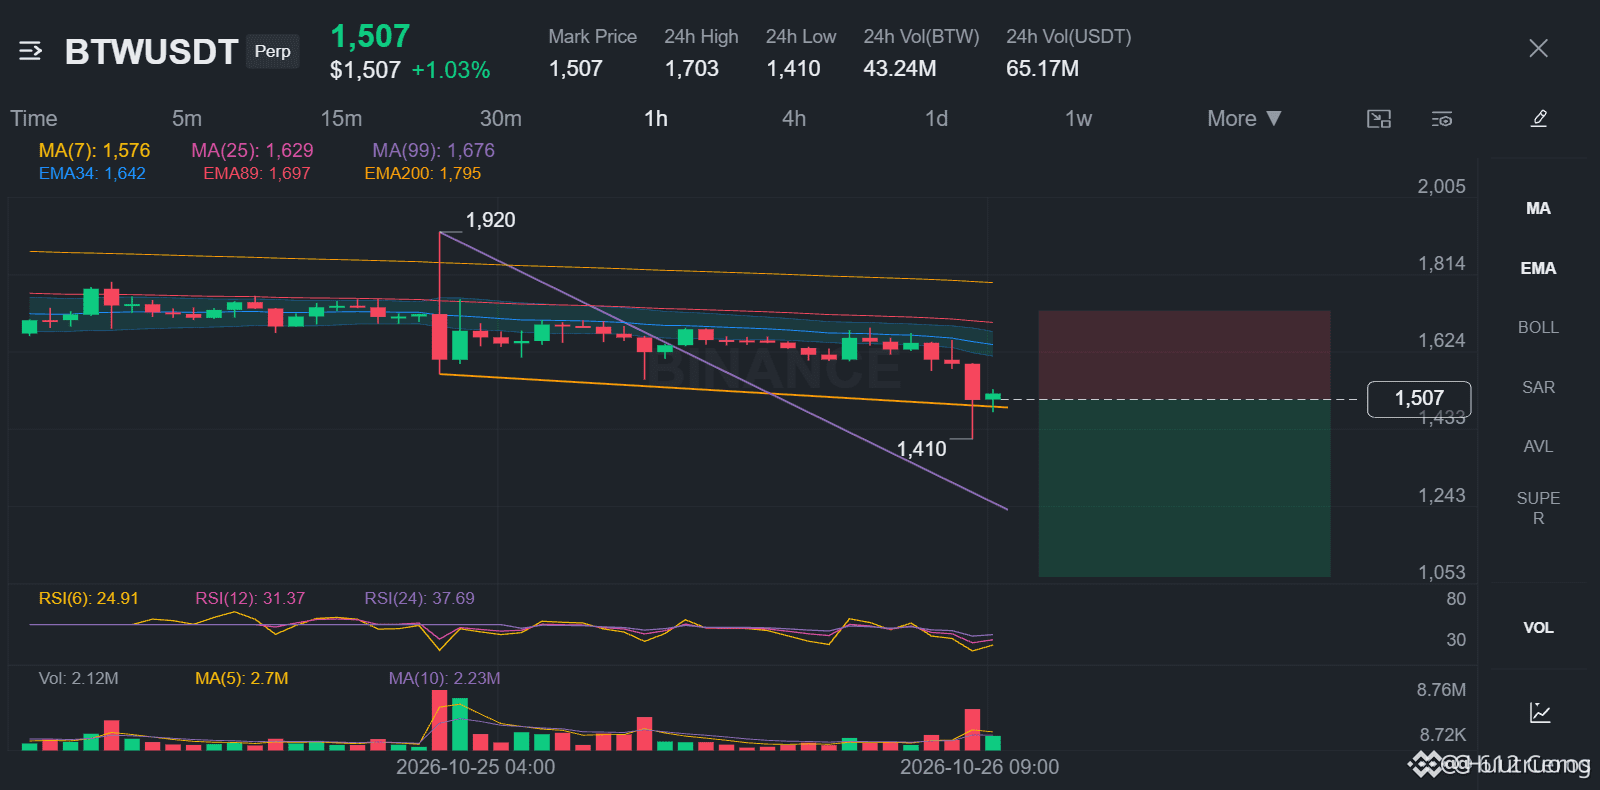
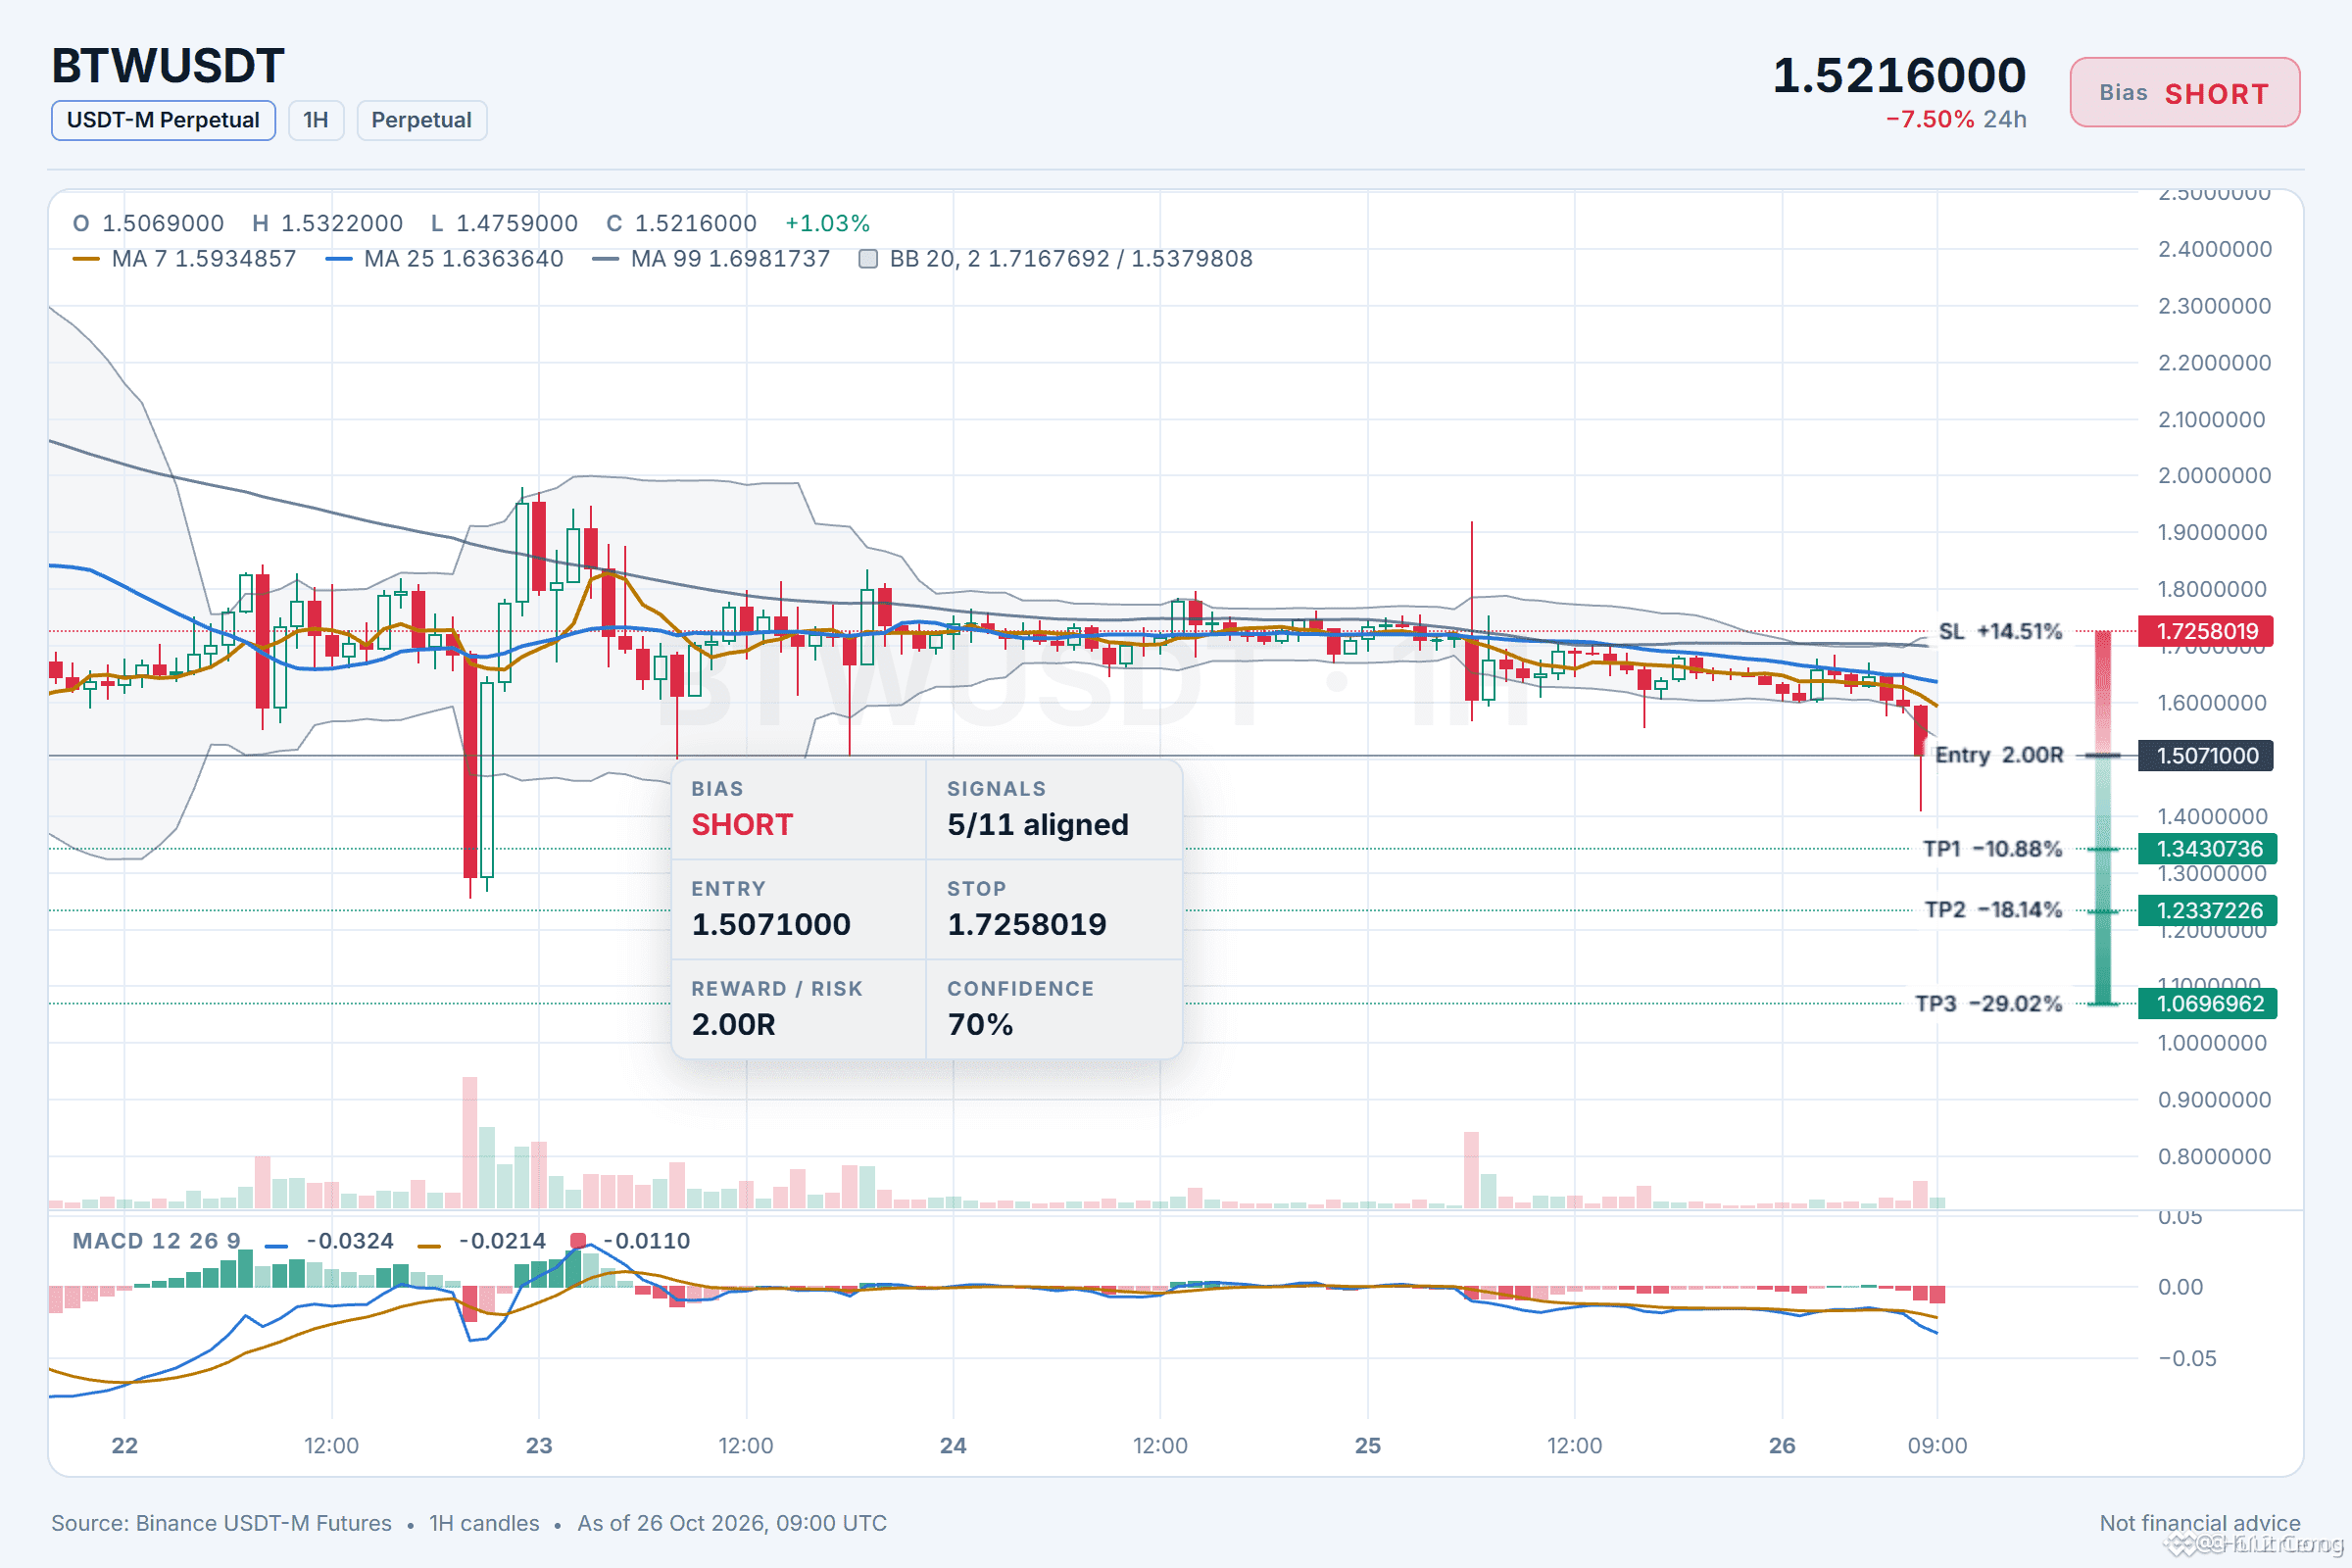
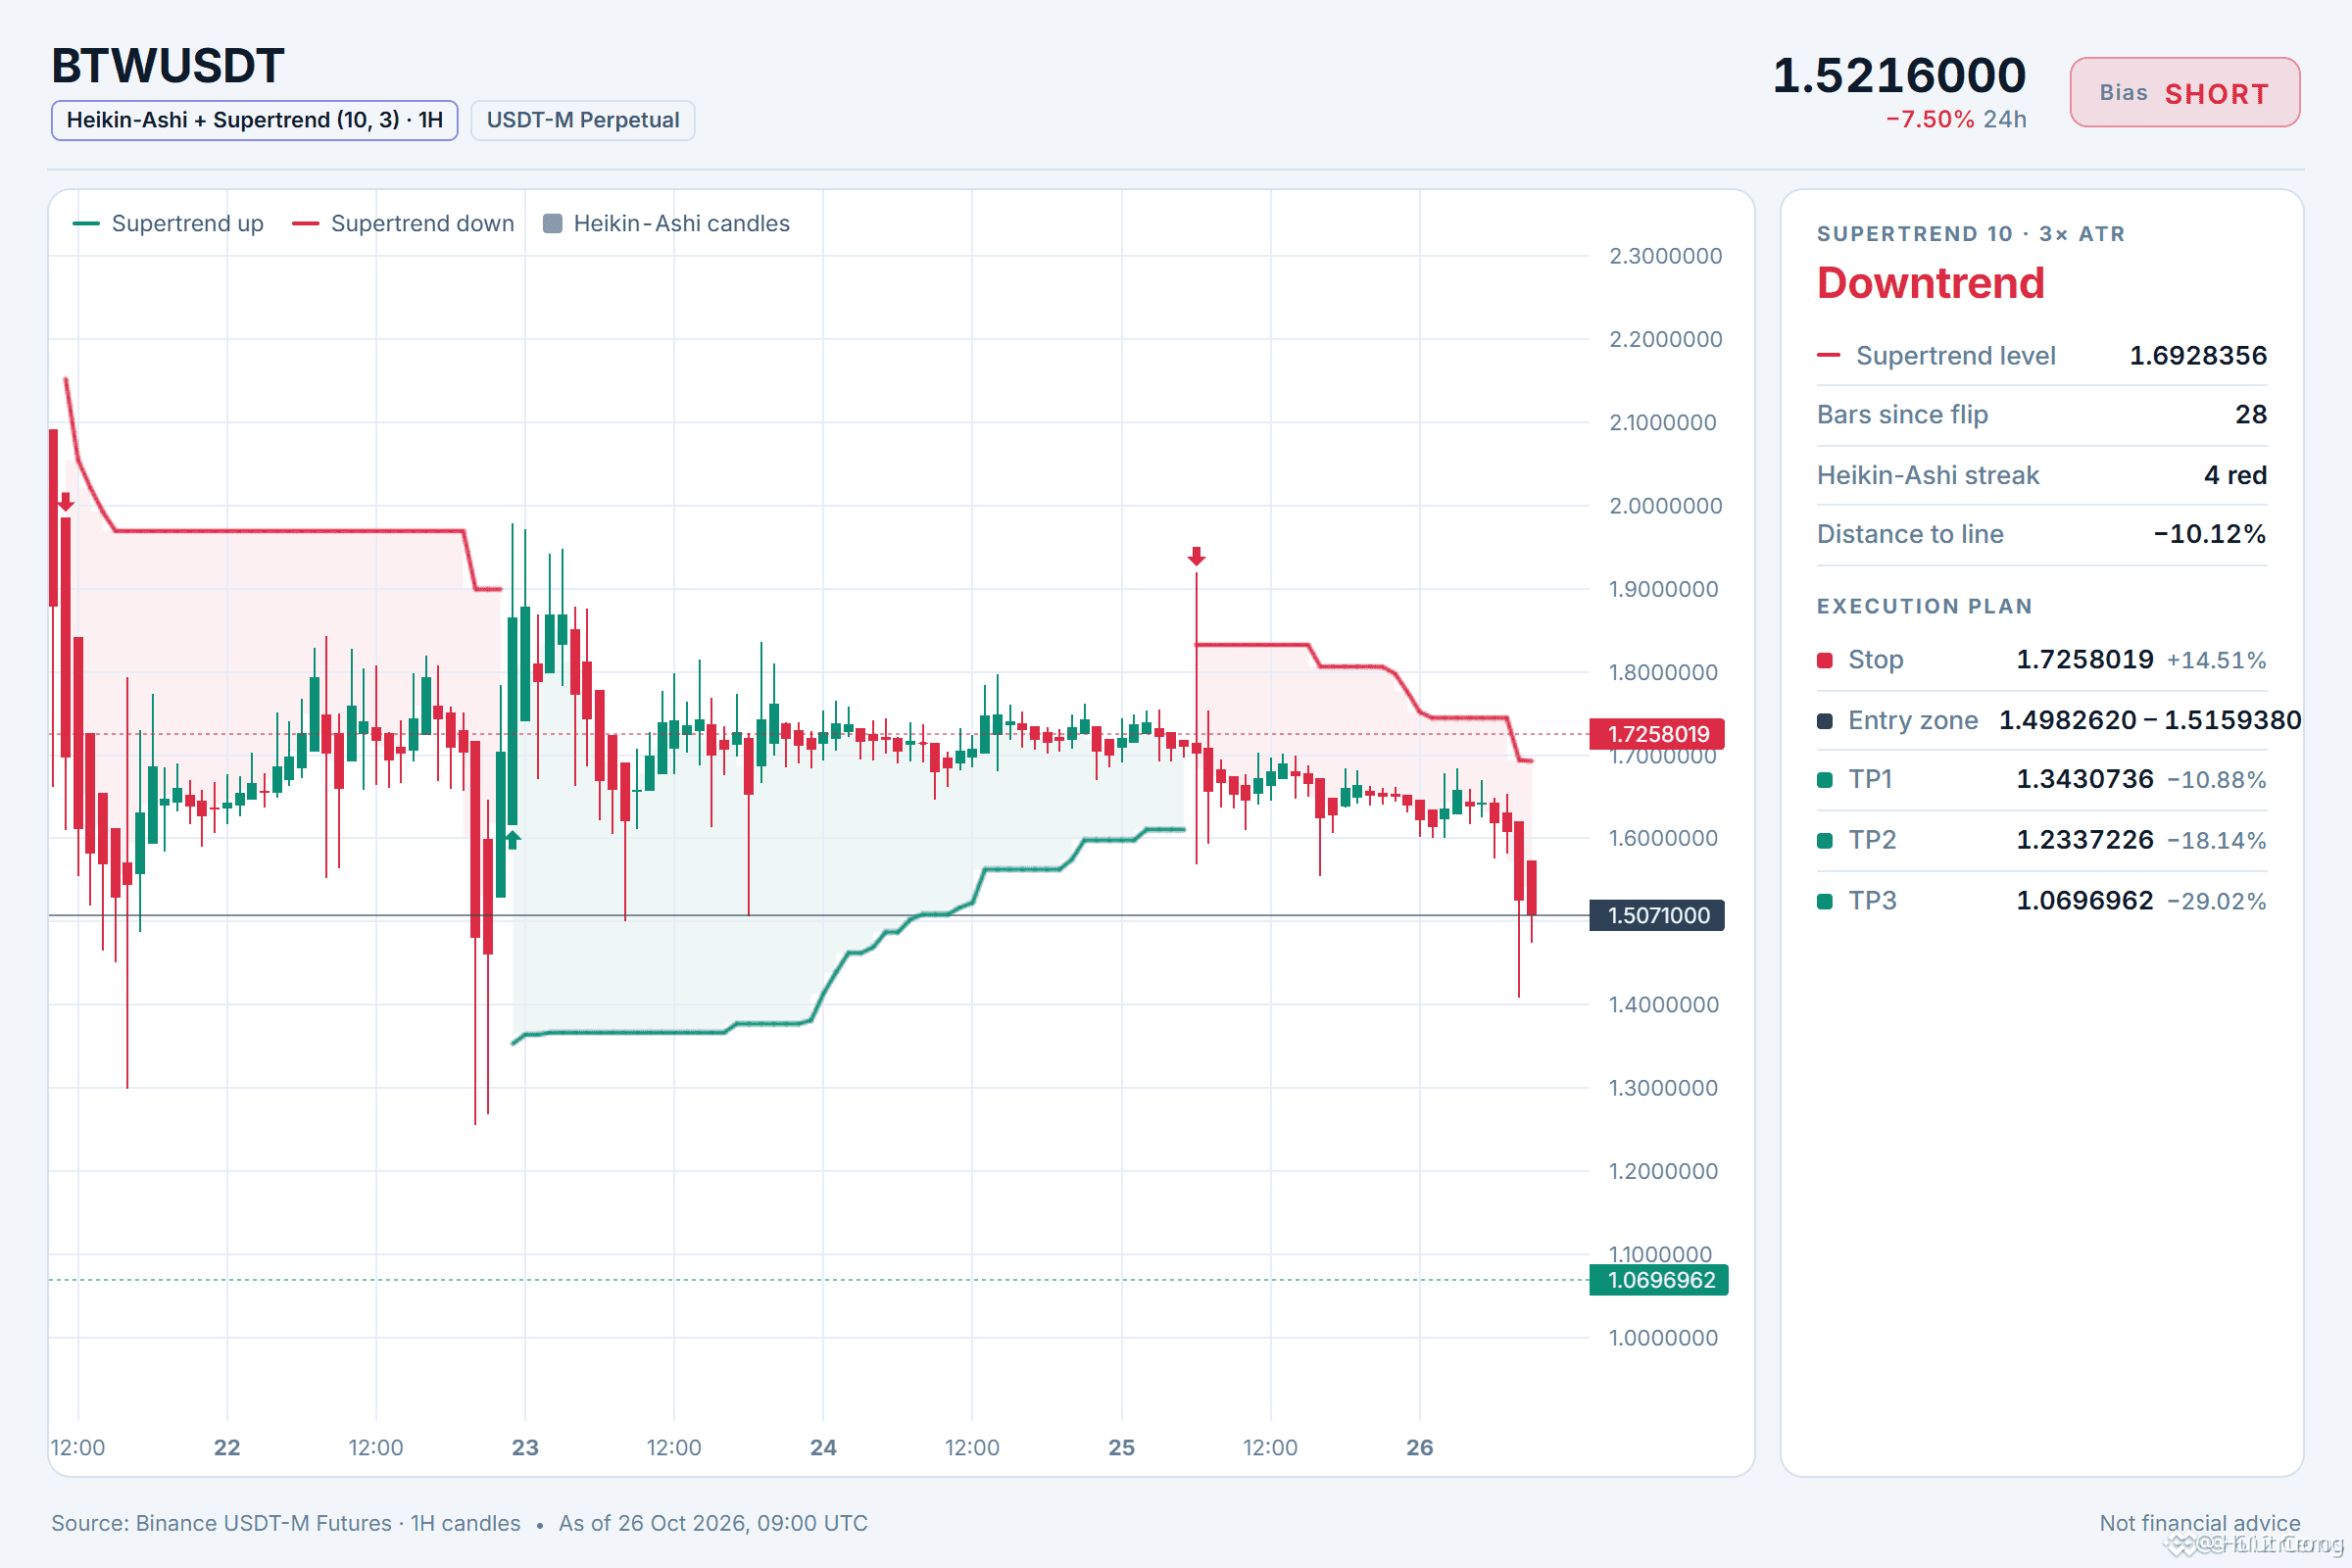
🔴 SHORT $BTW /USDT: expecting price to go DOWN
Bias: SHORT · Leaning
Entry: 1.4982620 – 1.5159380
TP1: 1.3430736 (-10.9%)
TP2: 1.2337226 (-18.1%)
TP3: 1.0696962 (-29.0%)
SL: 1.7258019 (+14.5%)
Plan: enter only inside the zone, close 50% at TP1, 25% at TP2, 25% at TP3, and move the stop to entry after TP1.
Note: moderate conviction only, keep size light.
1h price under EMA50 and EMA200
Why SHORT? 5/11 signals agree, 0 against.
• 1h trend down (below EMA50 & EMA200)
• Sellers are driving the move (15m ADX 35.0)
• Sellers have the momentum (4h RSI 41.4)
1h RSI sits at 33, meaning sellers have clear momentum. Entry is around 1.5071000, and the invalidation sits at 1.7258019.
What is your invalidation level for this short?
7
·
--
Bullish
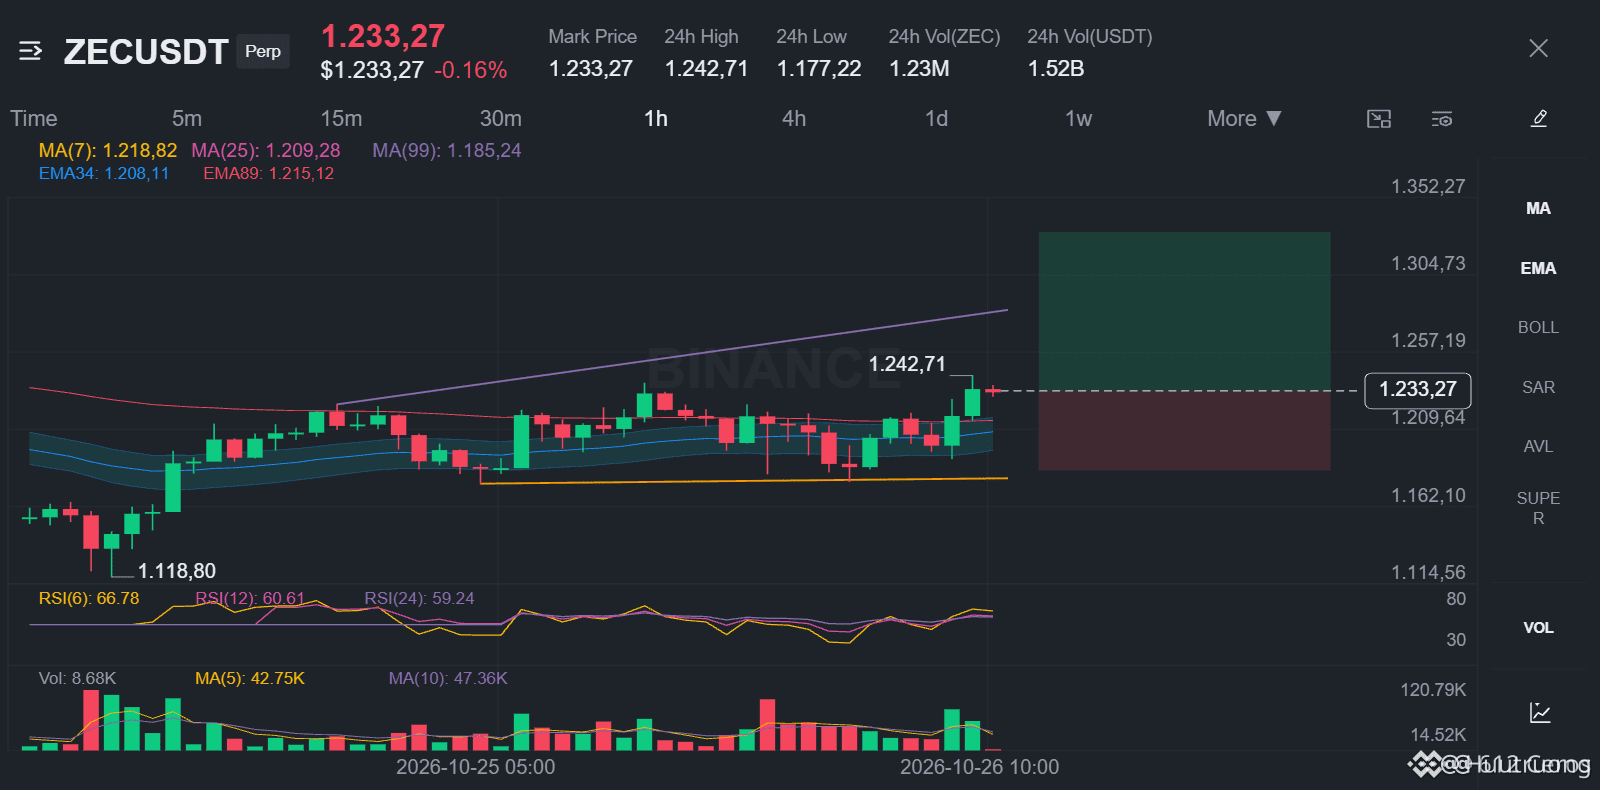
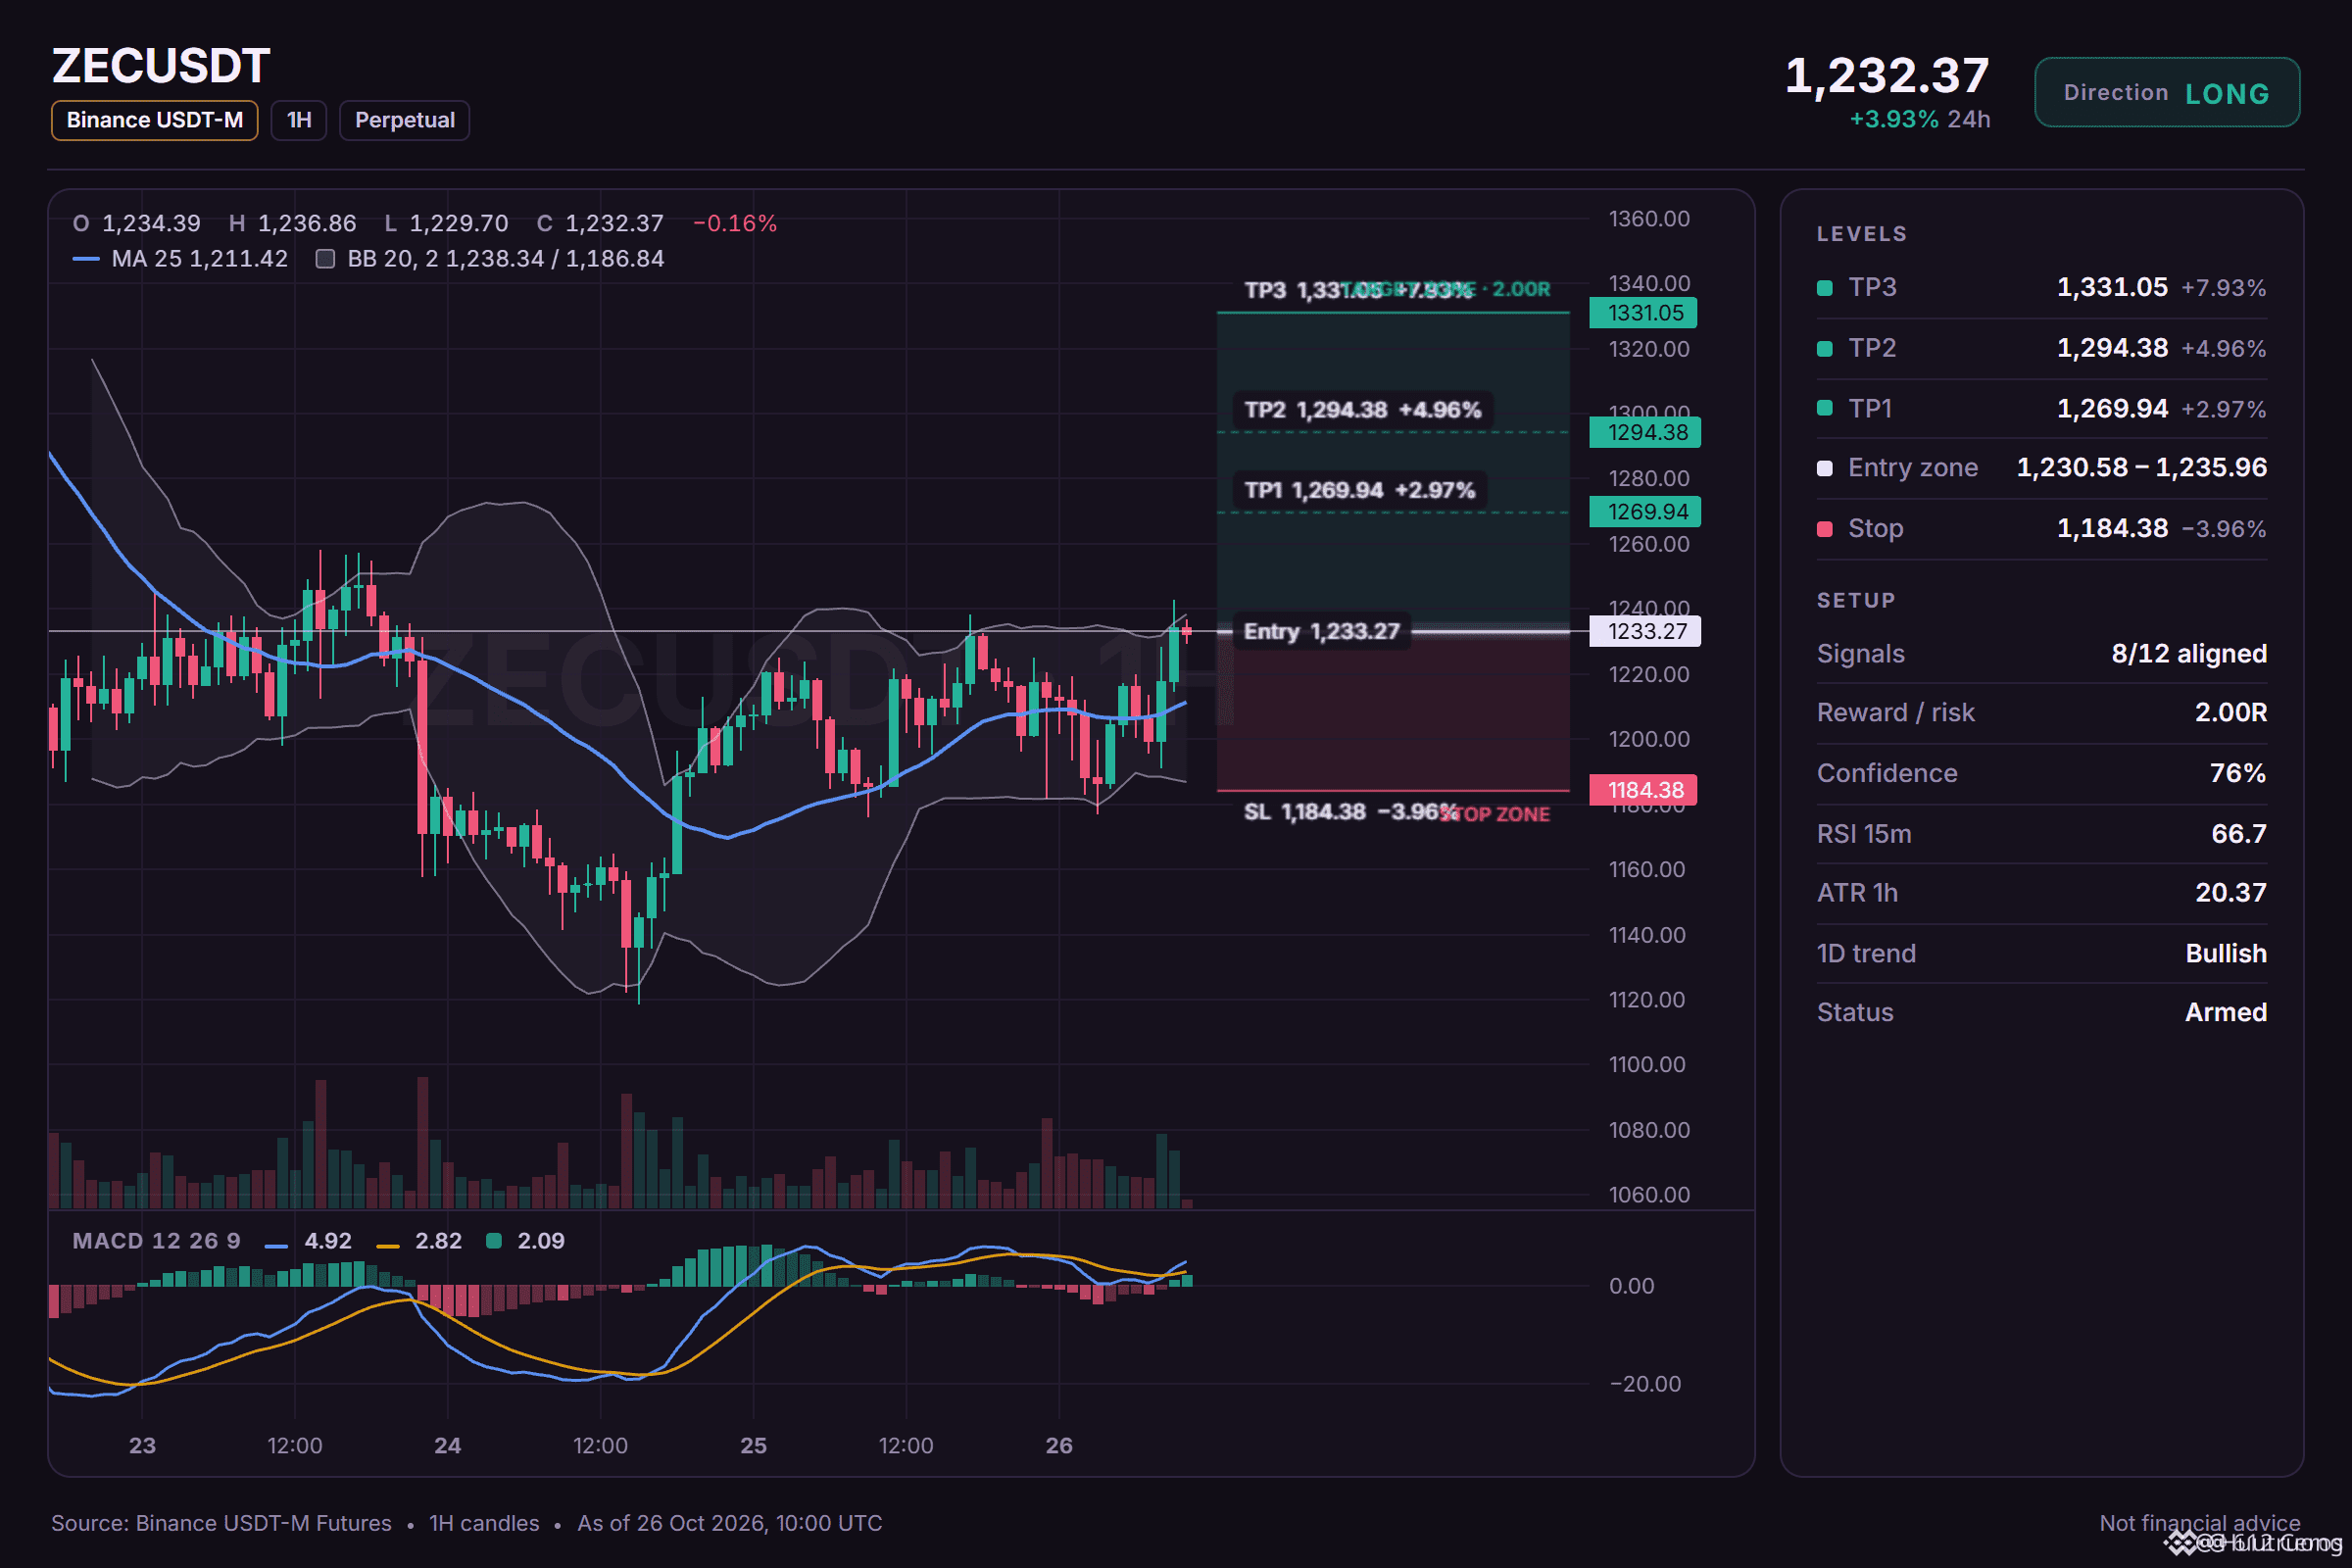
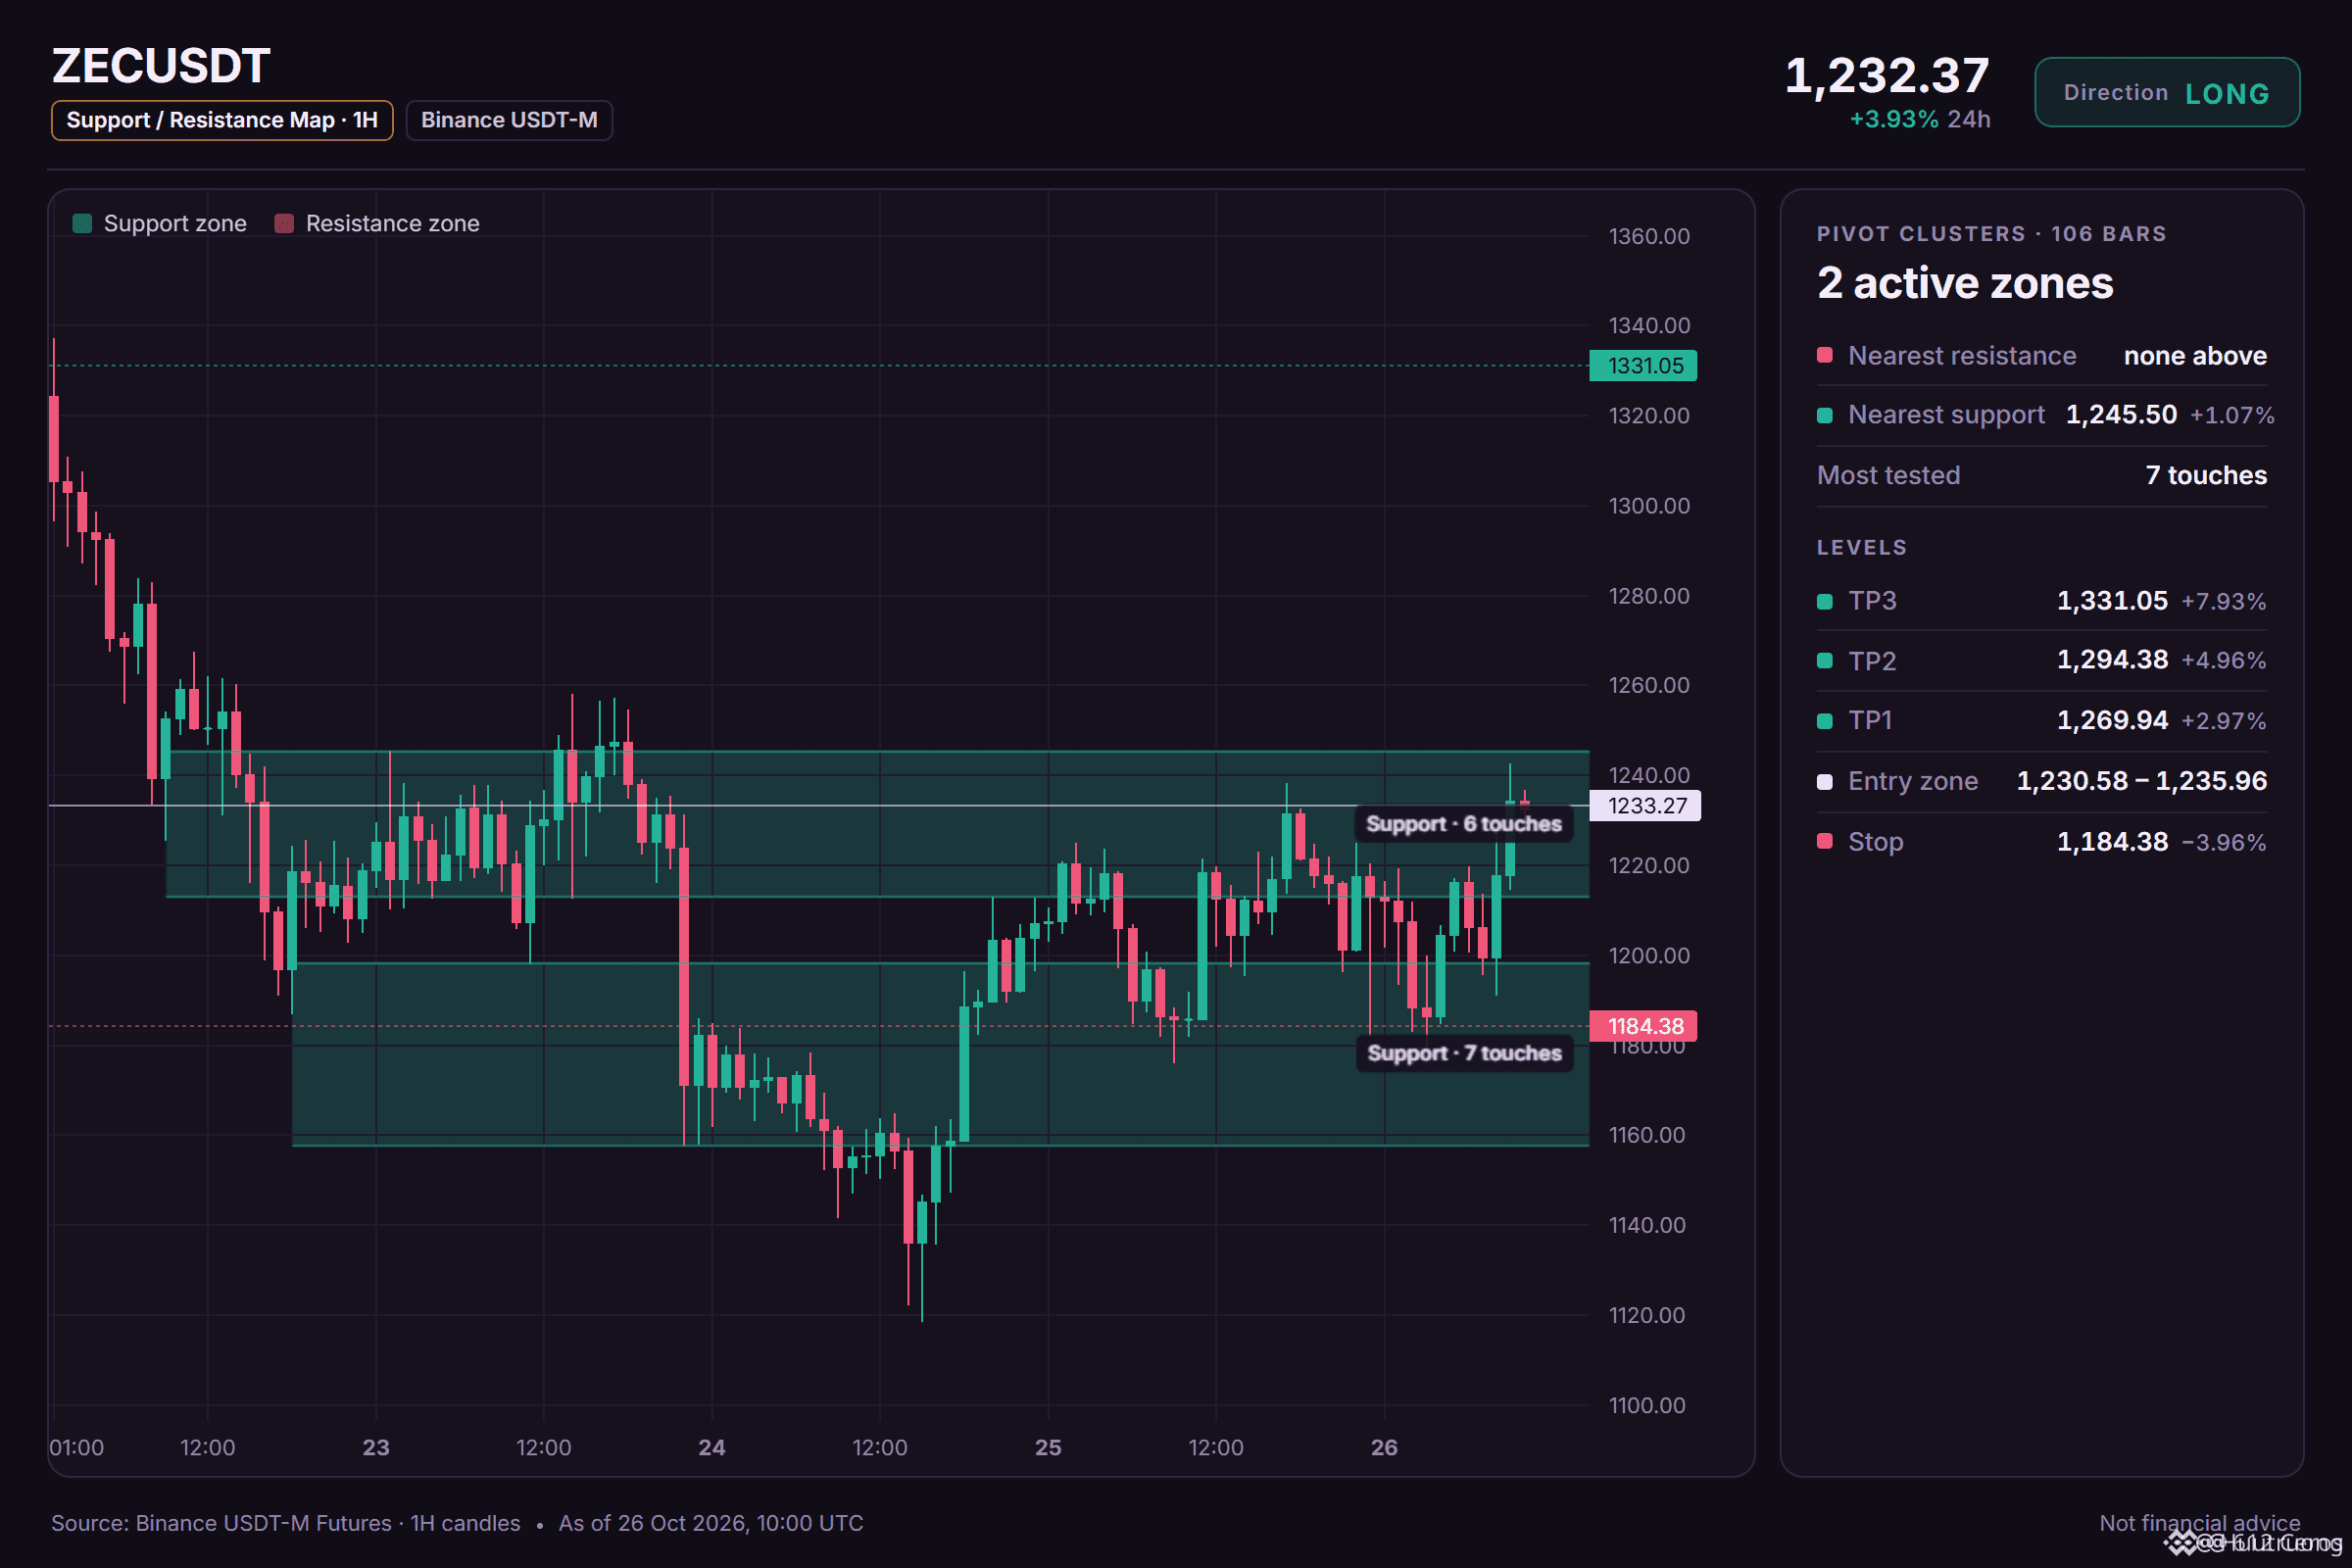
ZEC long setup: the levels I'm watching
🟢 LONG $ZEC /USDT: expecting price to go UP
Bias: LONG · Strong
Entry: 1230.58 – 1235.96
TP1: 1269.94 (+3.0%)
TP2: 1294.38 (+5.0%)
TP3: 1331.05 (+7.9%)
SL: 1184.38 (-4.0%)
Plan: enter only inside the zone, close 50% at TP1, 25% at TP2, 25% at TP3, and move the stop to entry after TP1.
Why LONG? 8/12 signals agree, 1 against.
• Daily trend up (above EMA50 & EMA200)
• 1h trend up (above EMA50 & EMA200)
• BTC is rising, this coin follows (corr 0.82)
Risk: Range top, sellers often step in (RSI z +2.01)
Why I like it:
The daily trend reads bullish, and 8/12 signals aligned favour the long side. The plan is to work the 1230.58 – 1235.96 zone, scale out at 1269.94 and 1294.38, and stay patient for 1331.05. A move through 1184.38 means the idea is wrong and the stop does its job.
Does tag 1269.94 first, or the stop?
6
·
--
Bullish
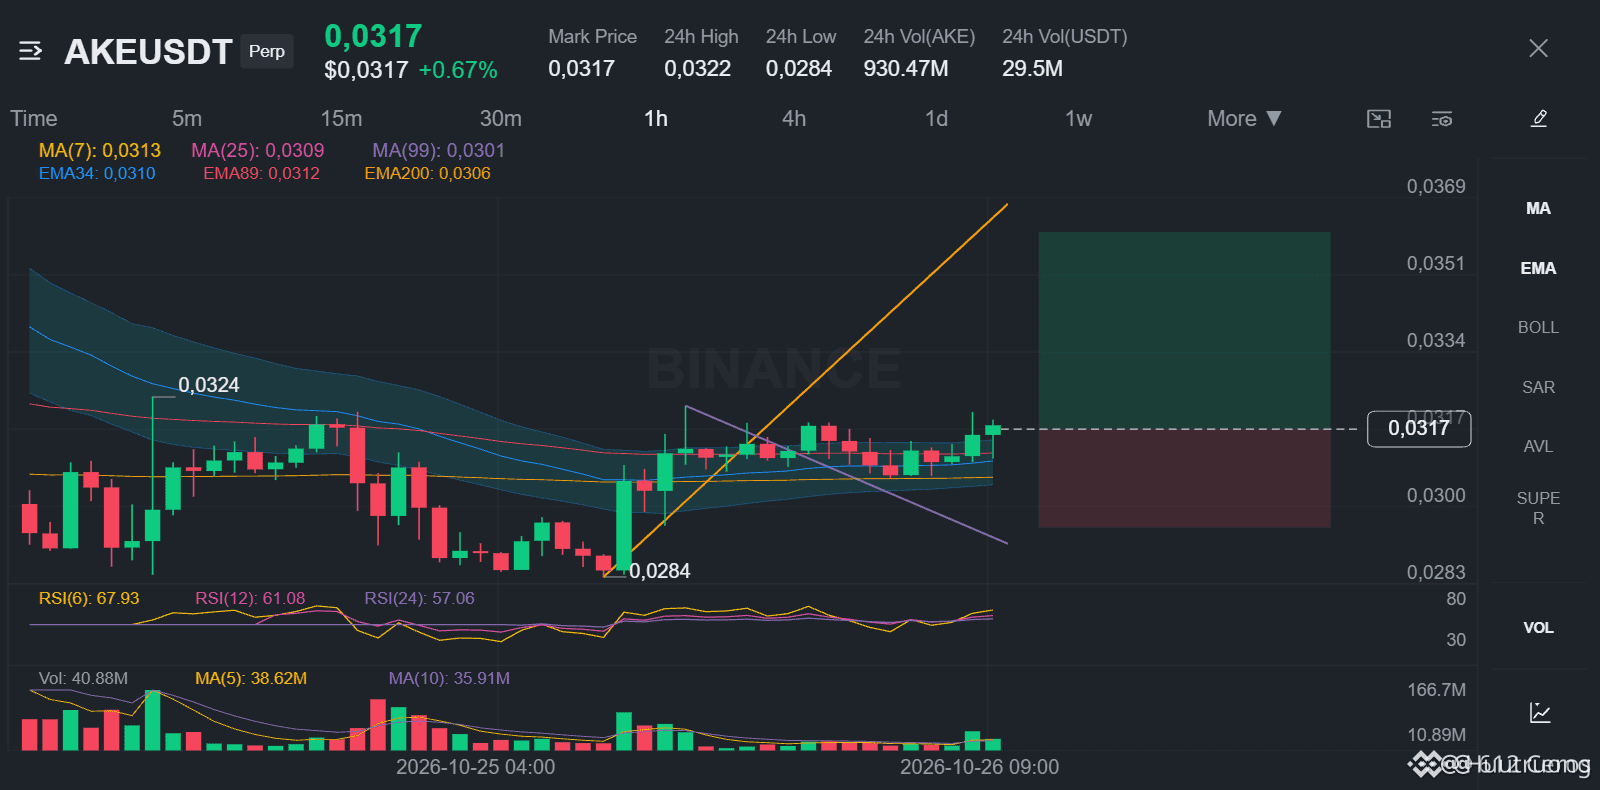
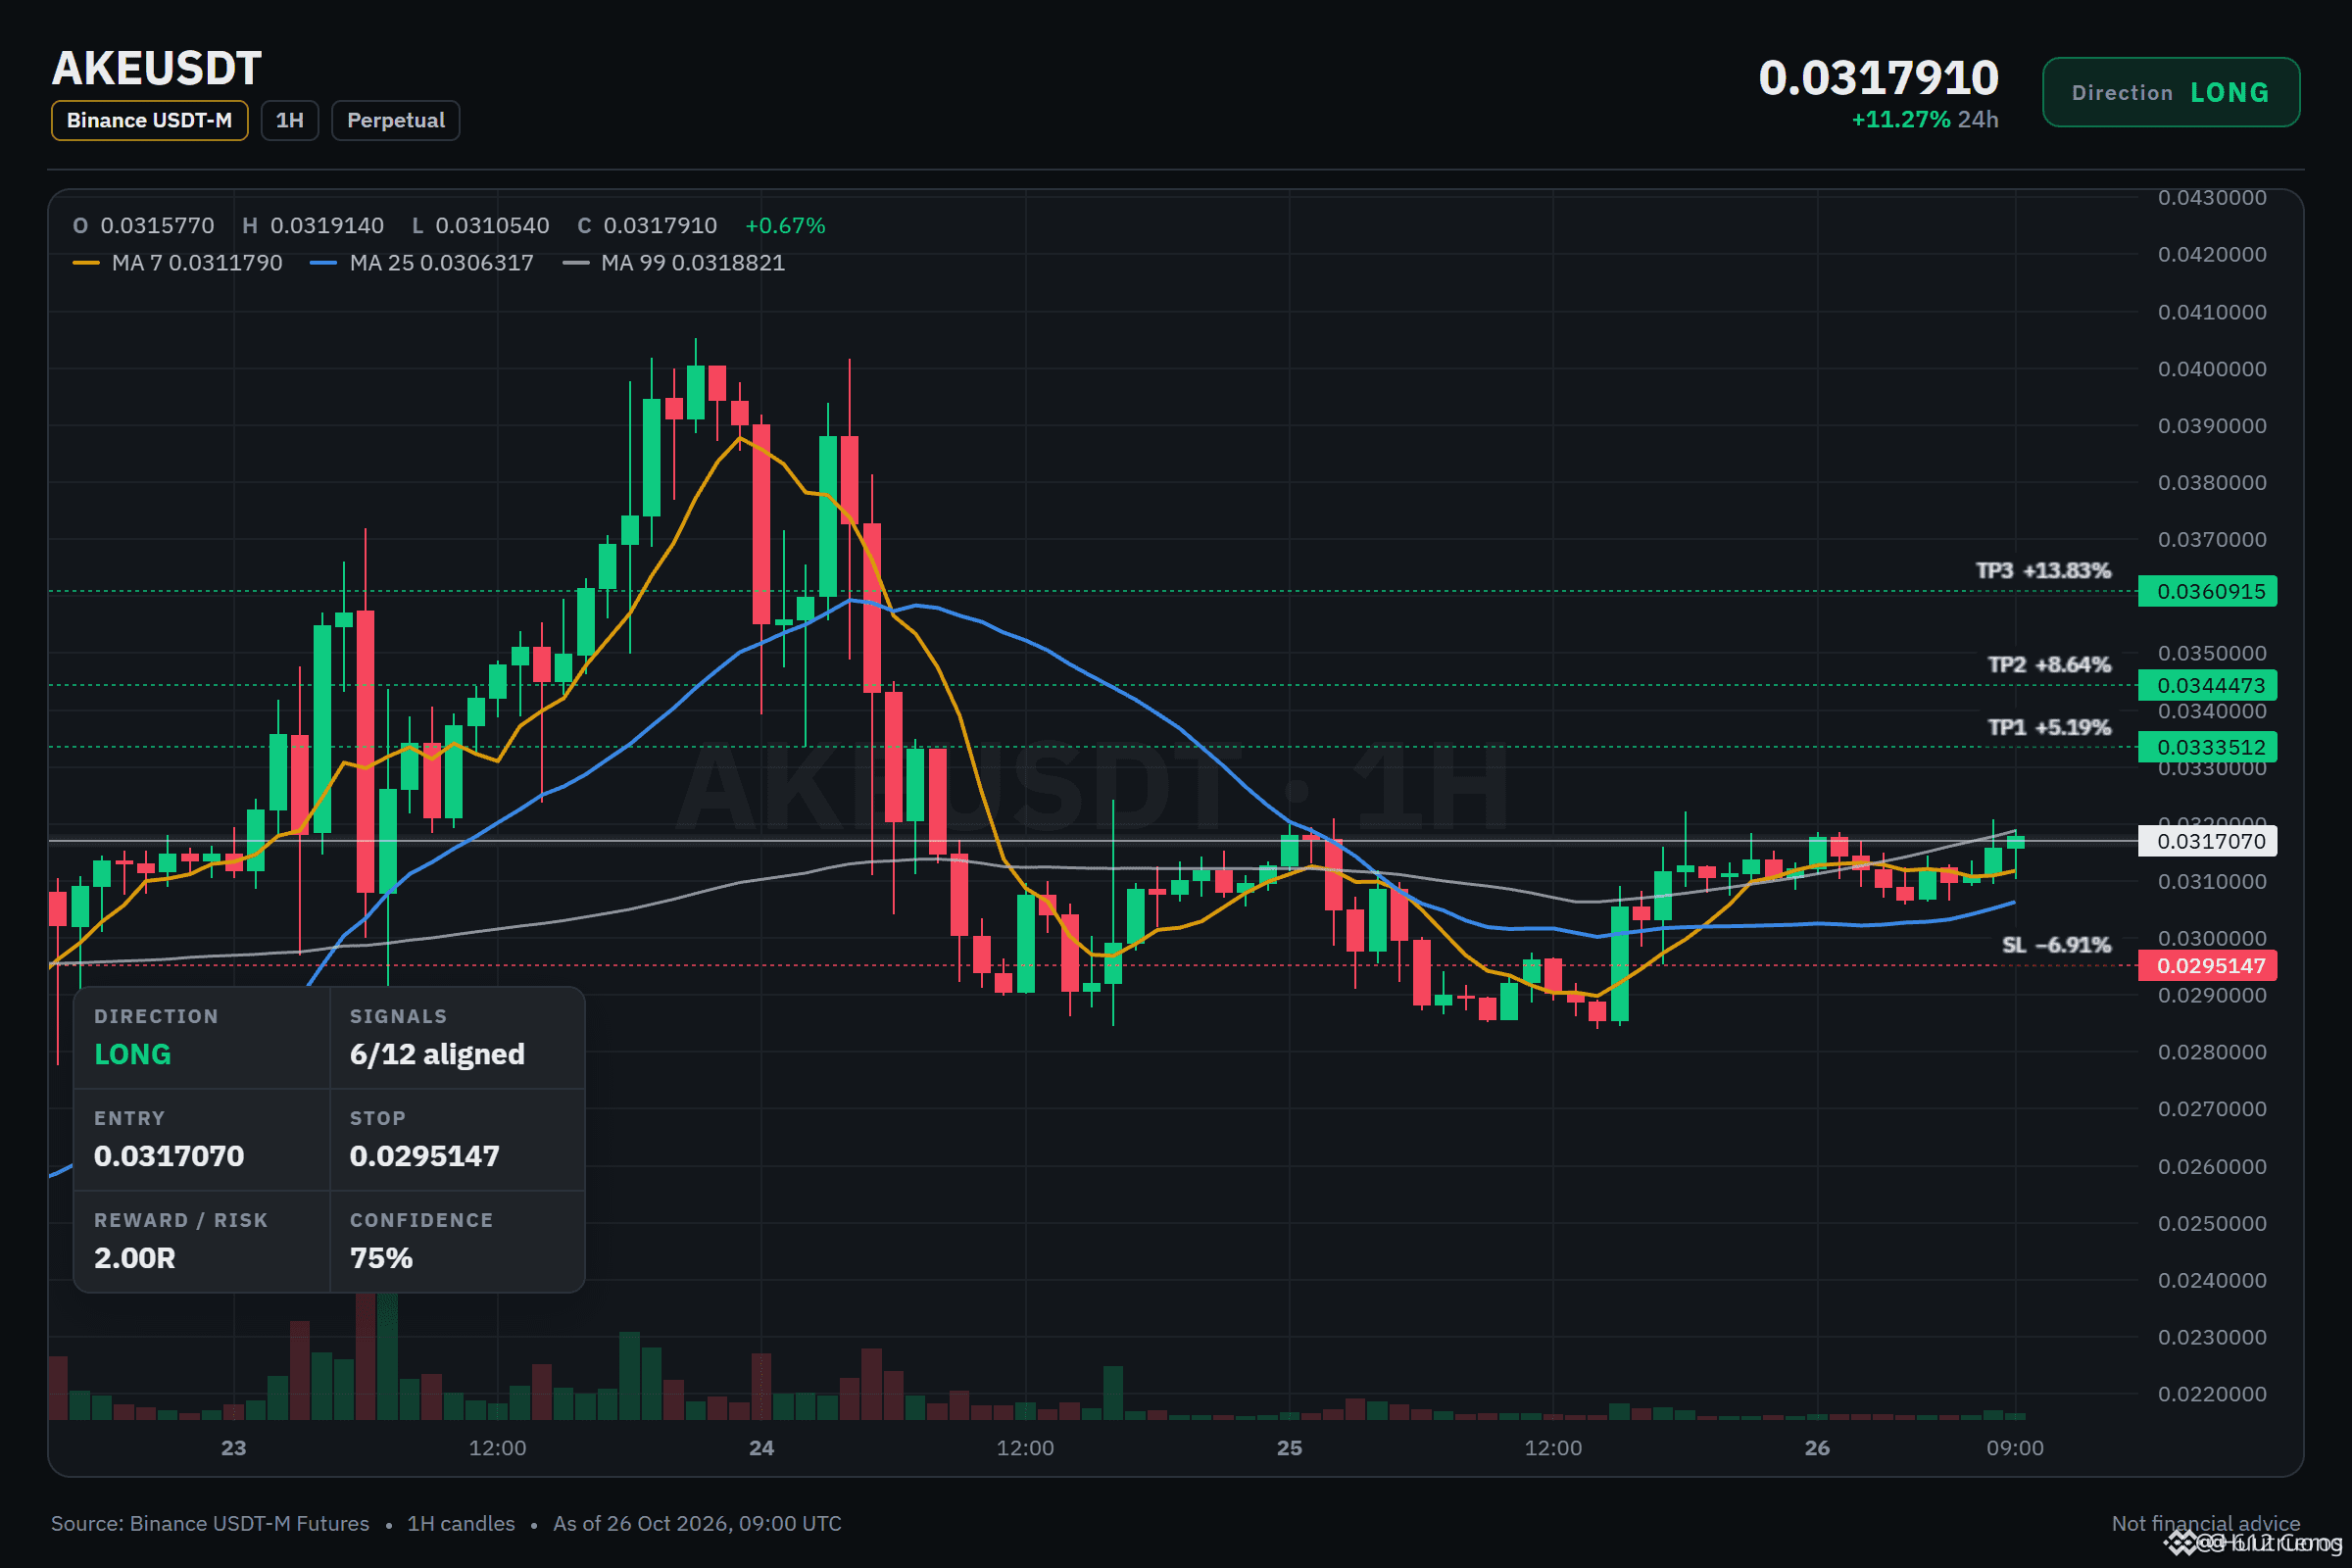
AKE breaks above stacked EMAs on every trend
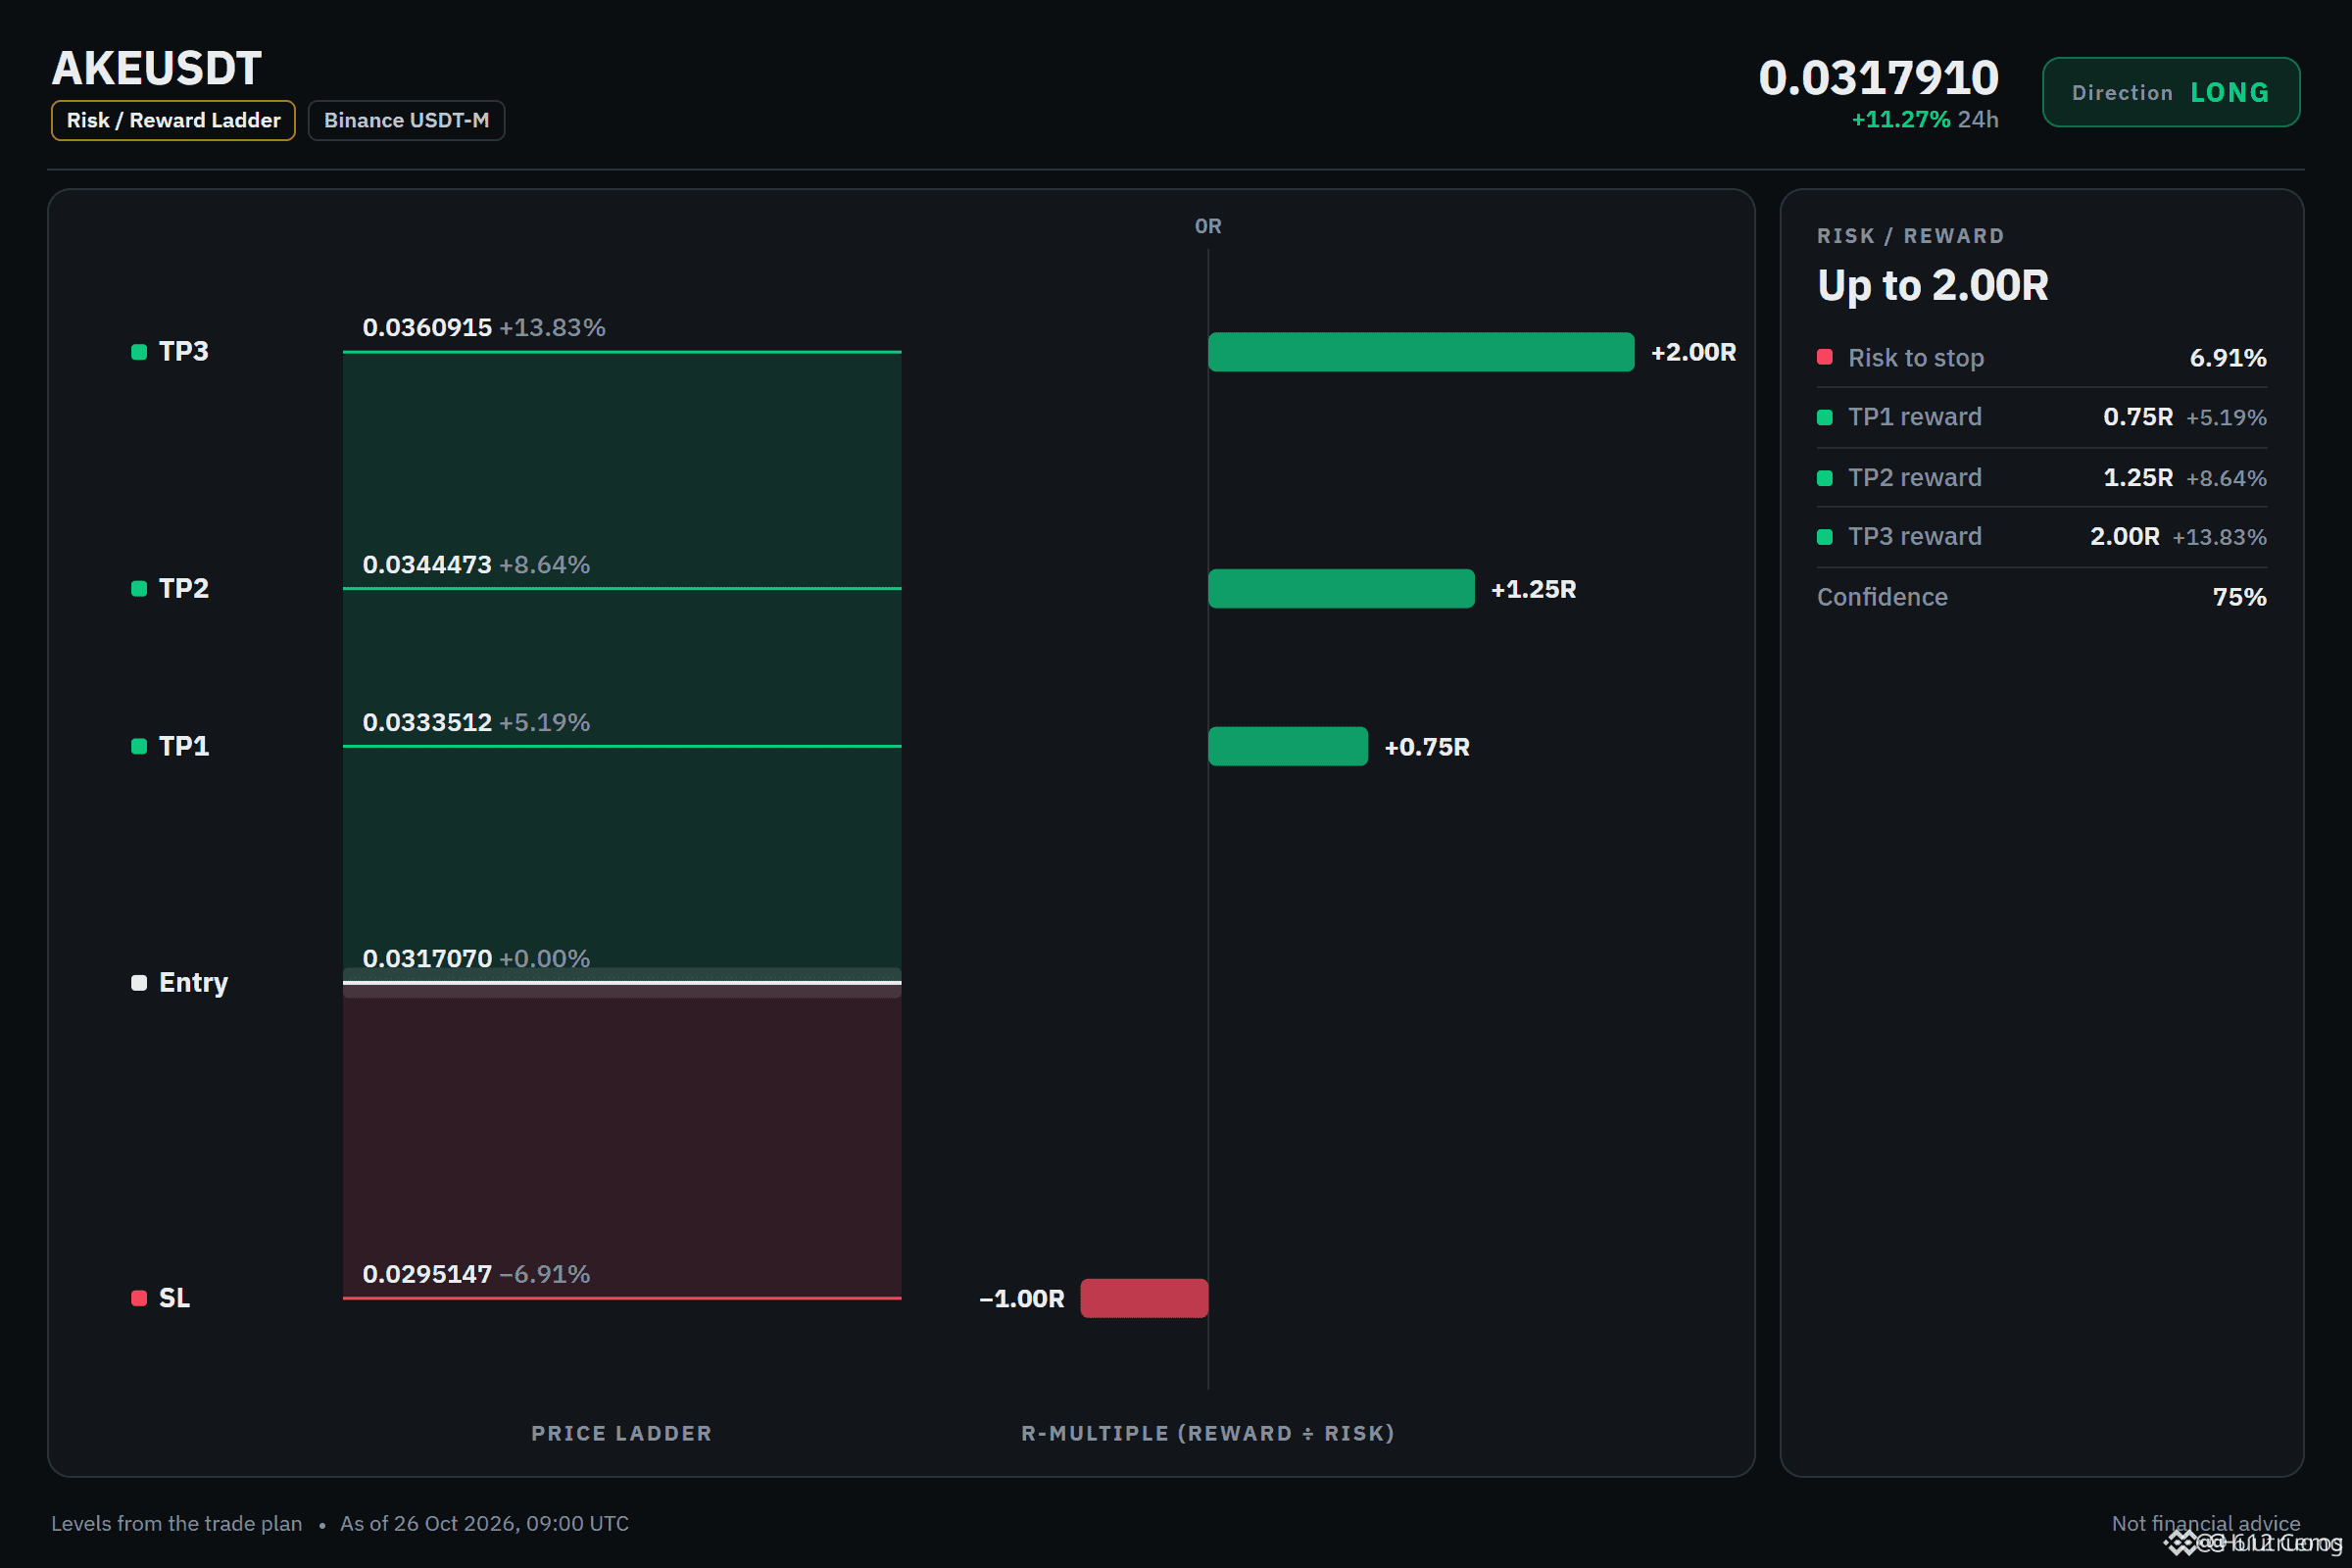
🟢 LONG $AKE /USDT: expecting price to go UP
Bias: LONG · Strong
Entry: 0.0316008 – 0.0318132
TP1: 0.0333512 (+5.2%)
TP2: 0.0344473 (+8.6%)
TP3: 0.0360915 (+13.8%)
SL: 0.0295147 (-6.9%)
Plan: enter only inside the zone, close 50% at TP1, 25% at TP2, 25% at TP3, and move the stop to entry after TP1.
Why LONG? What I checked: 6/12 agree, 0 against.
• Daily trend up (above EMA50 & EMA200)
• 4h trend up (above EMA50 & EMA200)
• 1h trend up (above EMA50 & EMA200)
Watch: The idea is wrong if price reaches the stop at 0.0295147
Net read: The daily bullish stack (price above EMA50 and EMA200) is the strongest tailwind, while the 4h RSI at 49.8 means momentum is undecided and offers no help.
Where do you want to take profits if AKE keeps rising?
5
·
--
Bearish
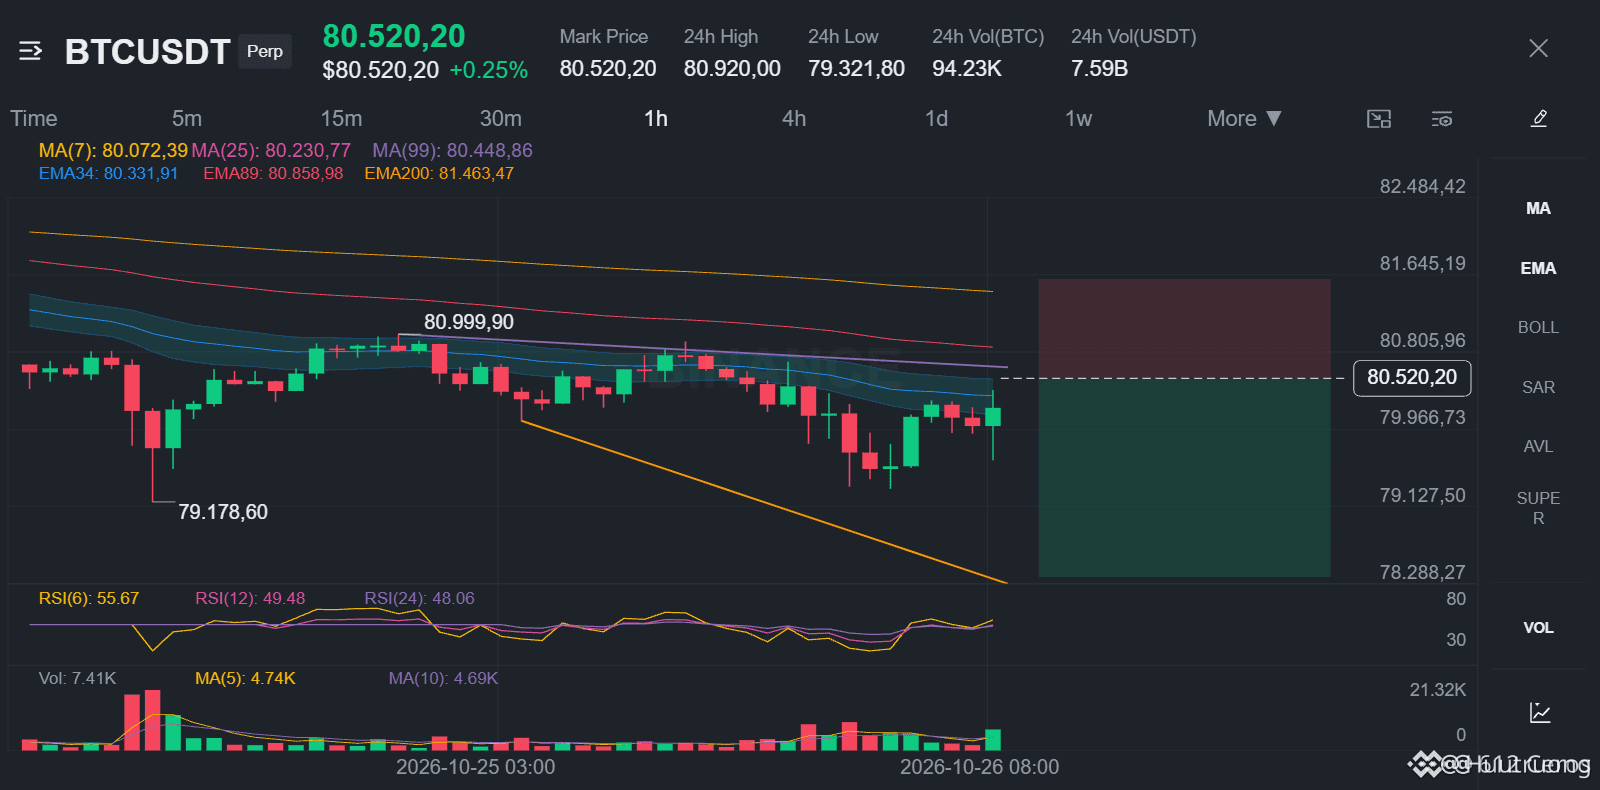
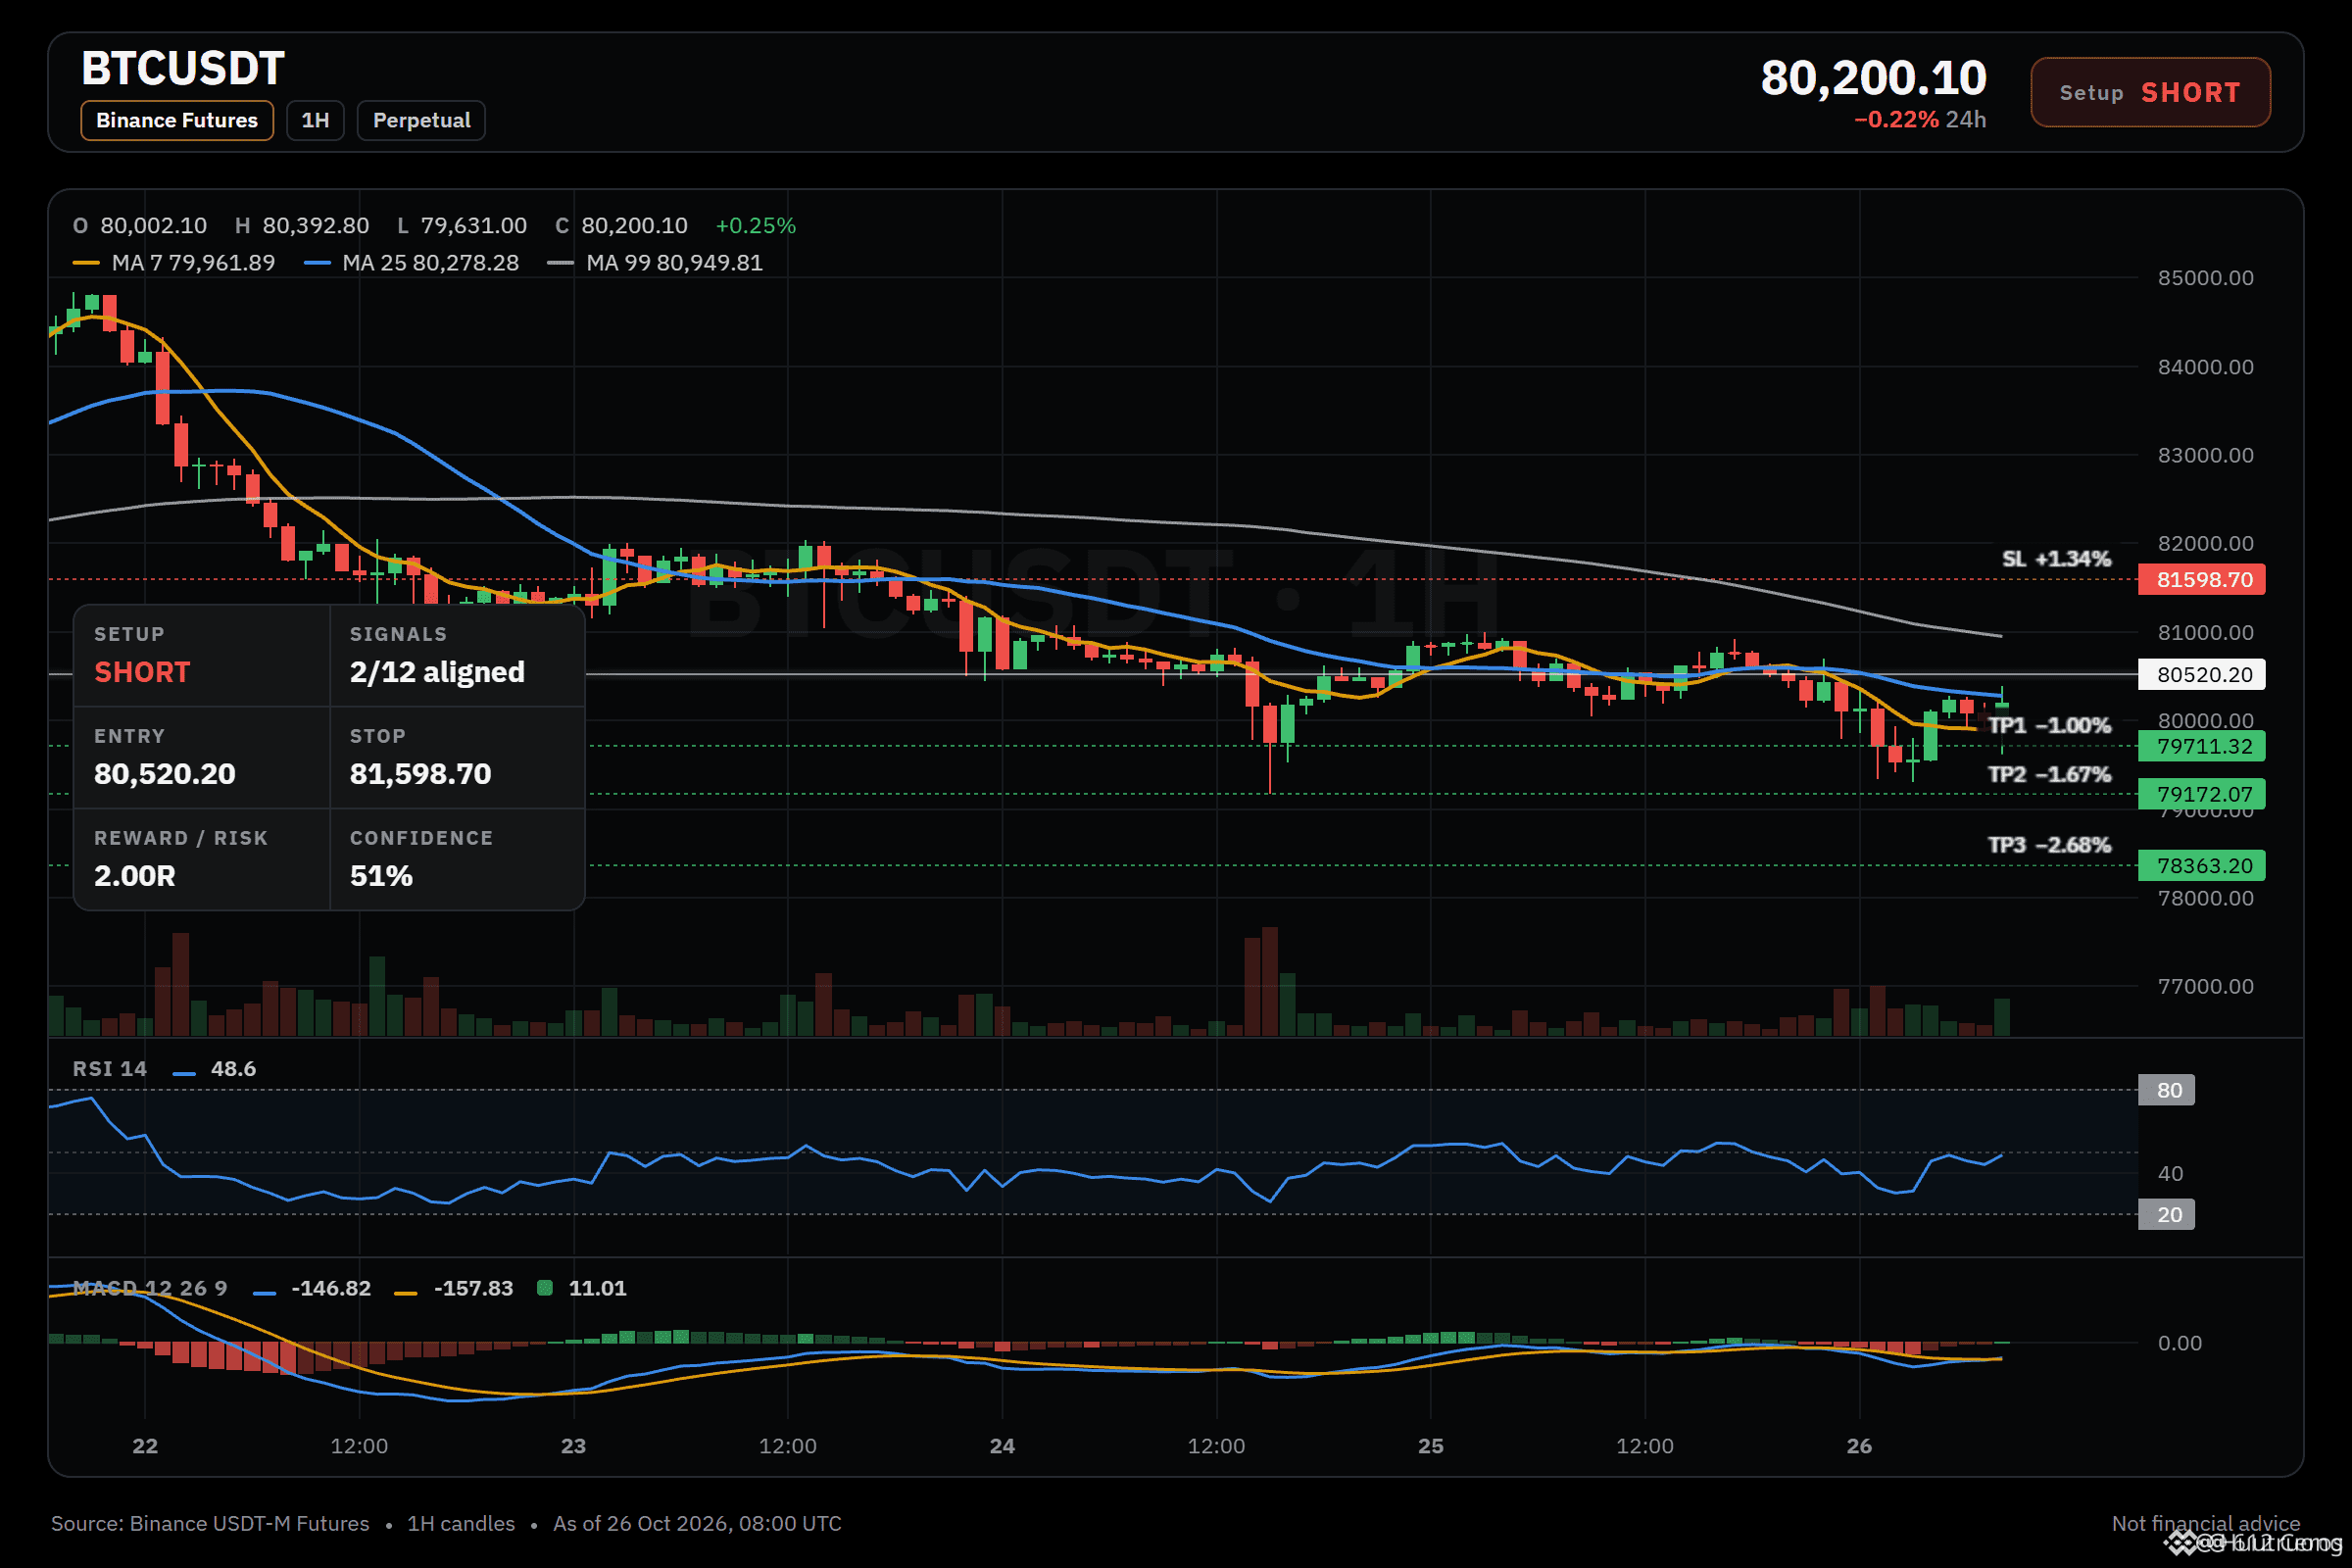
price below EMA50 and EMA200 on the 4h
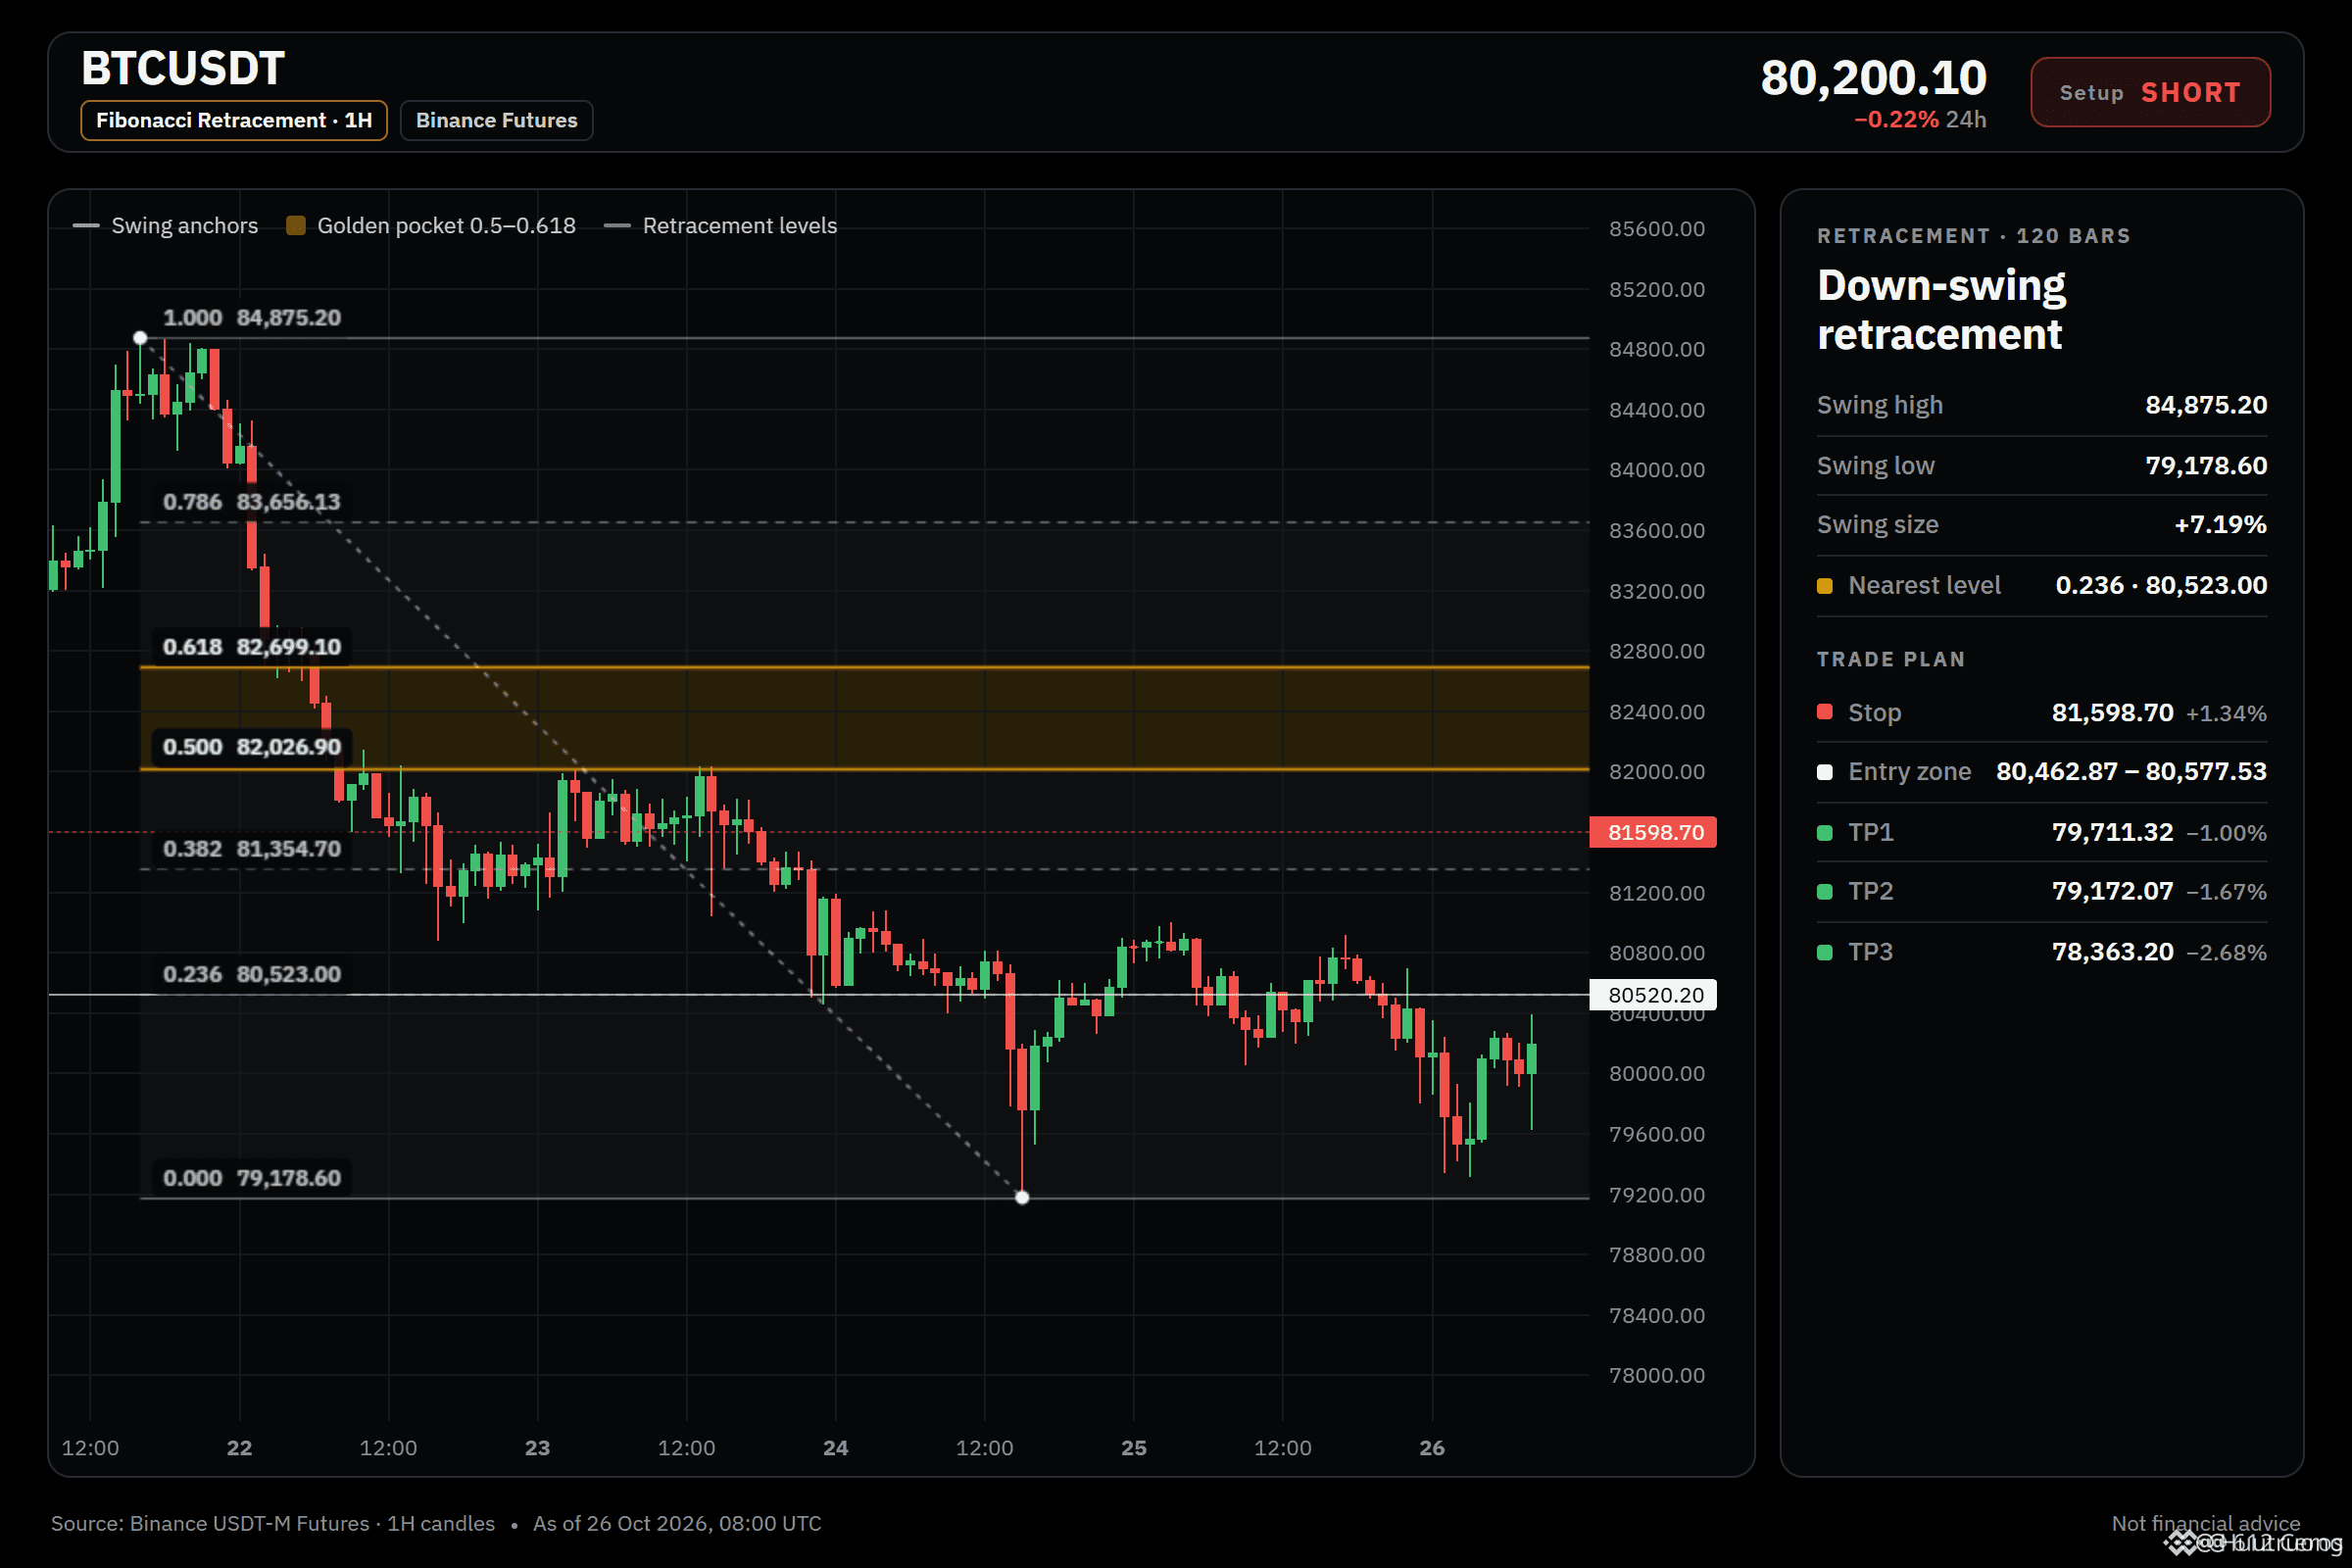
🔴 SHORT $BTC /USDT: expecting price to go DOWN
Bias: SHORT · Leaning
Entry: 80462.87 – 80577.53
TP1: 79711.32 (-1.0%)
TP2: 79172.07 (-1.7%)
TP3: 78363.20 (-2.7%)
SL: 81598.70 (+1.3%)
Plan: enter only inside the zone, close 50% at TP1, 25% at TP2, 25% at TP3, and move the stop to entry after TP1.
Note: moderate conviction only, keep size light.
Why SHORT? 2/12 signals agree, 2 against.
• 4h trend down (below EMA50 & EMA200)
• Sellers have the momentum (4h RSI 38.4)
Risk: BTC is rising, this coin follows (corr 1.00)
Q: Why short when the daily trend is range?
A: The 4h bearish stack keeps the swing trend down.
Q: What if buyers are pressing right now?
A: The 15m RSI z-score of +1.36 shows buyers pushing.
What level would make you take the other side?
11
·
--
📊 $AMZN Earnings Prediction | Bullish or Bearish? 🚀
I’m bullish on Amazon! Strong AWS growth, AI innovation, and expanding e-commerce could support its earnings. Will $AMZN beat market expectations? Let’s watch the results! 📈🔥
What’s your prediction?
#EarningsSeasonOnSquare #BinancePick $AMZN
{future}(AMZNUSDT)
📊 $AMZN Earnings Prediction | Bullish or Bearish? 🚀
I’m bullish on Amazon! Strong AWS growth, AI innovation, and expanding e-commerce could support its earnings. Will $AMZN beat market expectations? Let’s watch the results! 📈🔥
What’s your prediction?
#EarningsSeasonOnSquare #BinancePick $AMZN
I’m bullish on Amazon! Strong AWS growth, AI innovation, and expanding e-commerce could support its earnings. Will $AMZN beat market expectations? Let’s watch the results! 📈🔥
What’s your prediction?
#EarningsSeasonOnSquare #BinancePick $AMZN
6
·
--
Bearish
ETH is sliding in a clear bearish stack.
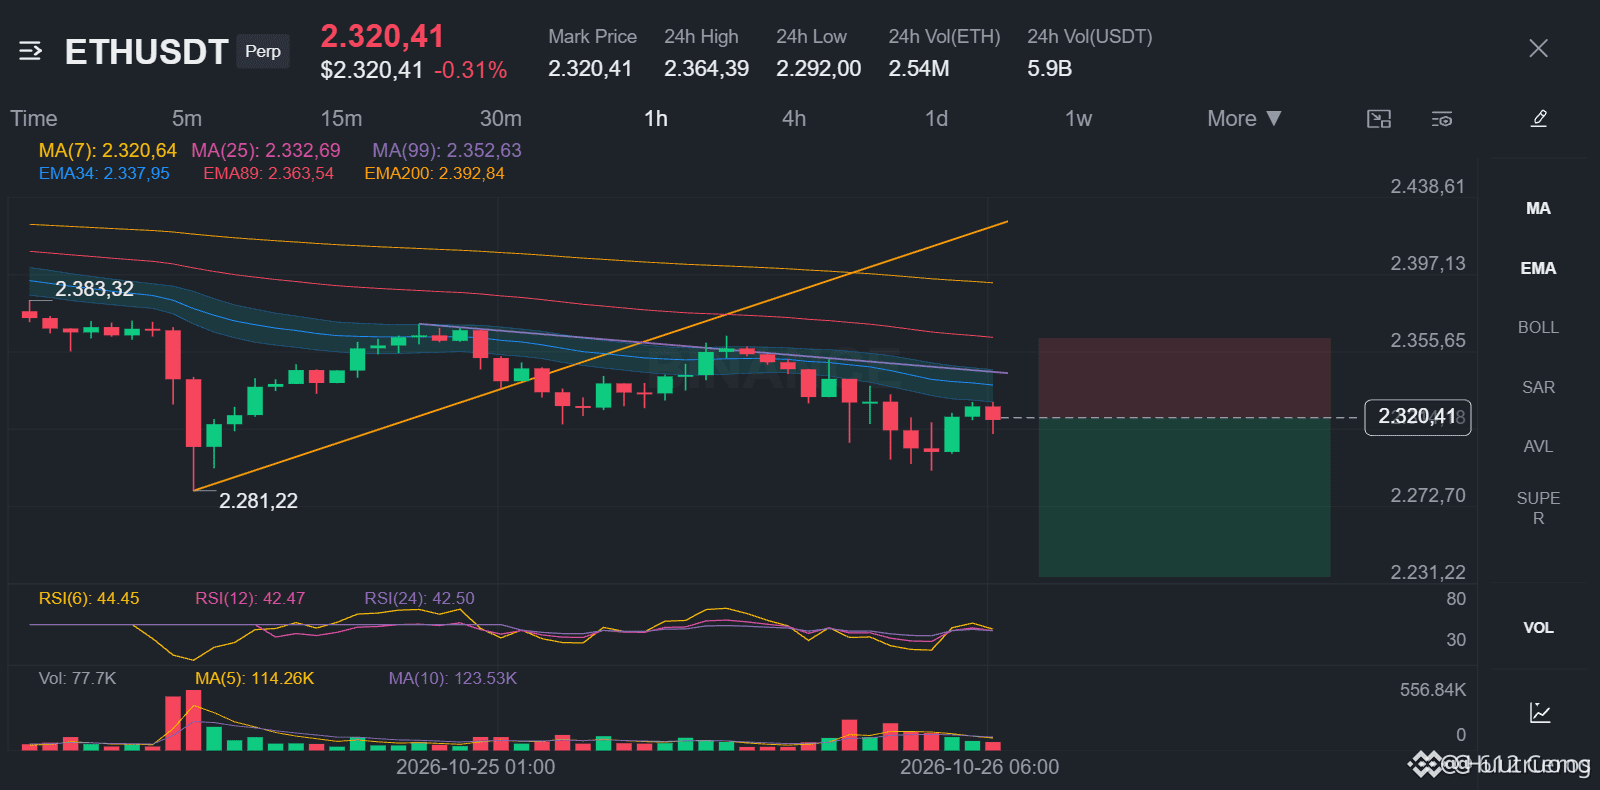
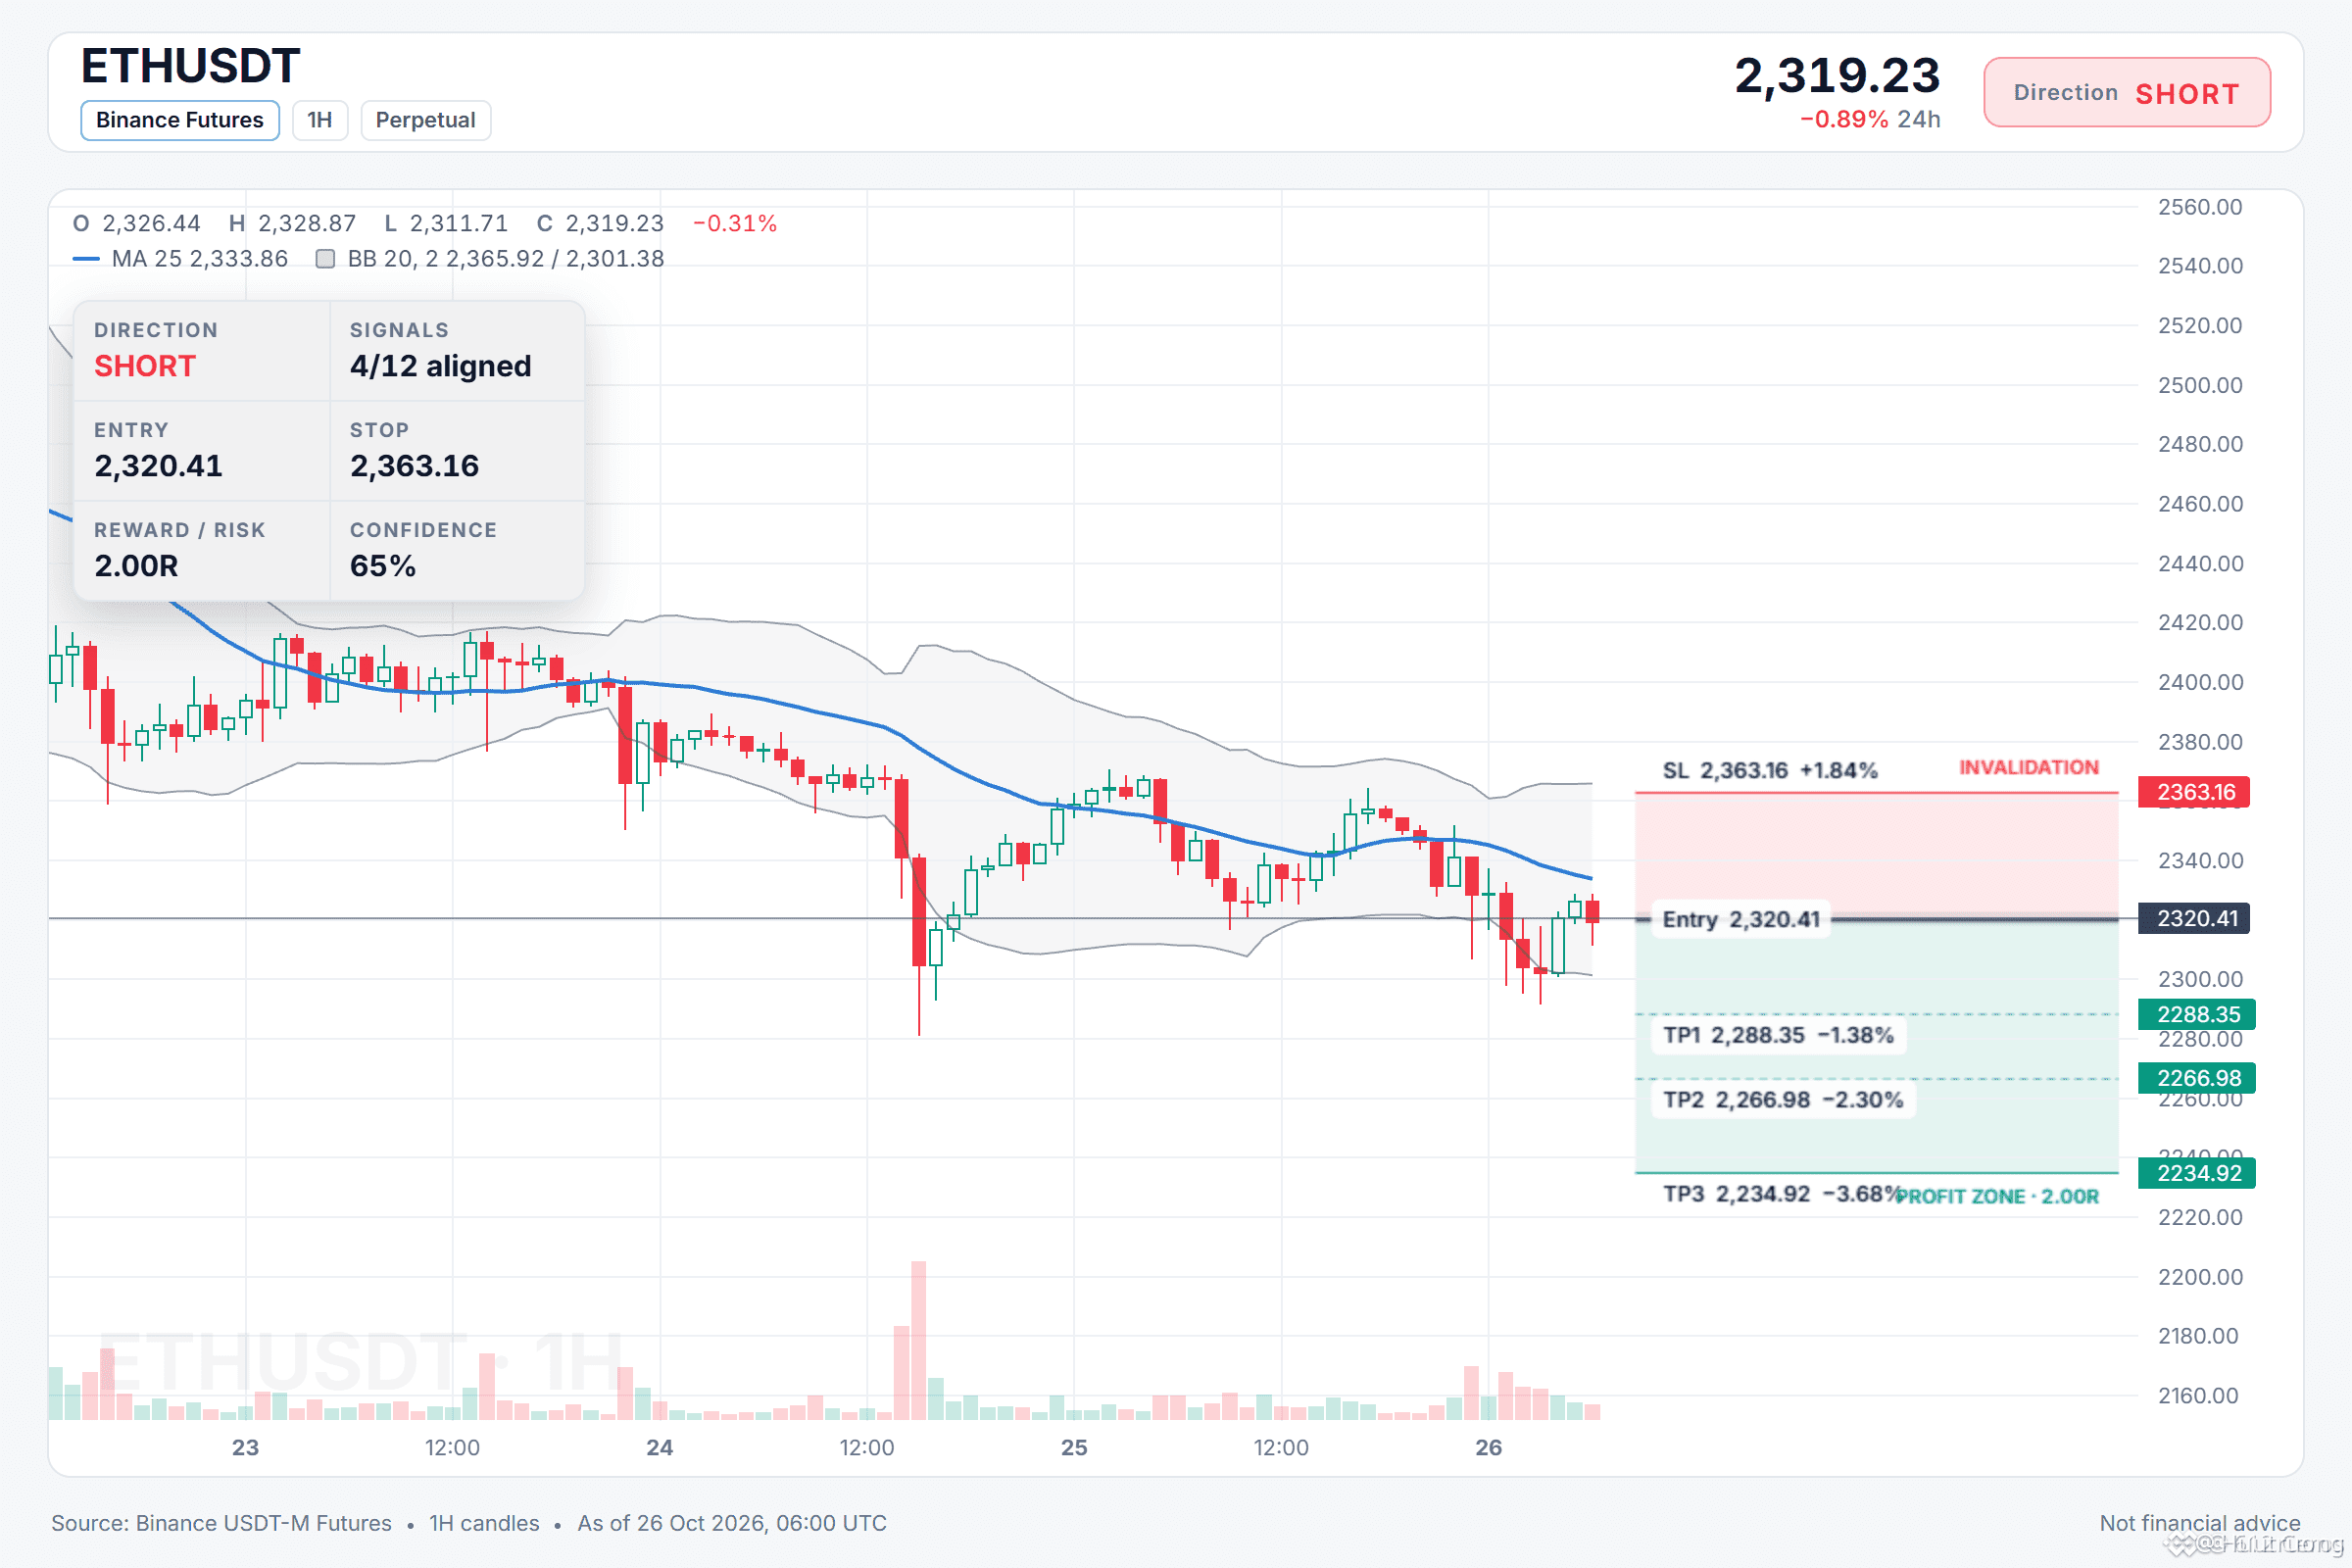
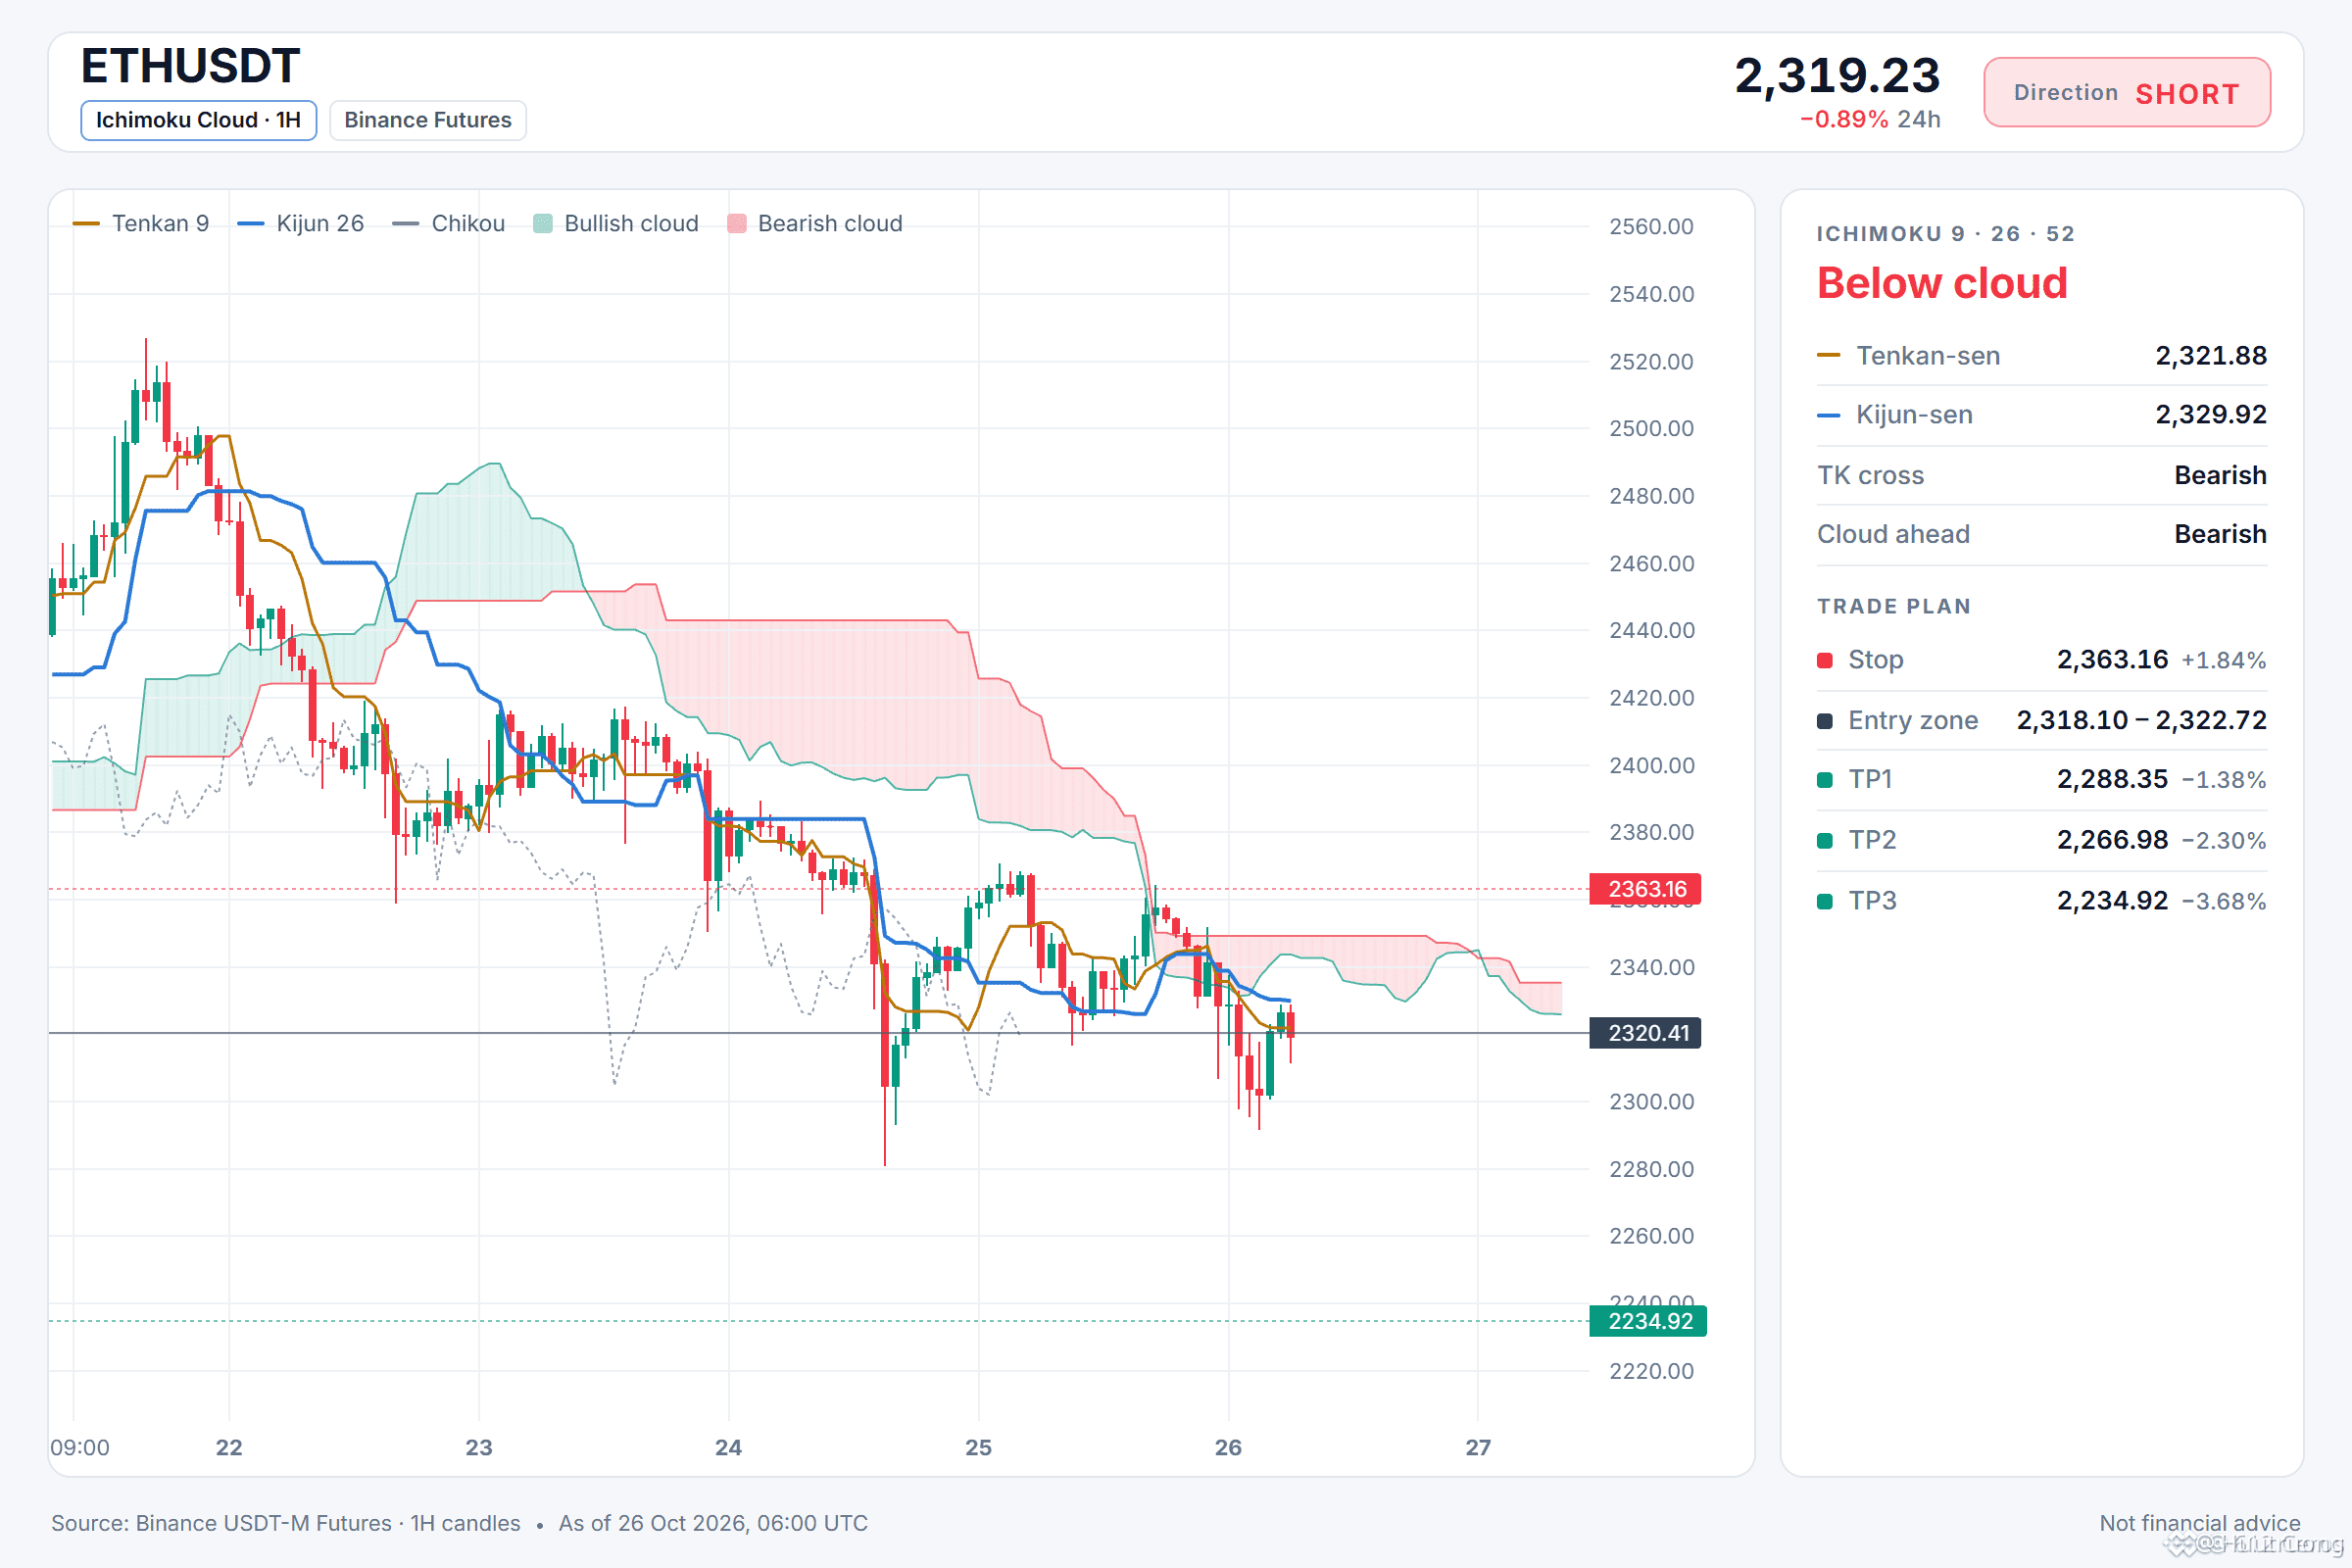
🔴 SHORT $ETH /USDT: expecting price to go DOWN
Bias: SHORT · Leaning
Entry: 2318.10 – 2322.72
TP1: 2288.35 (-1.4%)
TP2: 2266.98 (-2.3%)
TP3: 2234.92 (-3.7%)
SL: 2363.16 (+1.8%)
Plan: enter only inside the zone, close 50% at TP1, 25% at TP2, 25% at TP3, and move the stop to entry after TP1.
Note: moderate conviction only, keep size light.
Why SHORT? 4/12 signals agree, 0 against.
• 4h trend down (below EMA50 & EMA200)
• 1h trend down (below EMA50 & EMA200)
• Sellers have the momentum (4h RSI 33.4)
Plan A:
If the 4h trend keeps price below both EMAs, the 1h bearish stack may push it toward the TP1 zone.
Plan B (invalidation):
If price reclaims the entry level and holds above it, I would close the short and wait.
Where do you set your ETH level?
21
·
--
Bearish
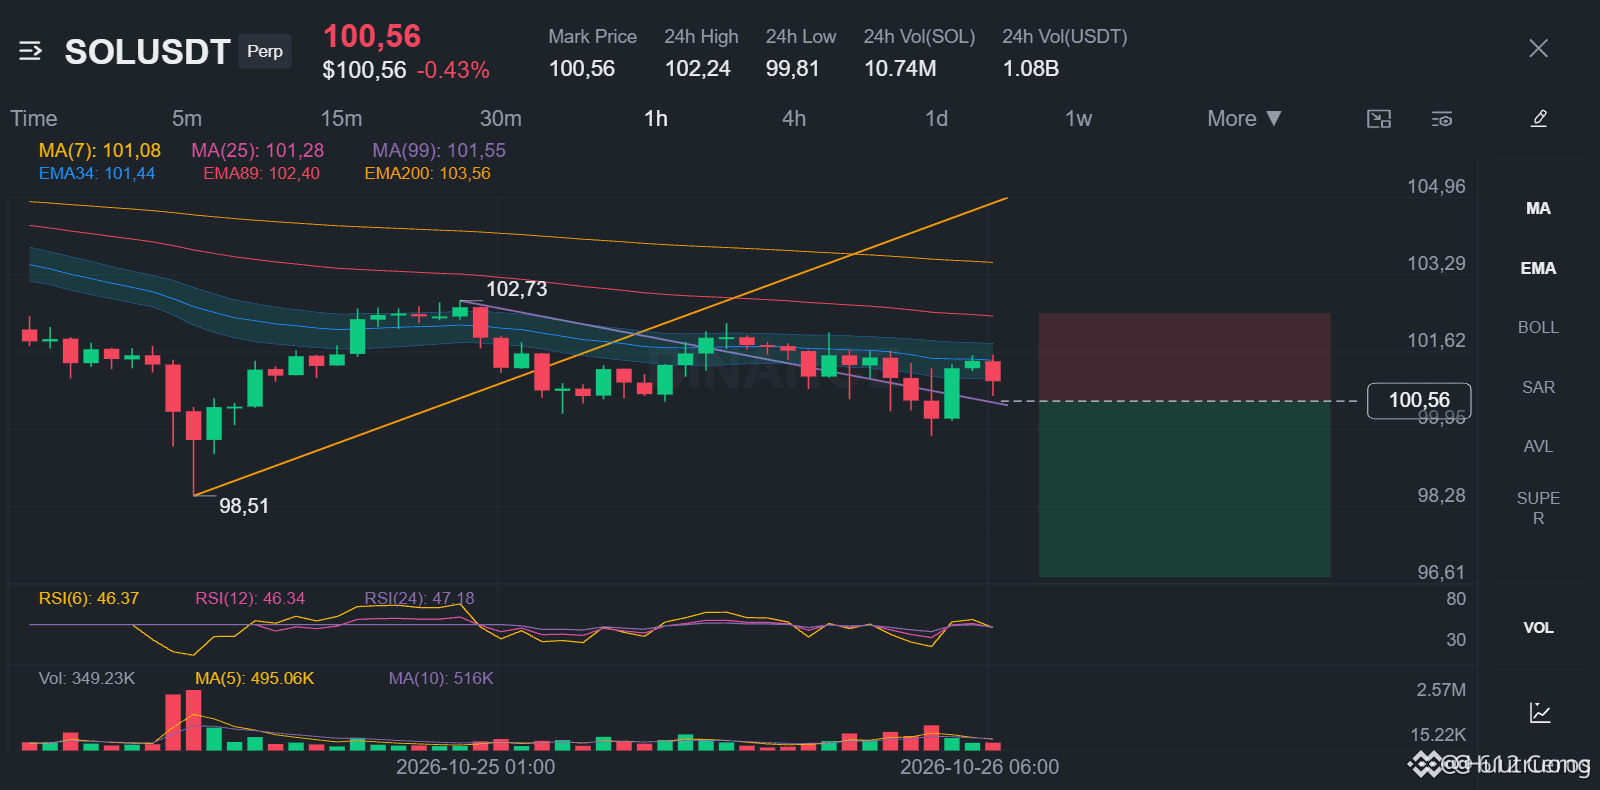
SOL is in a clear 4h downtrend
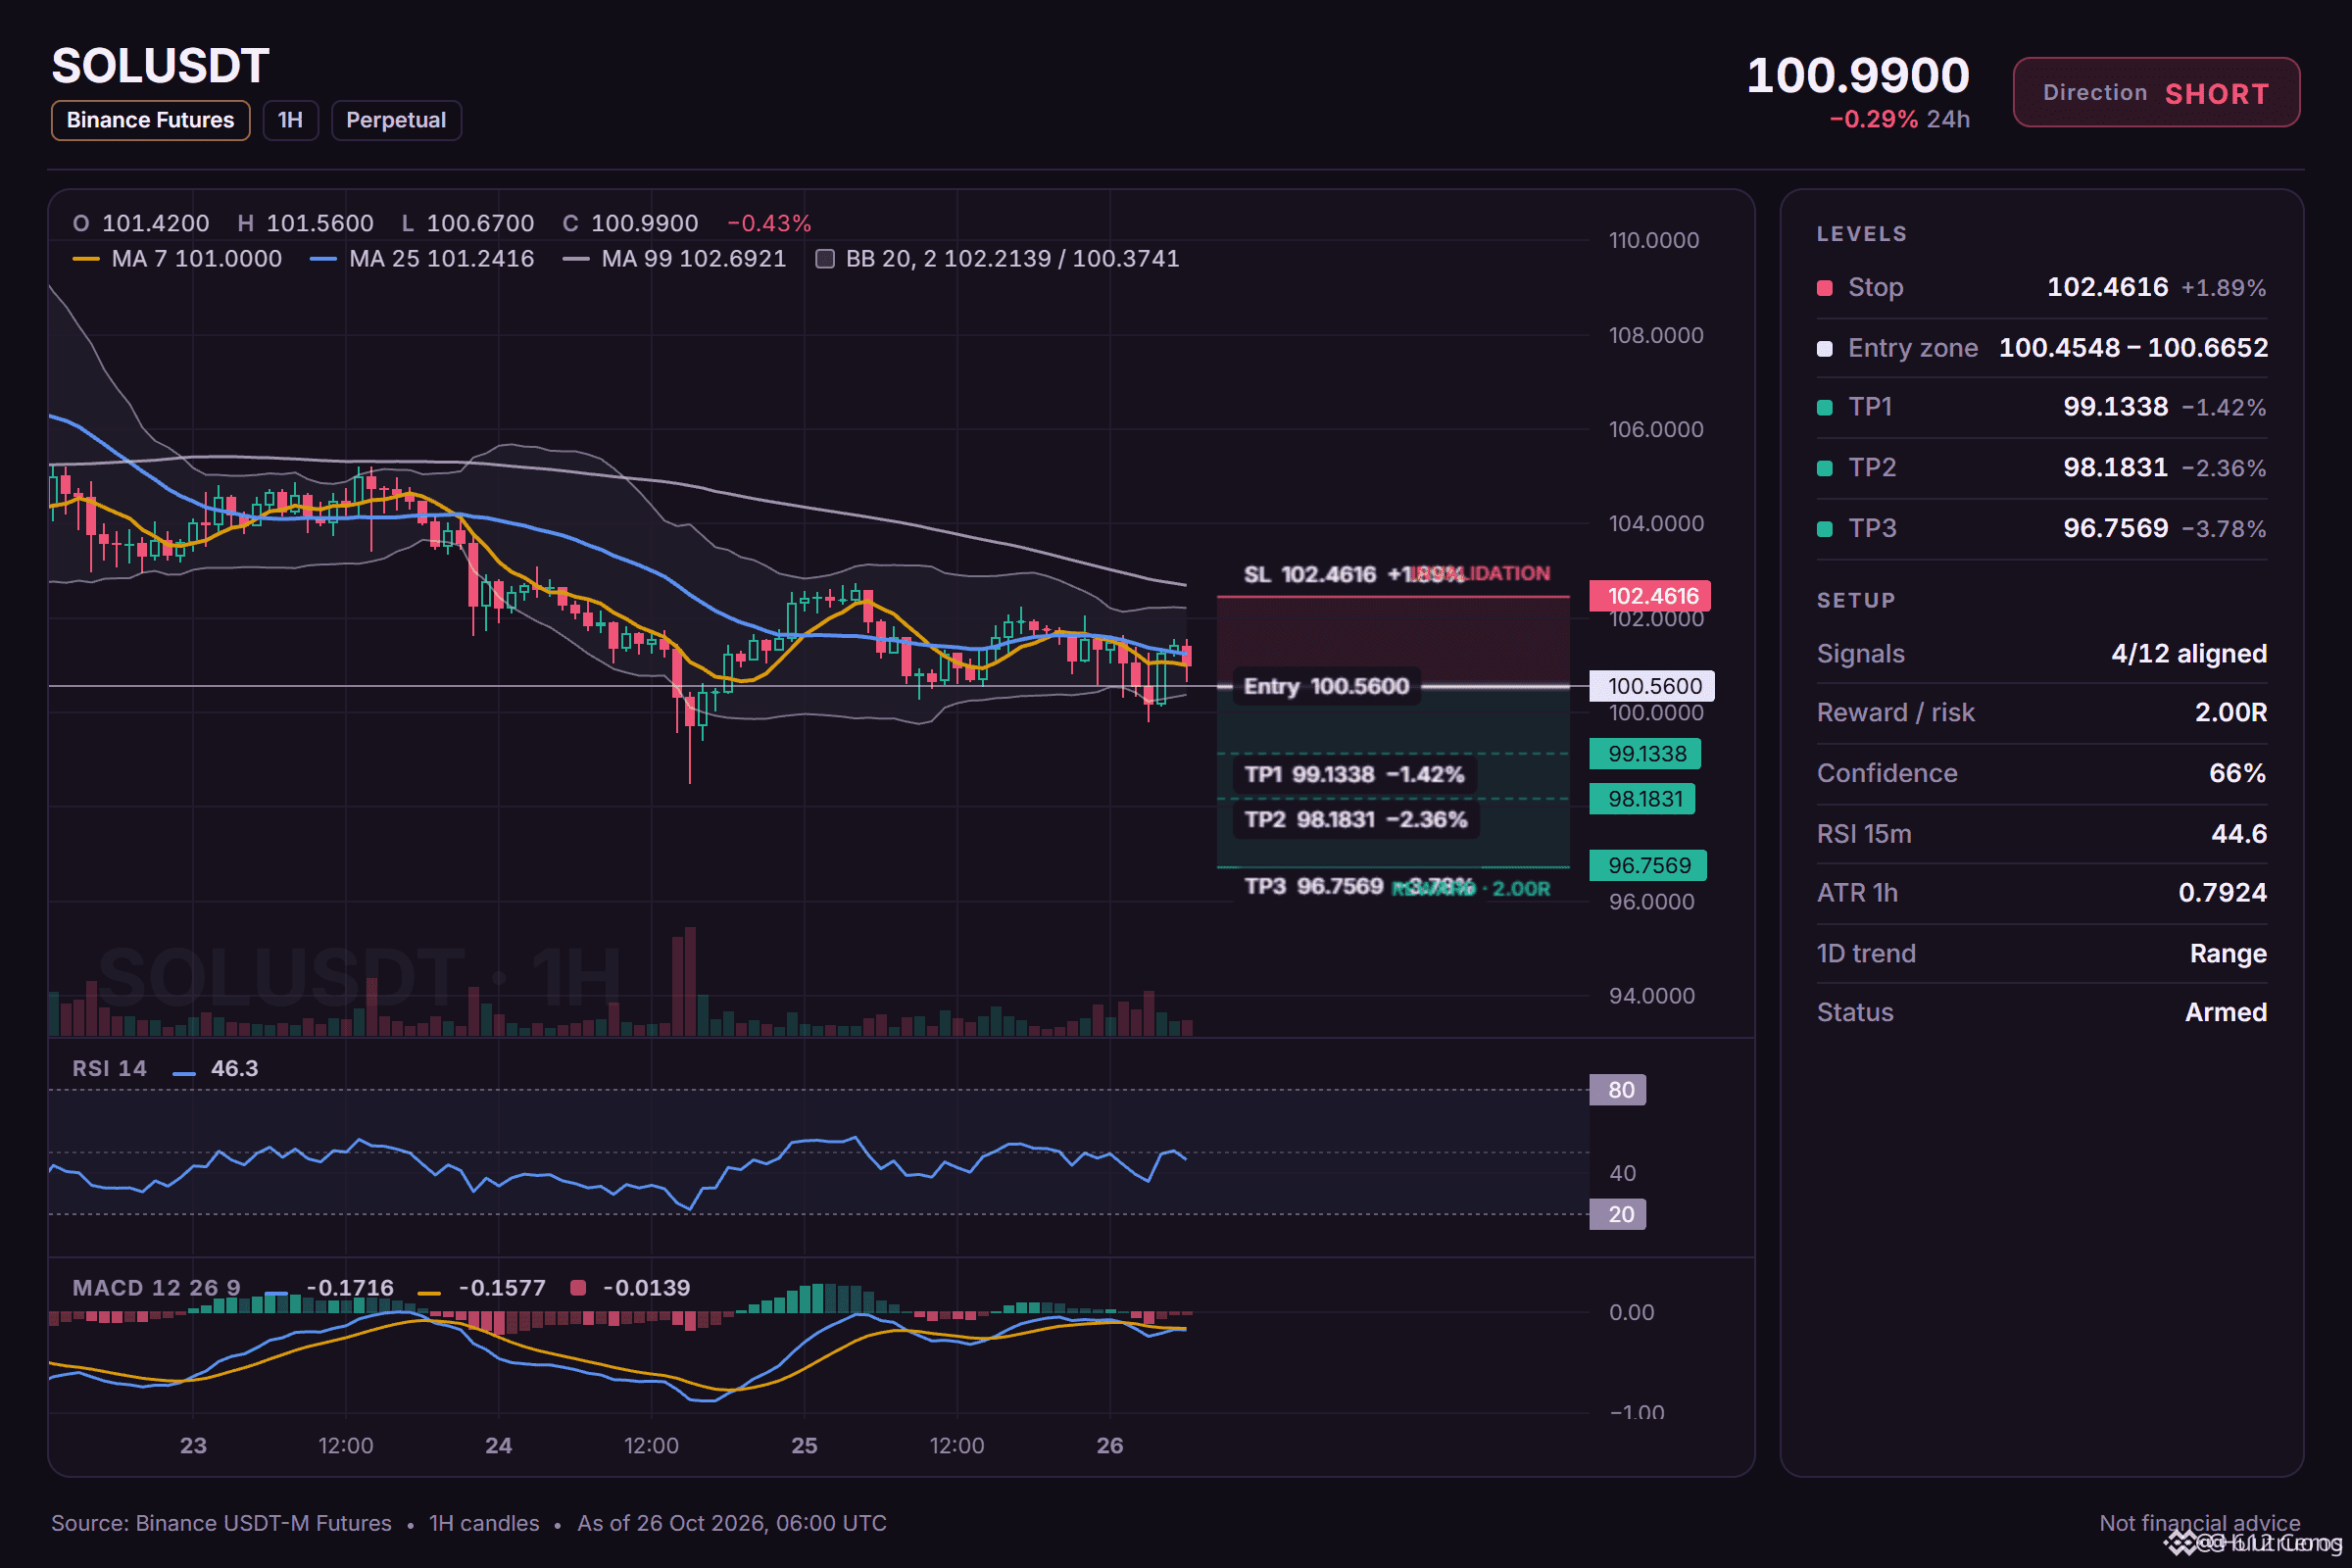
🔴 SHORT $SOL /USDT: expecting price to go DOWN
Bias: SHORT · Leaning
Entry: 100.4548 – 100.6652
TP1: 99.1338 (-1.4%)
TP2: 98.1831 (-2.4%)
TP3: 96.7569 (-3.8%)
SL: 102.4616 (+1.9%)
Plan: enter only inside the zone, close 50% at TP1, 25% at TP2, 25% at TP3, and move the stop to entry after TP1.
Note: moderate conviction only, keep size light.
Why SHORT? 4/12 signals agree, 0 against.
• 4h trend down (below EMA50 & EMA200)
• 1h trend down (below EMA50 & EMA200)
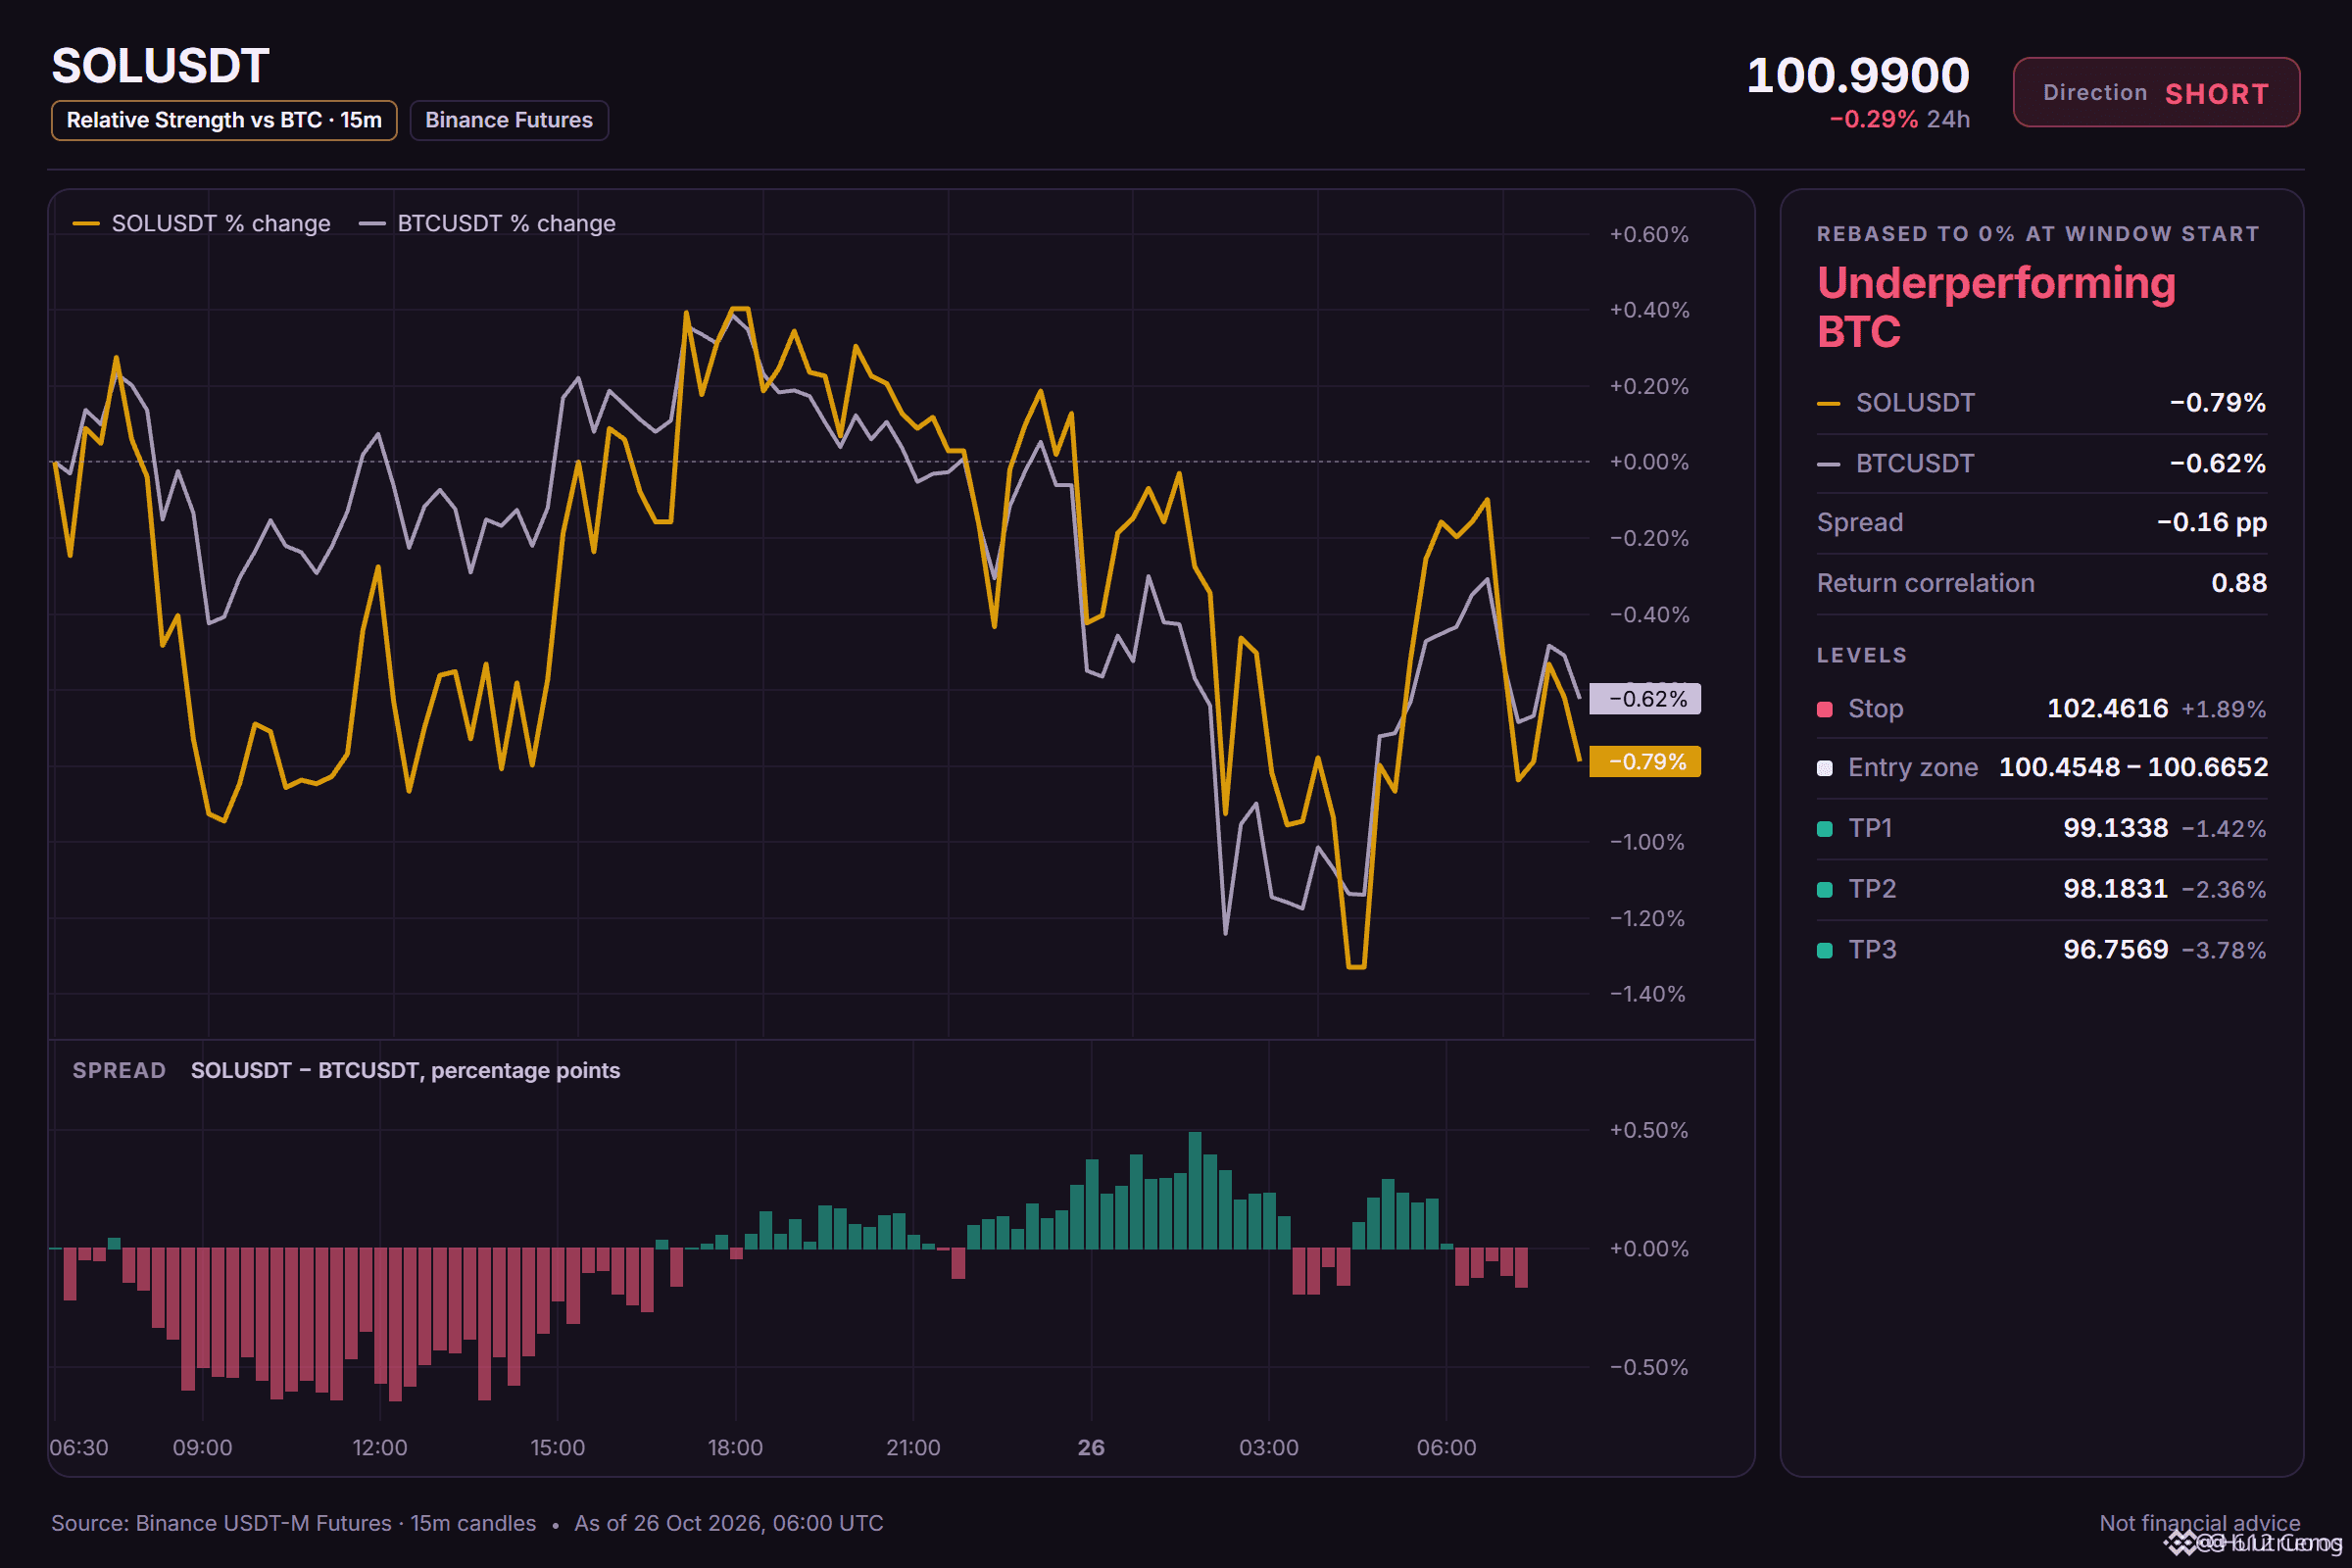
• is falling, this coin follows (corr 0.89)
Why now?
is trading below both the 1h and 4h EMA stacks, confirming the short-term trend is down. The 1h price is 100.5600, and RSI at 44.62 shows sellers have momentum. This is a leaning short with conviction, not a strong signal.
Where is your invalidation level for this trade?
10
·
--
Bullish
Is BTR actually trending up or just noisy
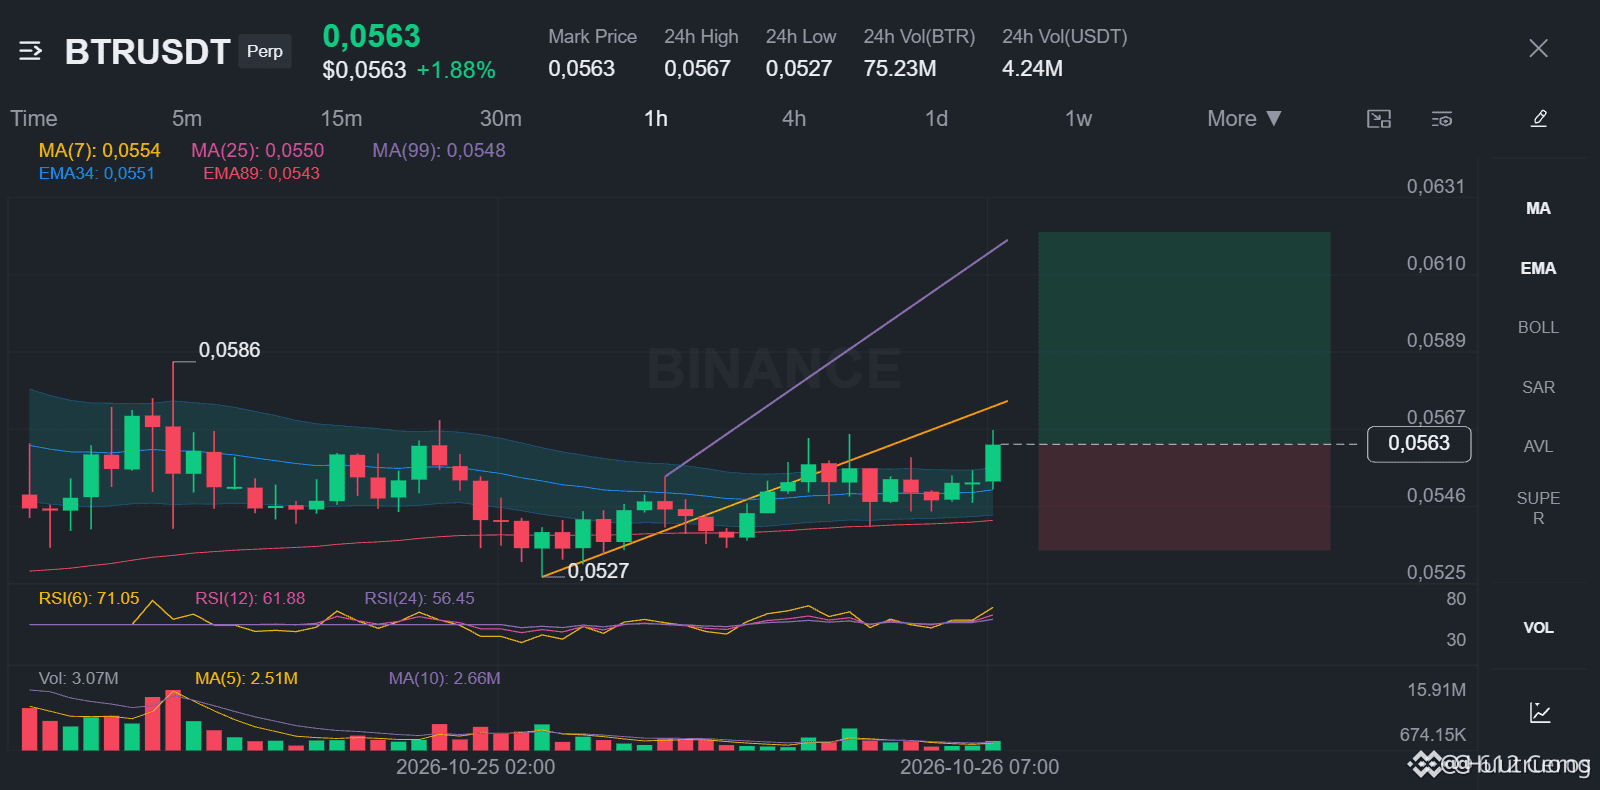
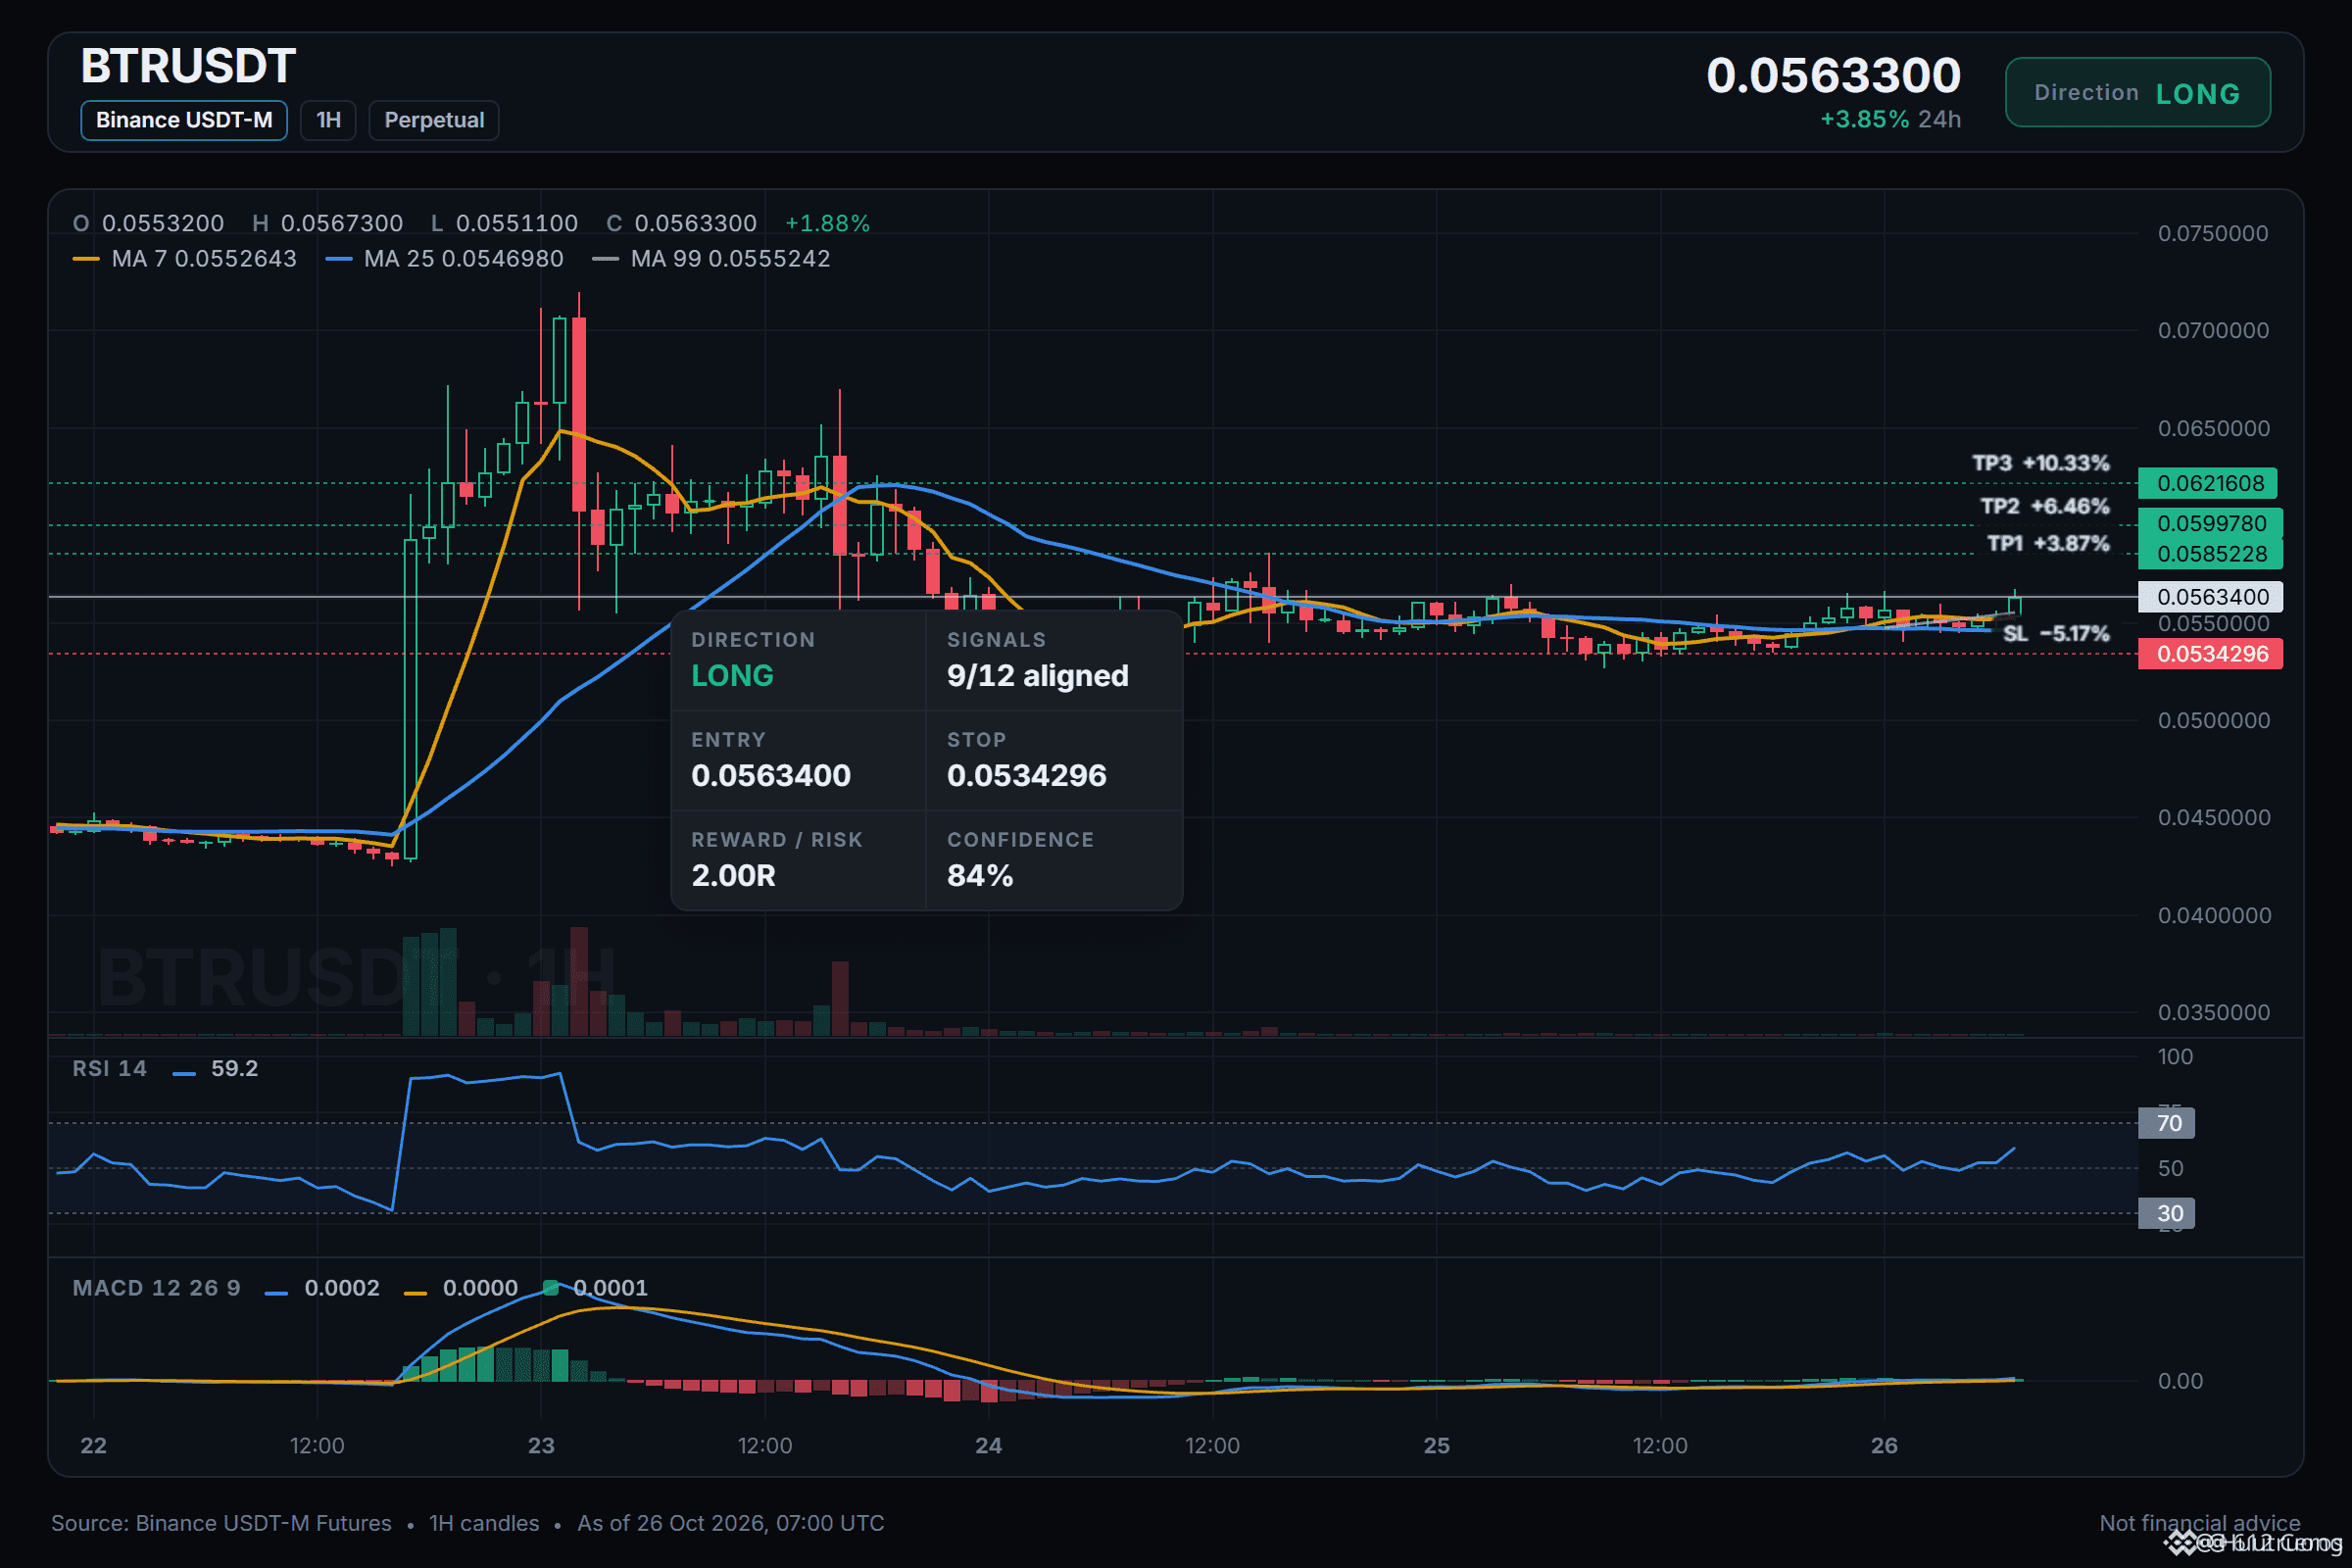
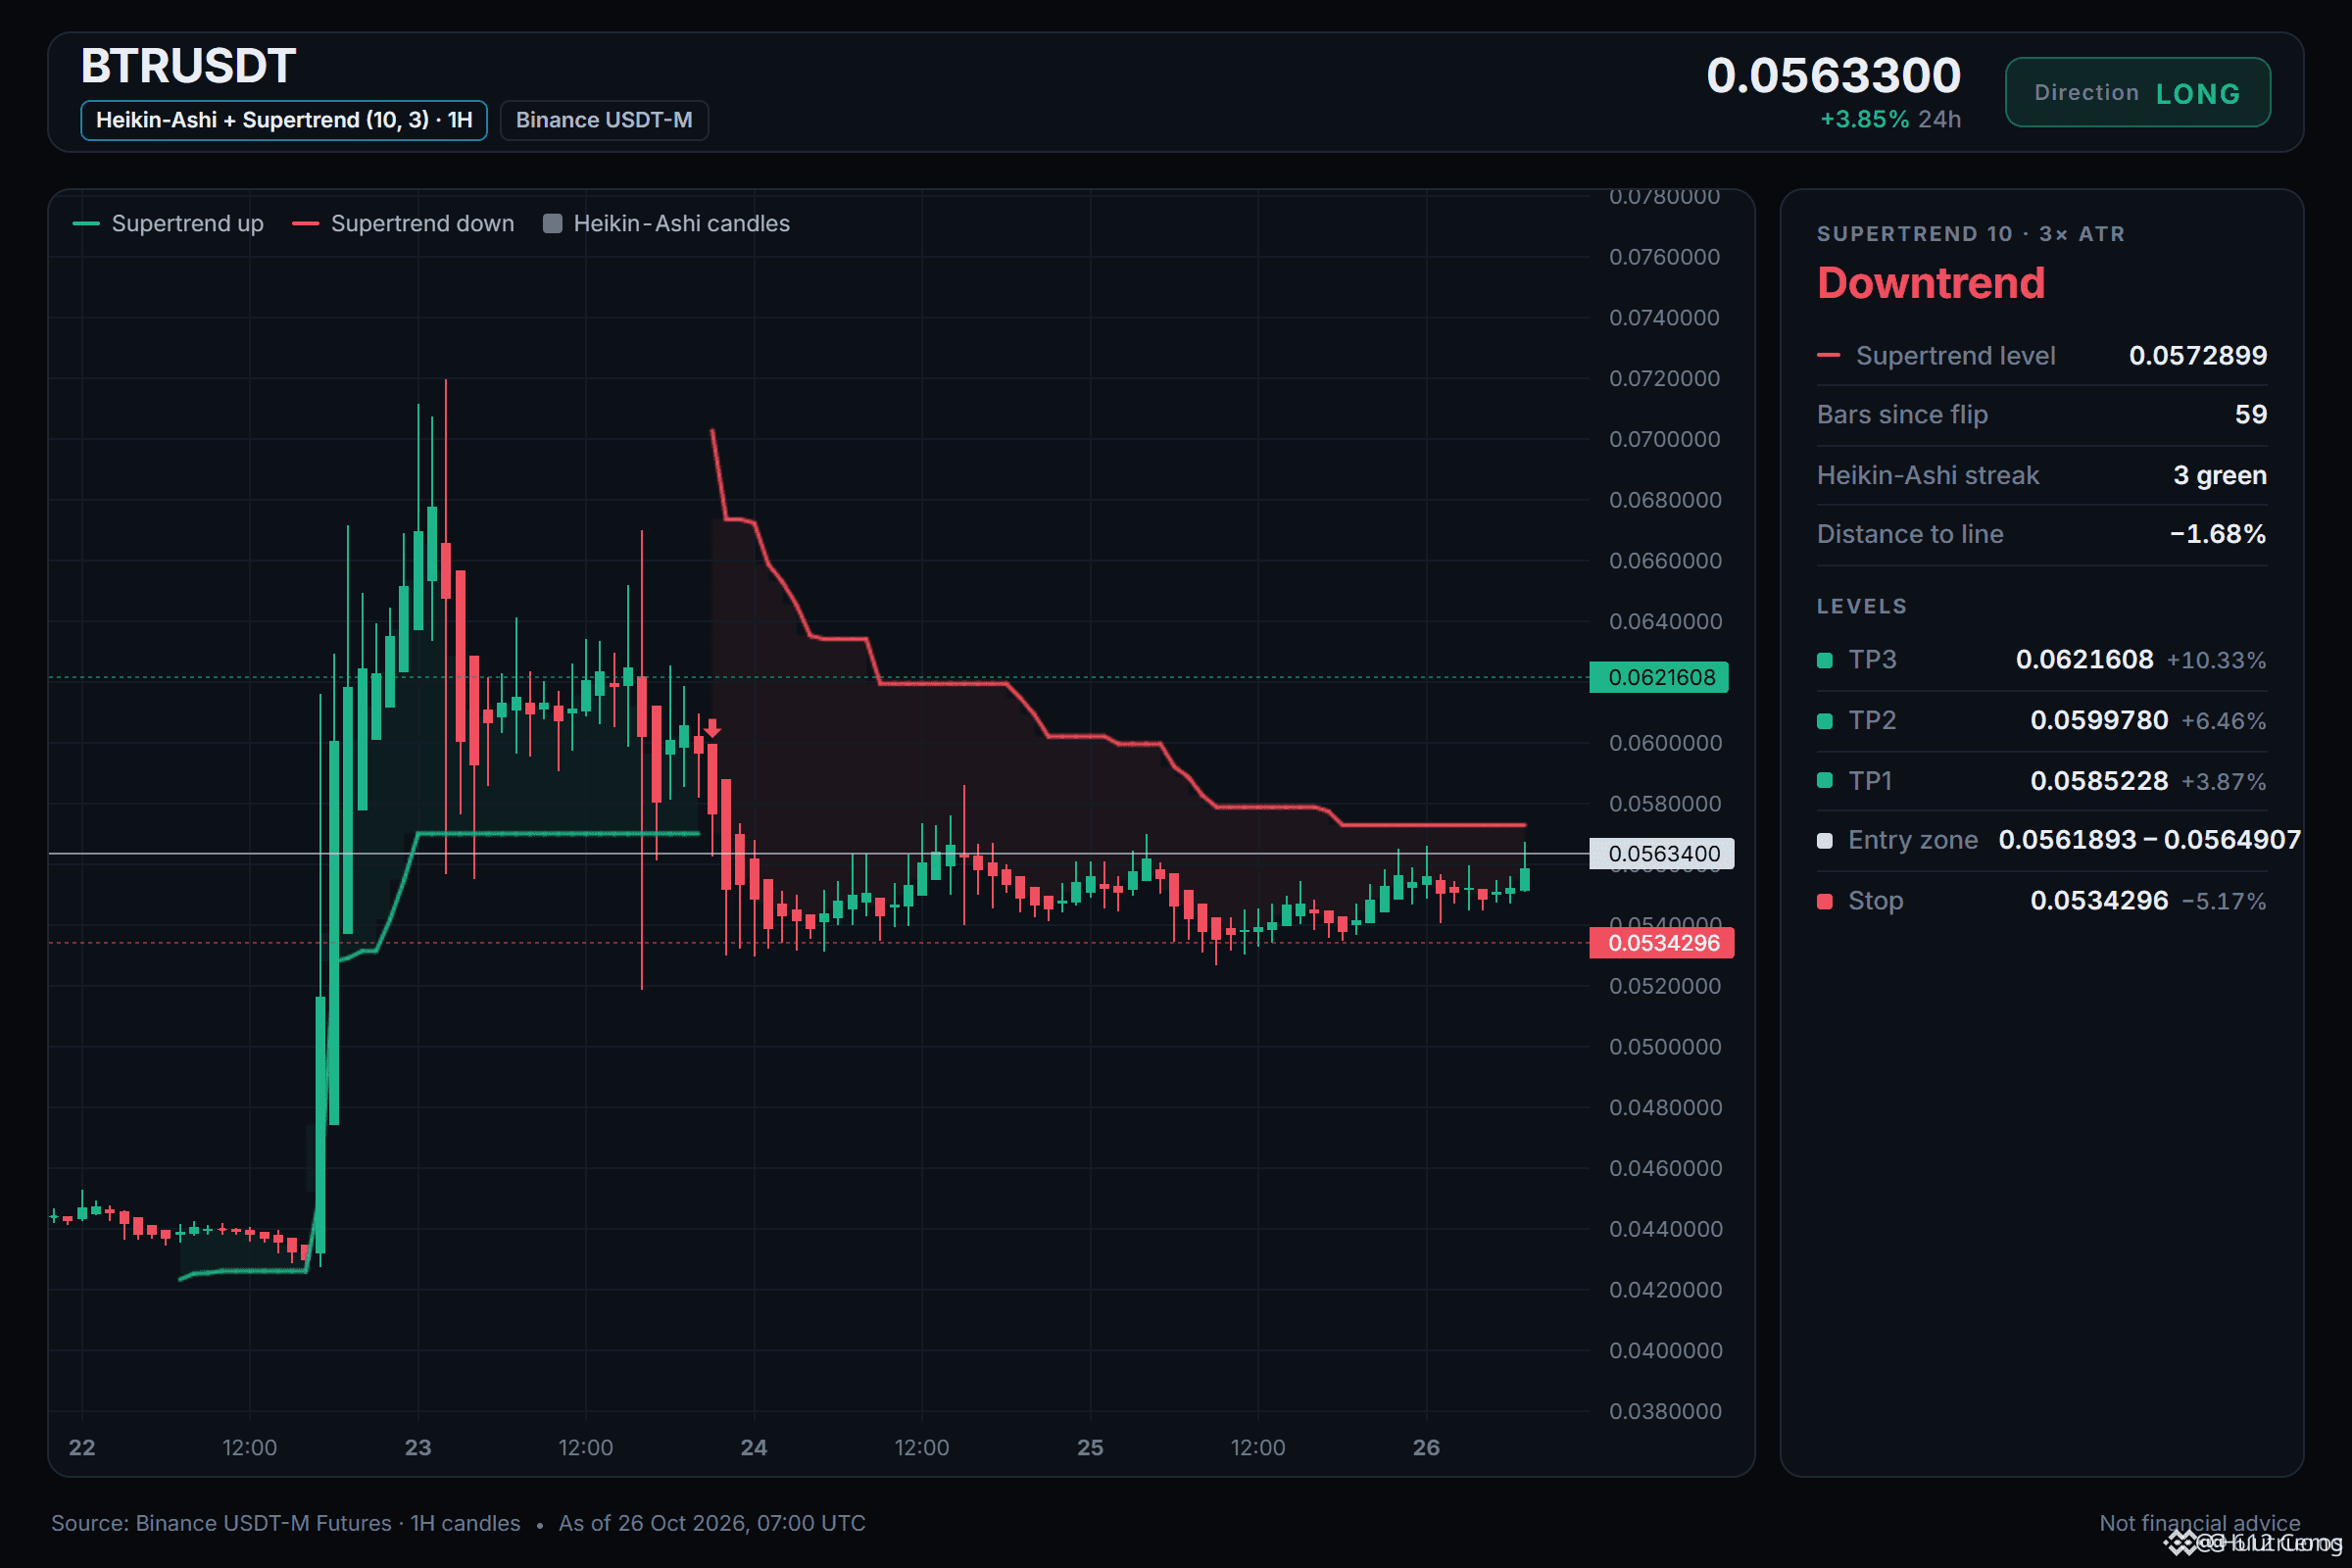
🟢 LONG $BTR /USDT: expecting price to go UP
Bias: LONG · Strong
Entry: 0.0561893 – 0.0564907
TP1: 0.0585228 (+3.9%)
TP2: 0.0599780 (+6.5%)
TP3: 0.0621608 (+10.3%)
SL: 0.0534296 (-5.2%)
Plan: enter only inside the zone, close 50% at TP1, 25% at TP2, 25% at TP3, and move the stop to entry after TP1.
Why LONG? 9/12 signals agree, 0 against.
• Daily trend up (above EMA50 & EMA200)
• 4h trend up (above EMA50 & EMA200)
• 1h trend up (above EMA50 & EMA200)
Q: Why go long when RSI is already 64.4?
A: The 1h RSI is 64.4, meaning buyers still have room to push.
Q: What if the daily trend reverses and traps longs?
A: The daily trend is bullish with price above EMA50 and EMA200.
What is your invalidation level for BTR ?
23
·
--
Bearish
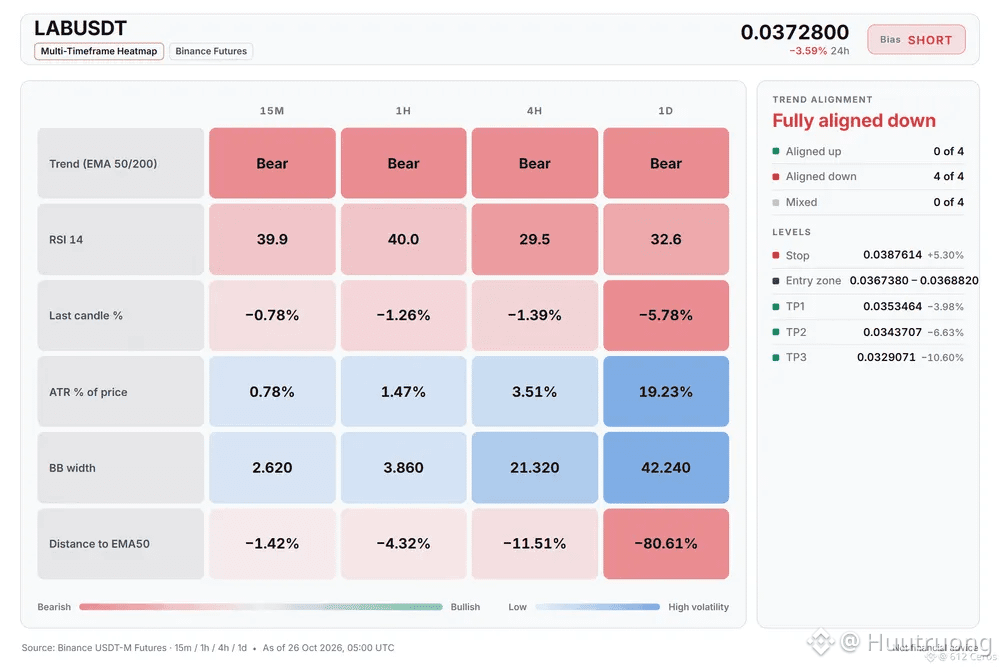
LAB is deep in a bearish stack across every trend
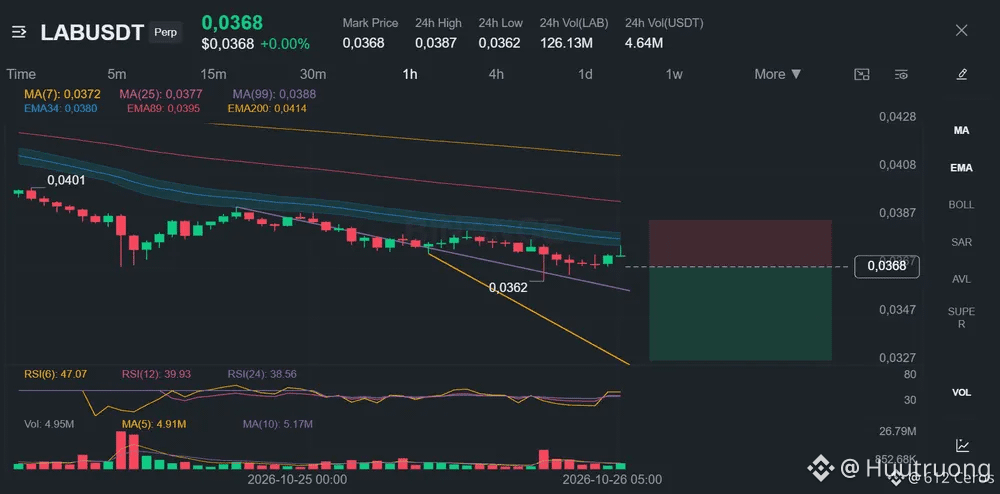
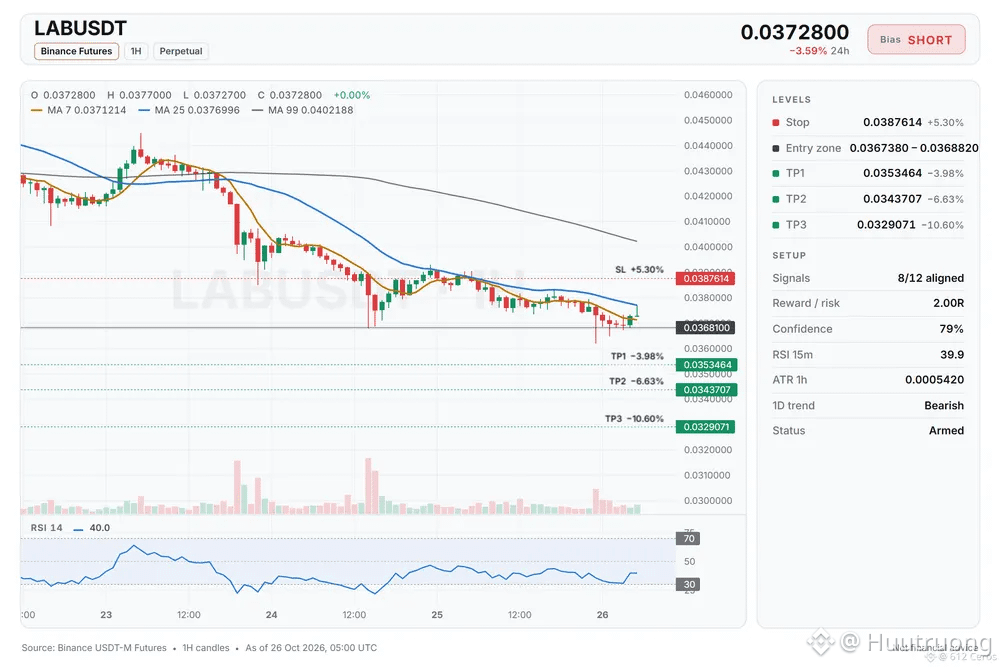
🔴 SHORT $LAB /USDT: expecting price to go DOWN
Bias: SHORT · Strong
Entry: 0.0367380 – 0.0368820
TP1: 0.0353464 (-4.0%)
TP2: 0.0343707 (-6.6%)
TP3: 0.0329071 (-10.6%)
SL: 0.0387614 (+5.3%)
Plan: enter only inside the zone, close 50% at TP1, 25% at TP2, 25% at TP3, and move the stop to entry after TP1.
Why SHORT? LAB checklist: 8/12 agree, 1 against.
• Daily trend down (below EMA50 & EMA200)
• 4h trend down (below EMA50 & EMA200)
• 1h trend down (below EMA50 & EMA200)
Watch: Far below its average, bounce likely (−3.1 ATR from 1h EMA50)
Watch: The idea is wrong if price reaches the stop at 0.0387614
Bottom line: The daily bearish stack (price below both EMAs) is the strongest sign, but price is 3.1 ATR below the 1h EMA50, which means a bounce is likely
Where is your invalidation level if this short fails?
10
·
--
Bearish
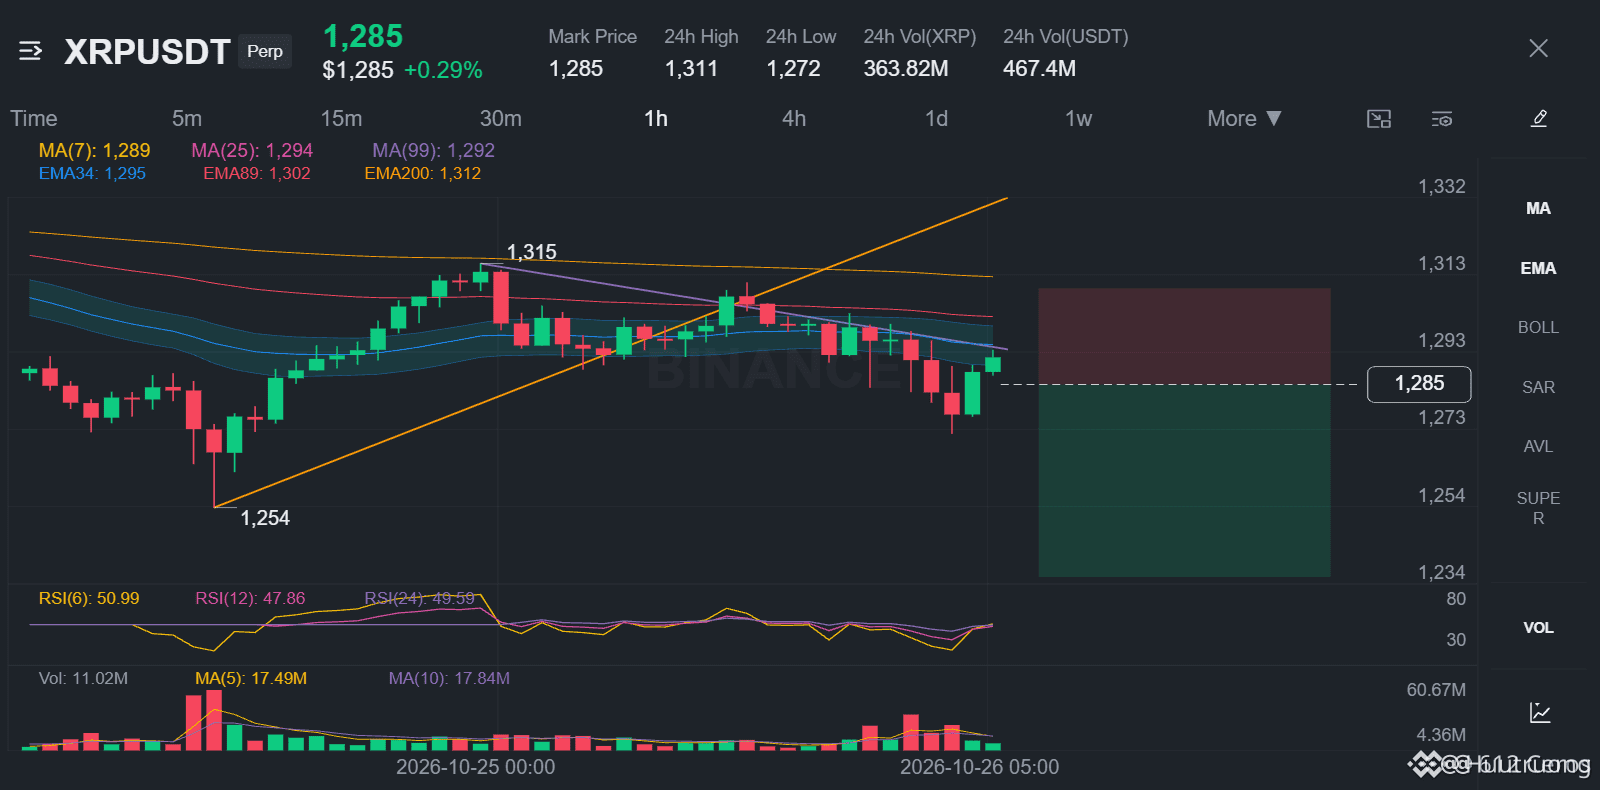
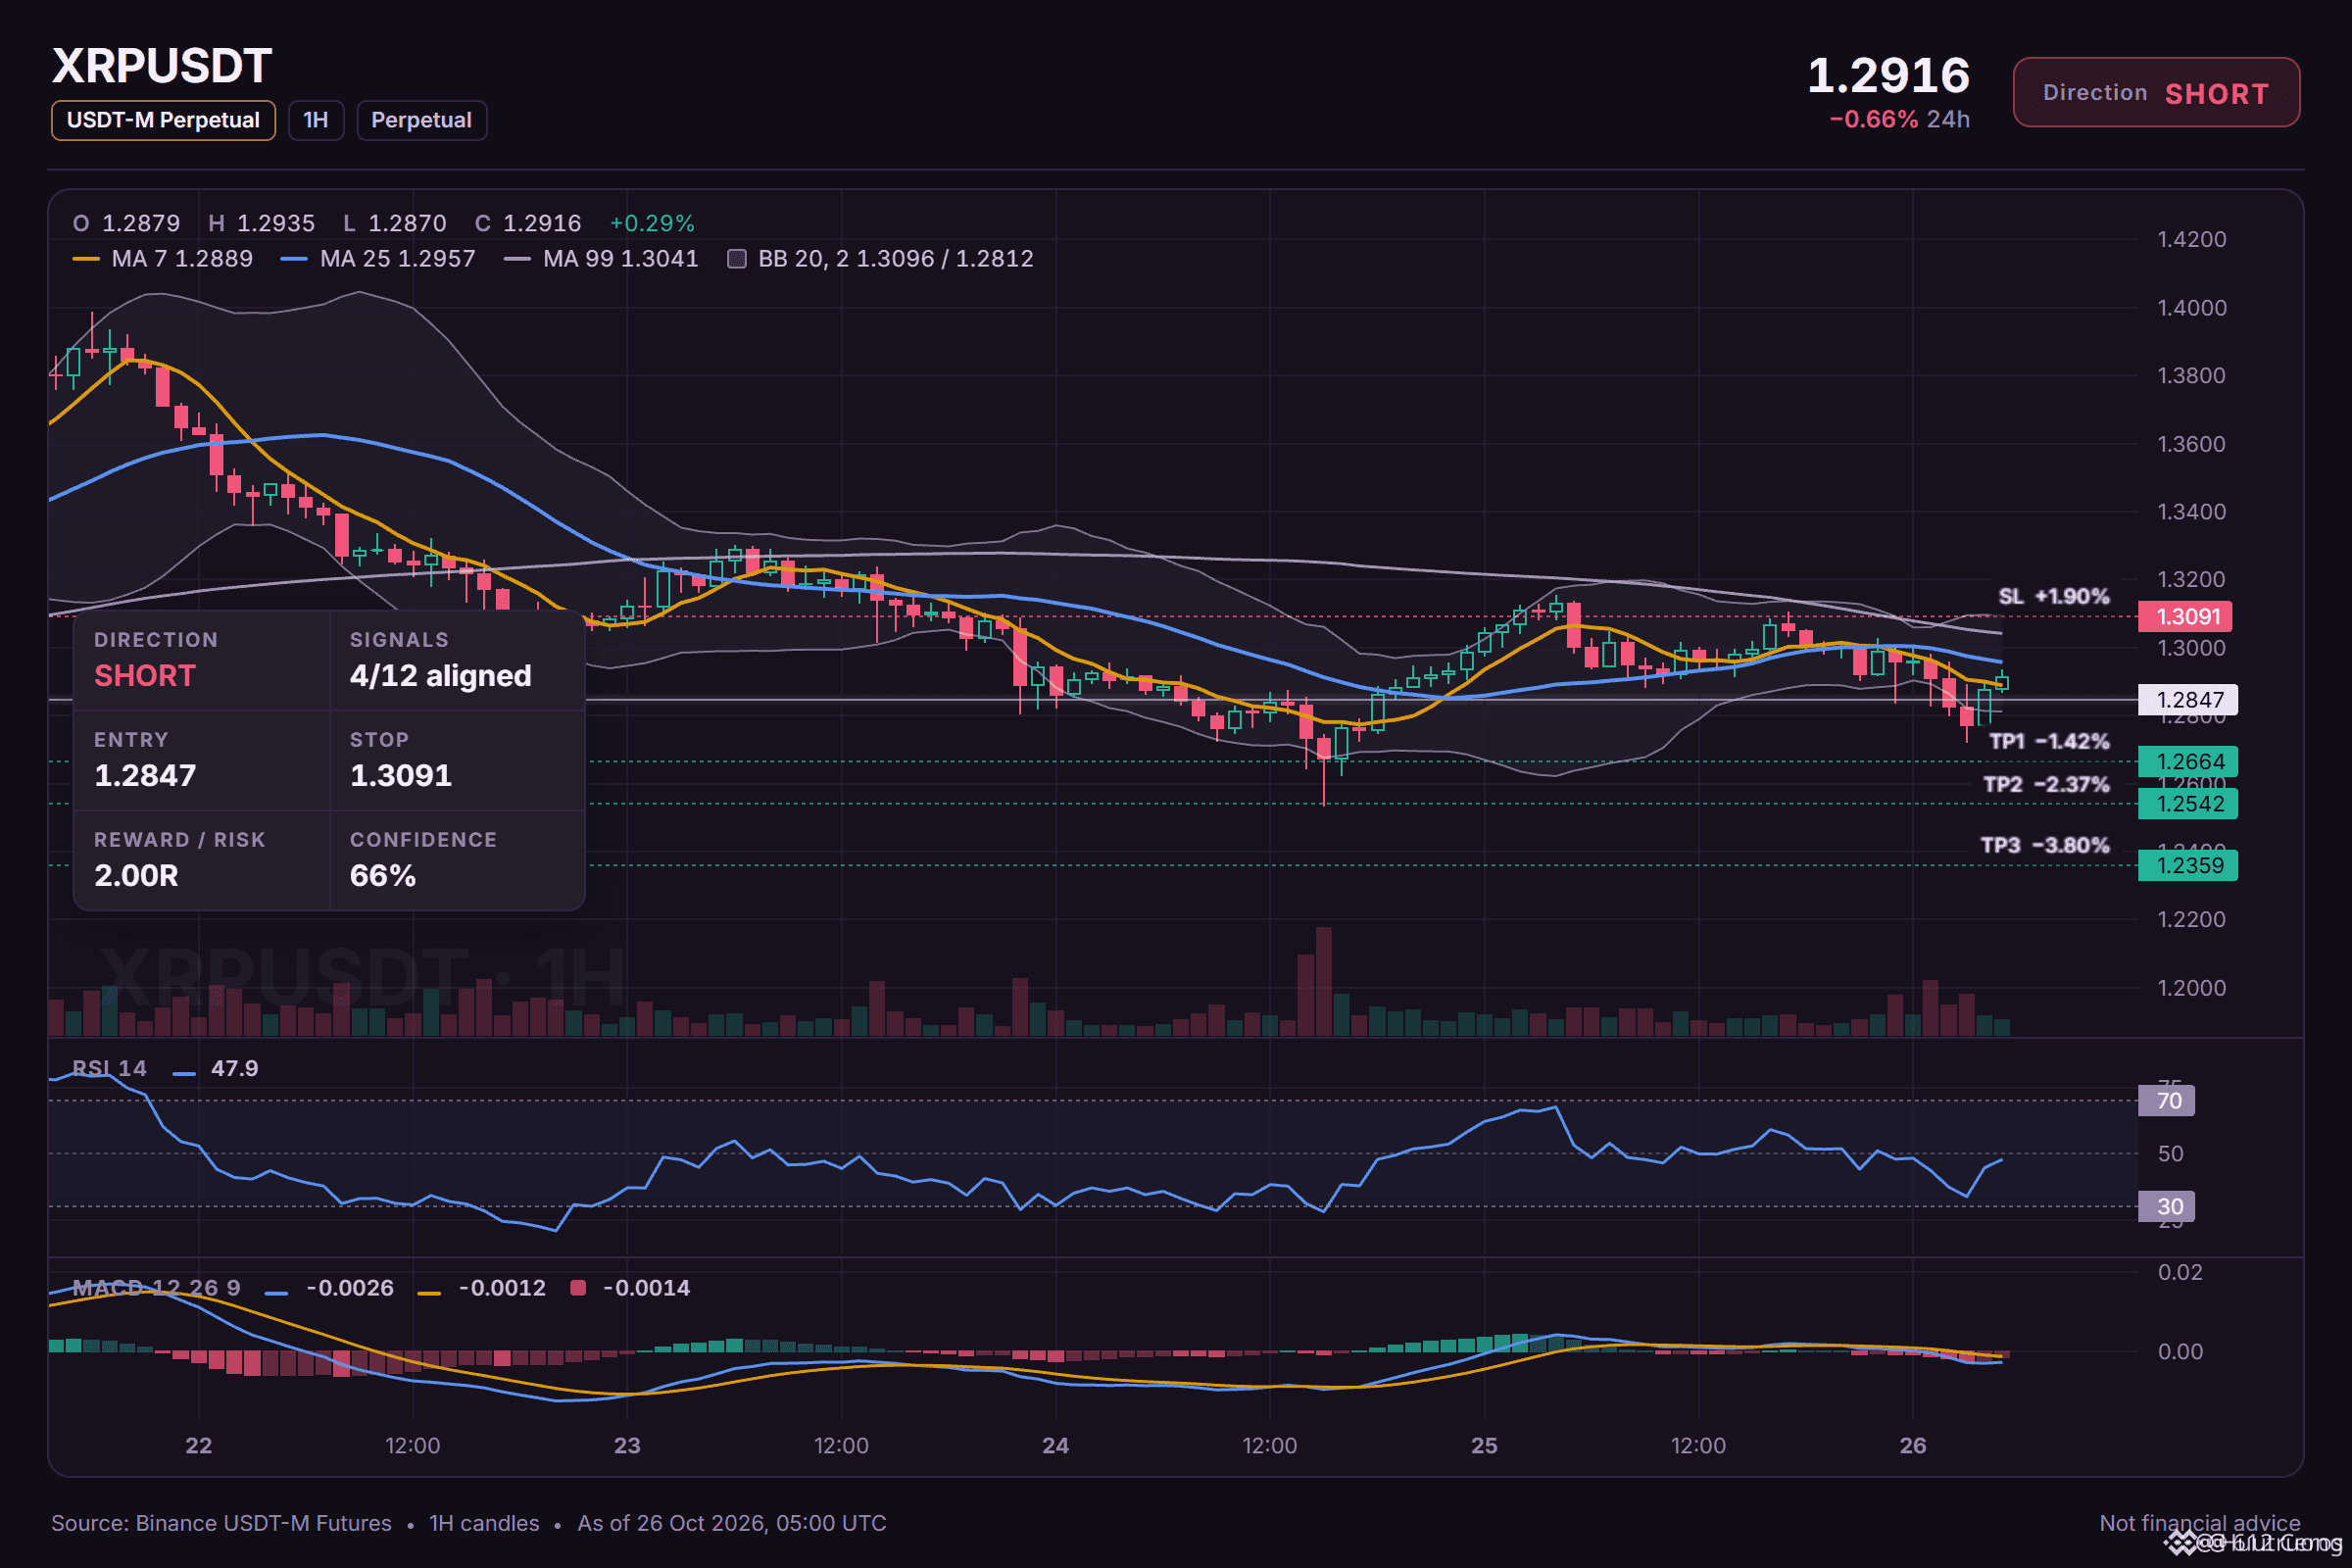
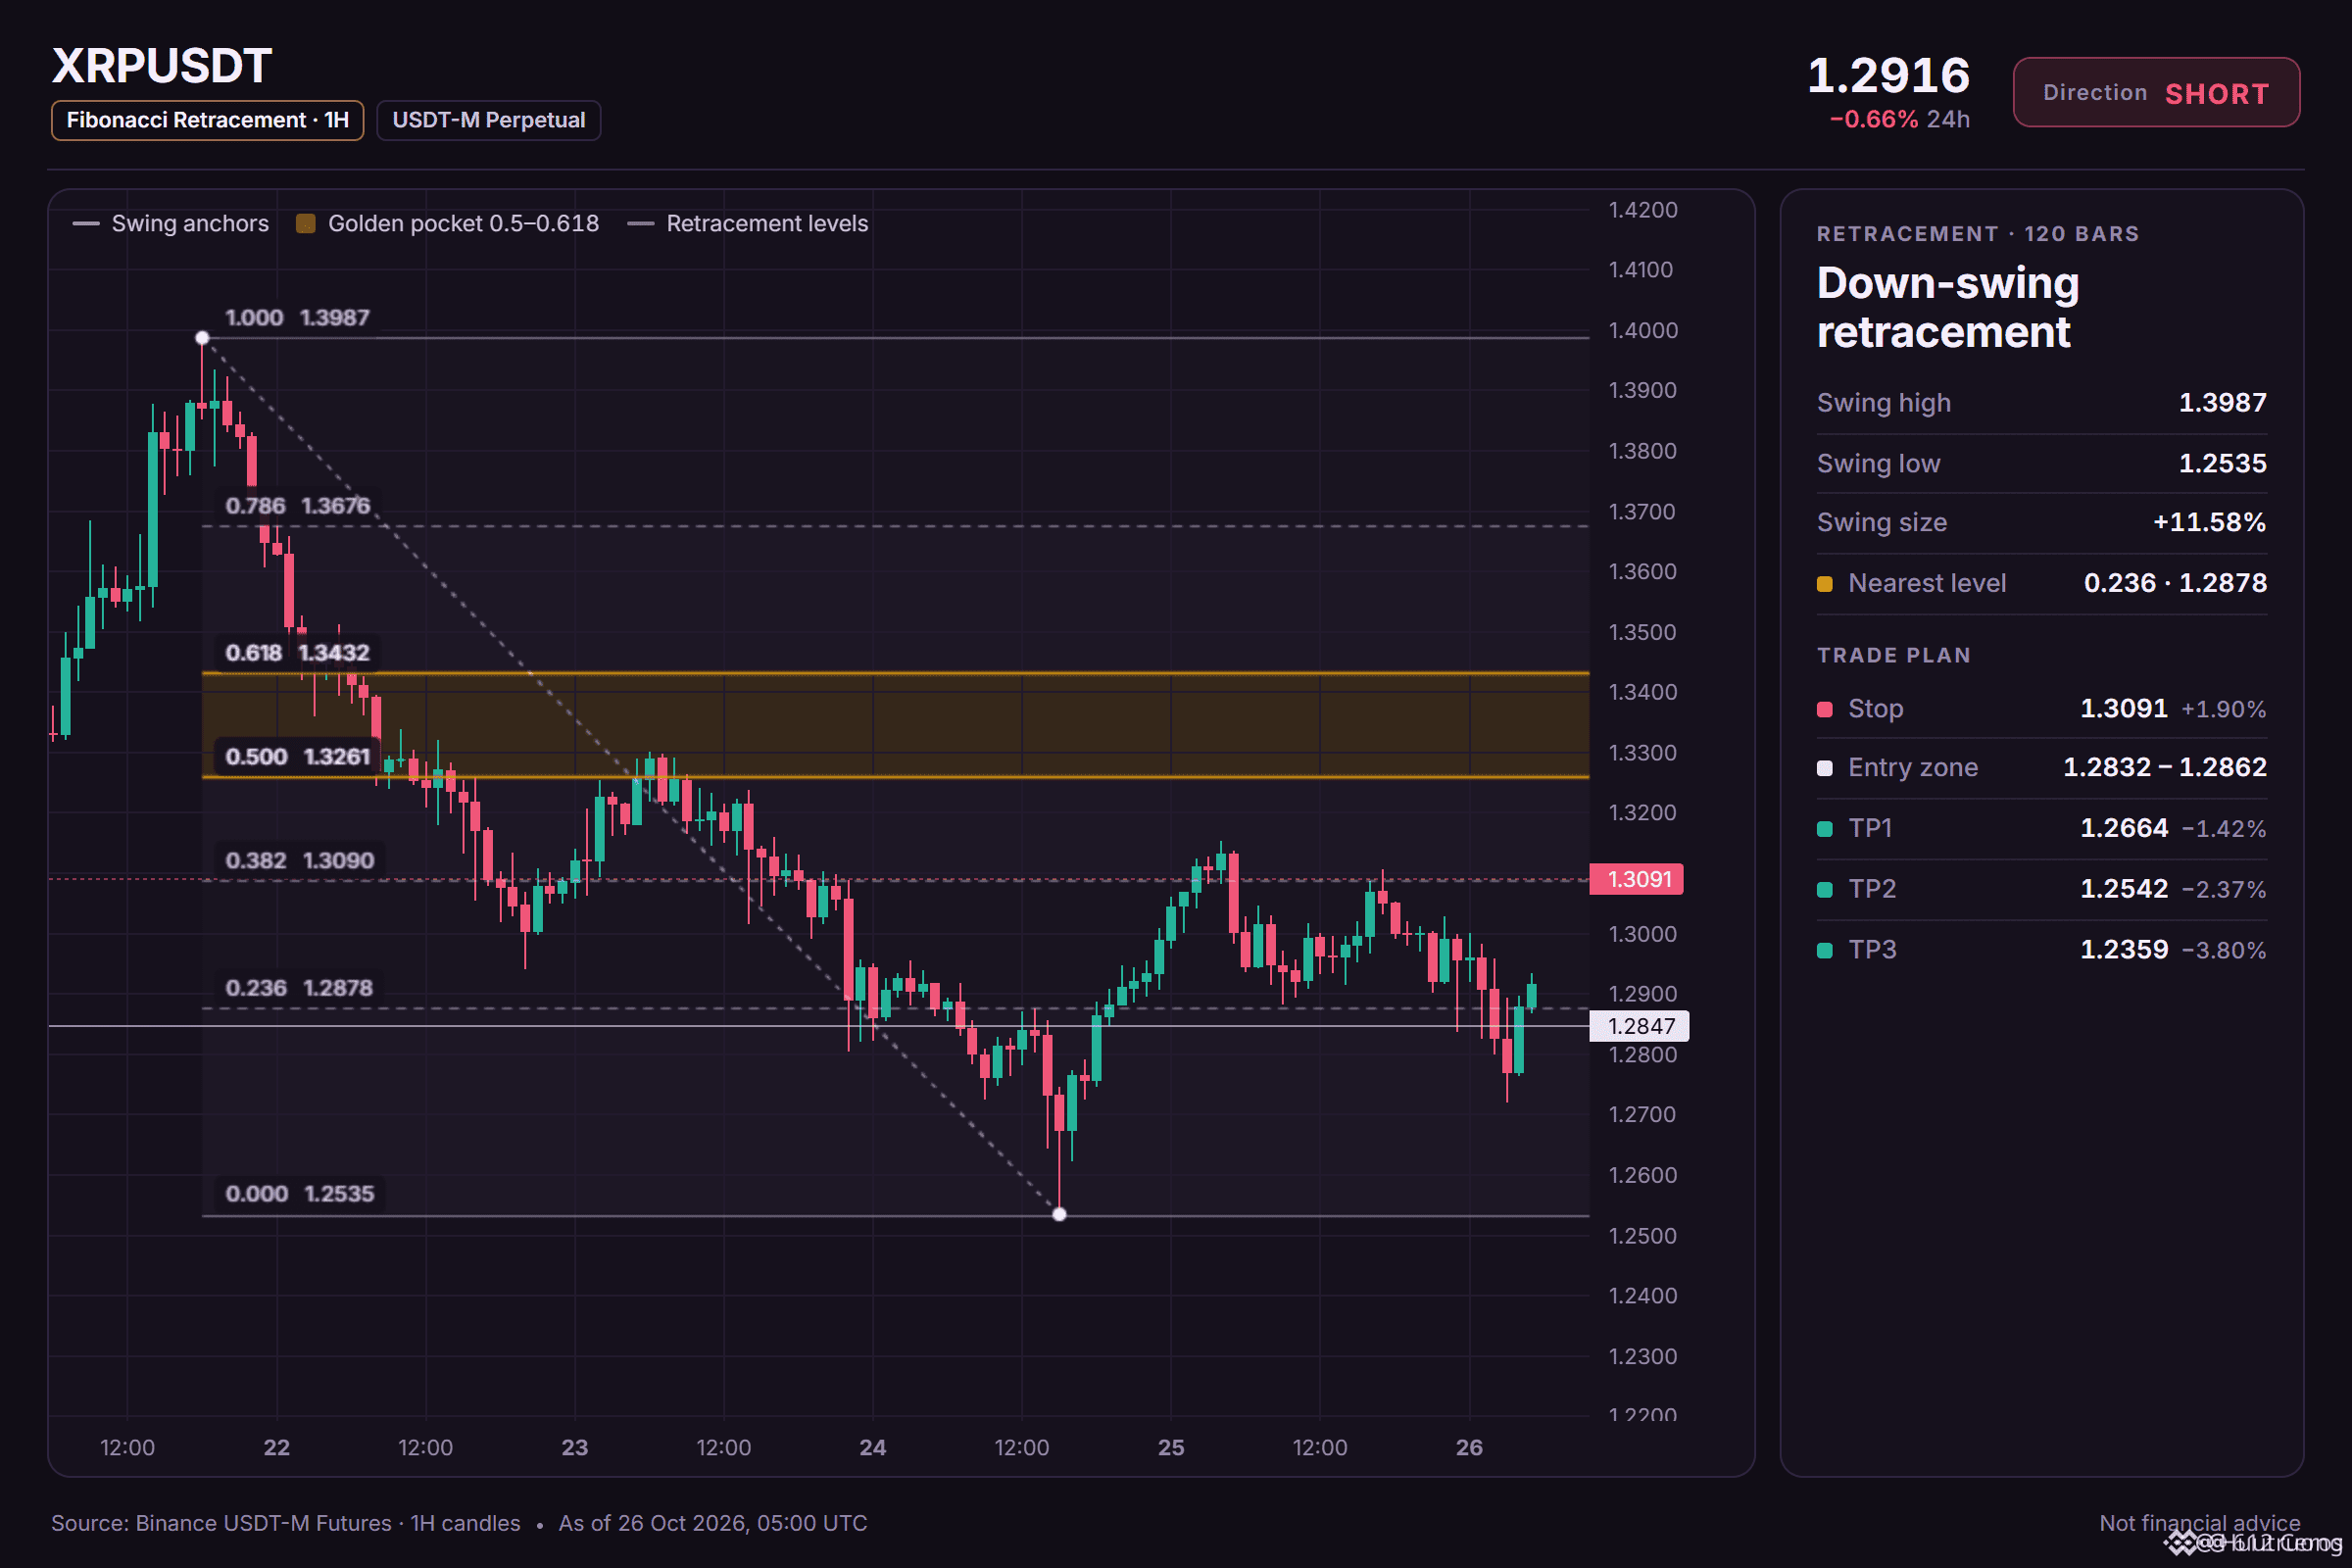
XRP stays below a stacked EMA ribbon on the 4h
🔴 SHORT $XRP /USDT: expecting price to go DOWN
Bias: SHORT · Leaning
Entry: 1.2832 – 1.2862
TP1: 1.2664 (-1.4%)
TP2: 1.2542 (-2.4%)
TP3: 1.2359 (-3.8%)
SL: 1.3091 (+1.9%)
Plan: enter only inside the zone, close 50% at TP1, 25% at TP2, 25% at TP3, and move the stop to entry after TP1.
Note: moderate conviction only, keep size light.
Why SHORT? 4/12 signals agree, 0 against.
• 4h trend down (below EMA50 & EMA200)
• 1h trend down (below EMA50 & EMA200)
• Sellers are driving the move (15m ADX 25.8)
The short version:
1. the 4h trend shows price below EMA50 and EMA200, a bearish stack suggesting the swing is down.
2. the 1h trend also has price below EMA50 and EMA200, so the short-term trend is down too.
3. the 4h RSI sits at 38.1, bearish momentum below 45, but the daily range makes the move less decisive.
Where would you set your level if you disagreed?
8
·
--
Bearish
Range-bound coins often trap longs into fading moves.
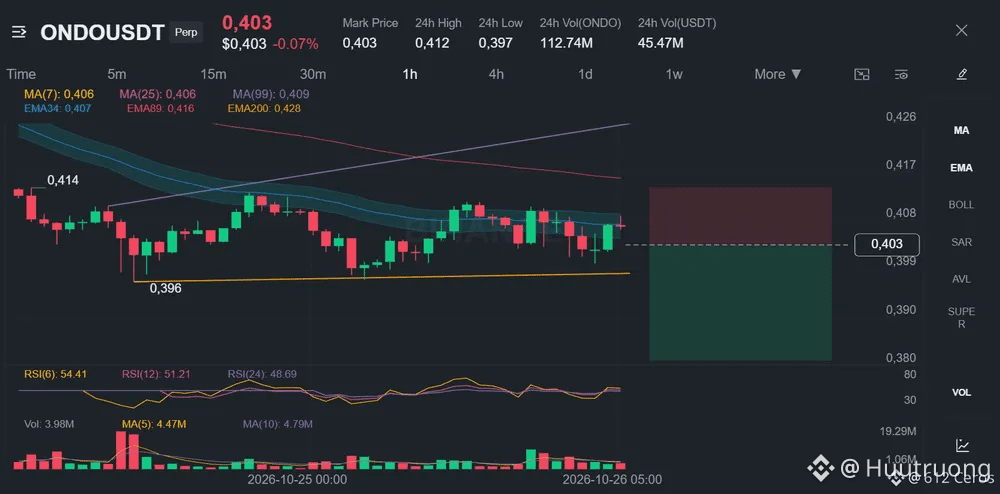
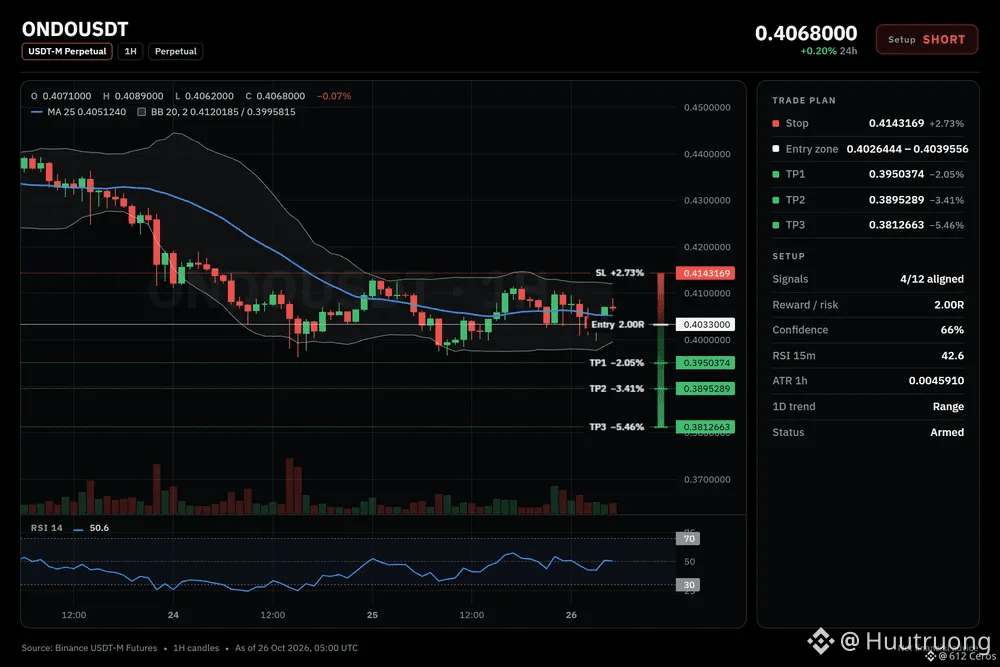
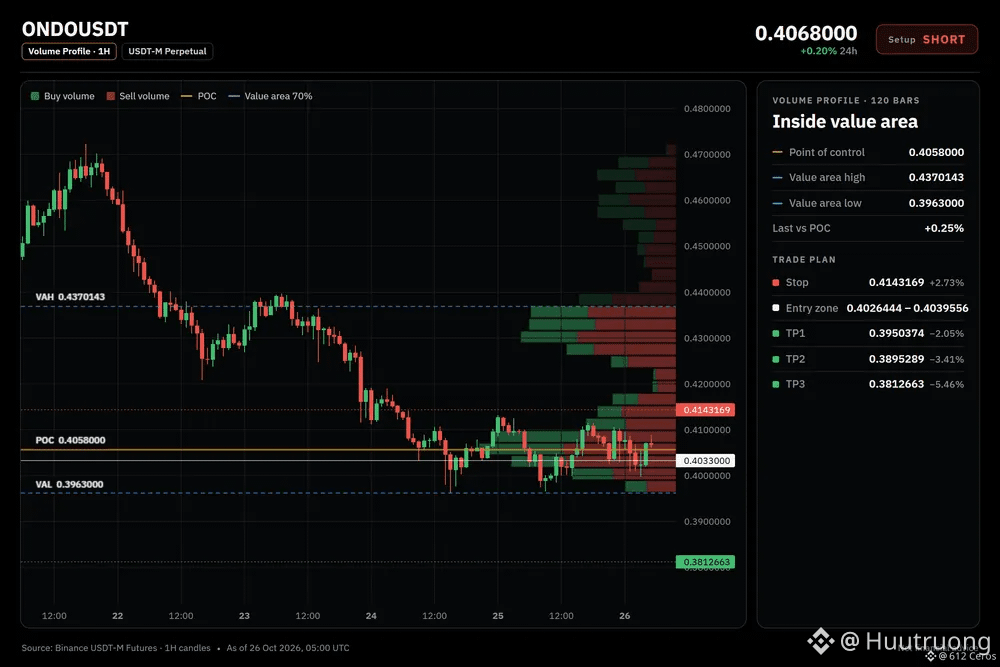
🔴 SHORT $ONDO /USDT: expecting price to go DOWN
Bias: SHORT · Leaning
Entry: 0.4026444 – 0.4039556
TP1: 0.3950374 (-2.0%)
TP2: 0.3895289 (-3.4%)
TP3: 0.3812663 (-5.5%)
SL: 0.4143169 (+2.7%)
Plan: enter only inside the zone, close 50% at TP1, 25% at TP2, 25% at TP3, and move the stop to entry after TP1.
Note: moderate conviction only, keep size light.
Why SHORT? 4/12 signals agree, 0 against.
• 4h trend down (below EMA50 & EMA200)
• 1h trend down (below EMA50 & EMA200)
• Sellers are driving the move (15m ADX 20.9)
Bear path:
If the 4h trend holds with price below the EMA stack, the 1h price may continue sliding toward the first target. The daily trend being range means the move could stay contained.
What kills it:
If the 1h price reclaims the entry level at 0.4039556, the bearish structure breaks and I would exit the short.
Where do you want to see price before shorting?
9
·
--
Bearish
The 4h stack is bearish across every timeframe.
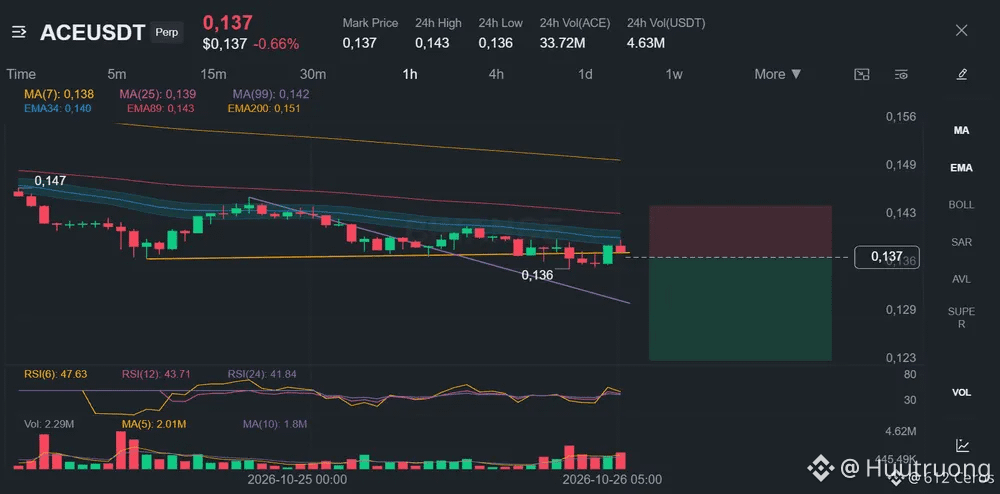
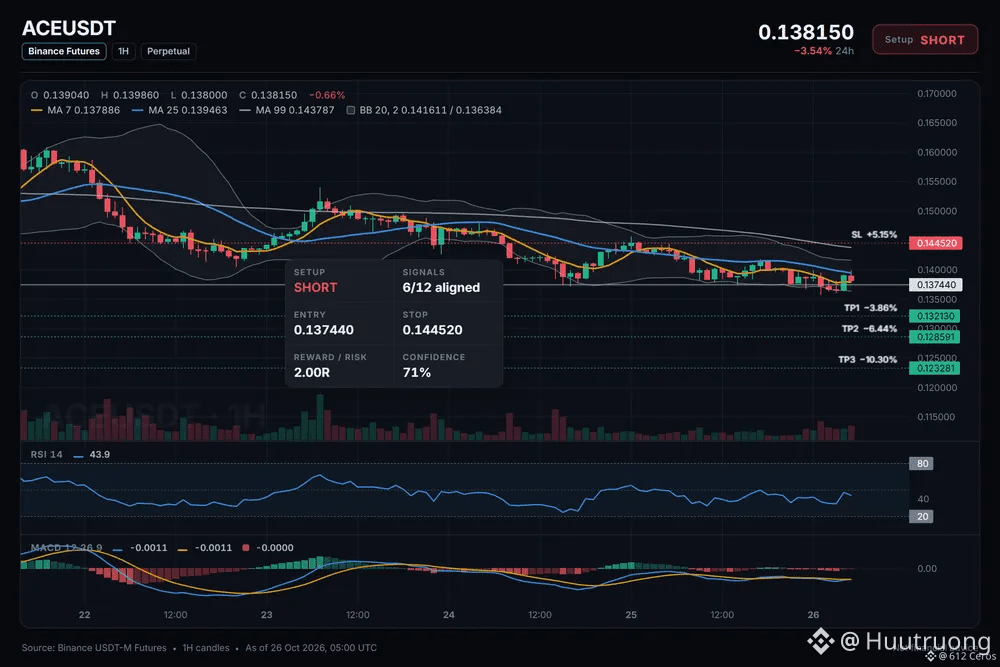
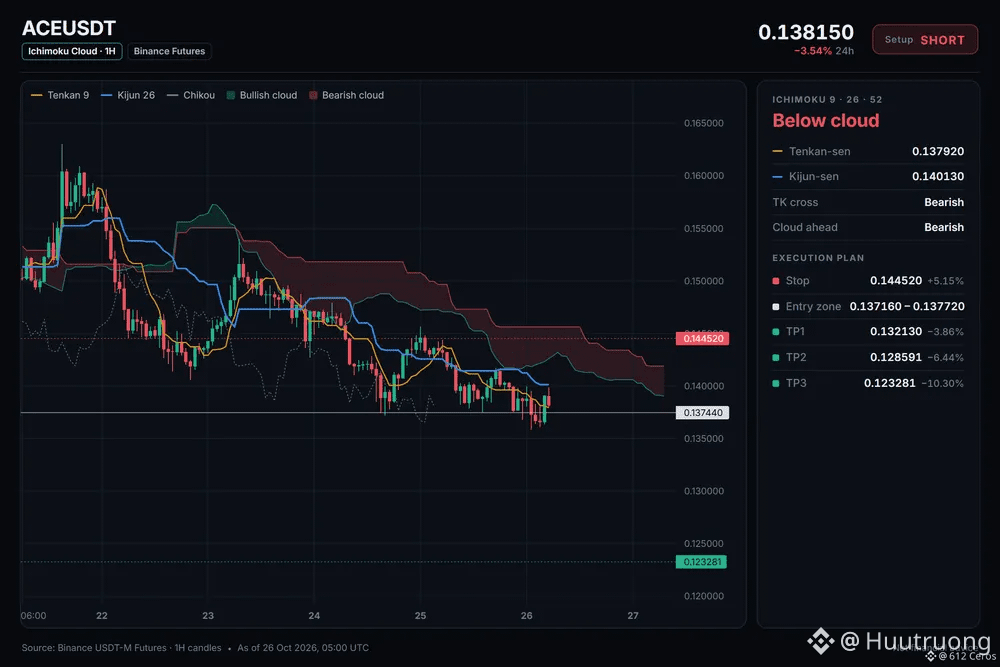
🔴 SHORT $ACE /USDT: expecting price to go DOWN
Bias: SHORT · Strong
Entry: 0.137160 – 0.137720
TP1: 0.132130 (-3.9%)
TP2: 0.128591 (-6.4%)
TP3: 0.123281 (-10.3%)
SL: 0.144520 (+5.2%)
Plan: enter only inside the zone, close 50% at TP1, 25% at TP2, 25% at TP3, and move the stop to entry after TP1.
Why SHORT? 6/12 signals agree, 0 against.
• 4h trend down (below EMA50 & EMA200)
• 1h trend down (below EMA50 & EMA200)
• Sellers have the momentum (4h RSI 33.9)
My read on ACE today
I'm watching a short setup on ACE. The 1h price is 0.137440, and the daily trend is a range, so the move is driven by the 4h bearish stack. I want to see the daily trend stay in range while the 4h stack holds.
Where is your invalidation level for this trade?
8
·
--
Bearish
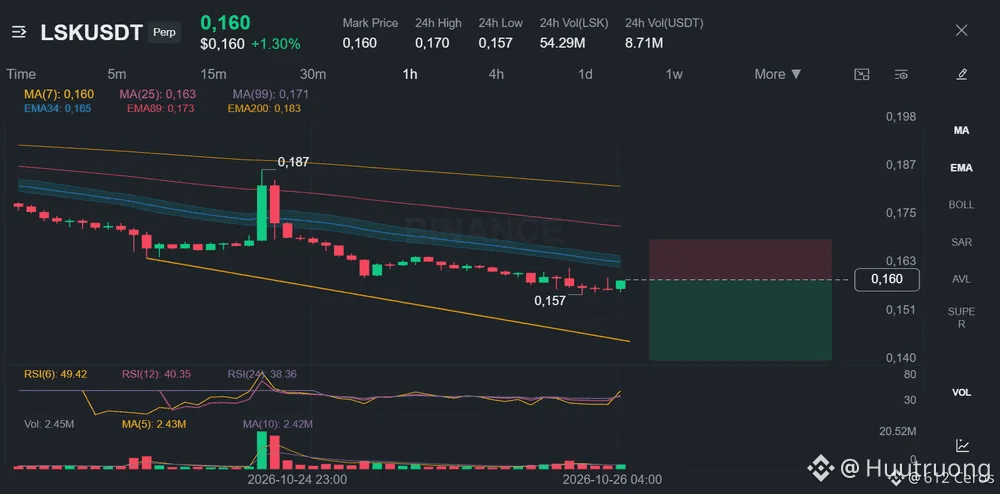
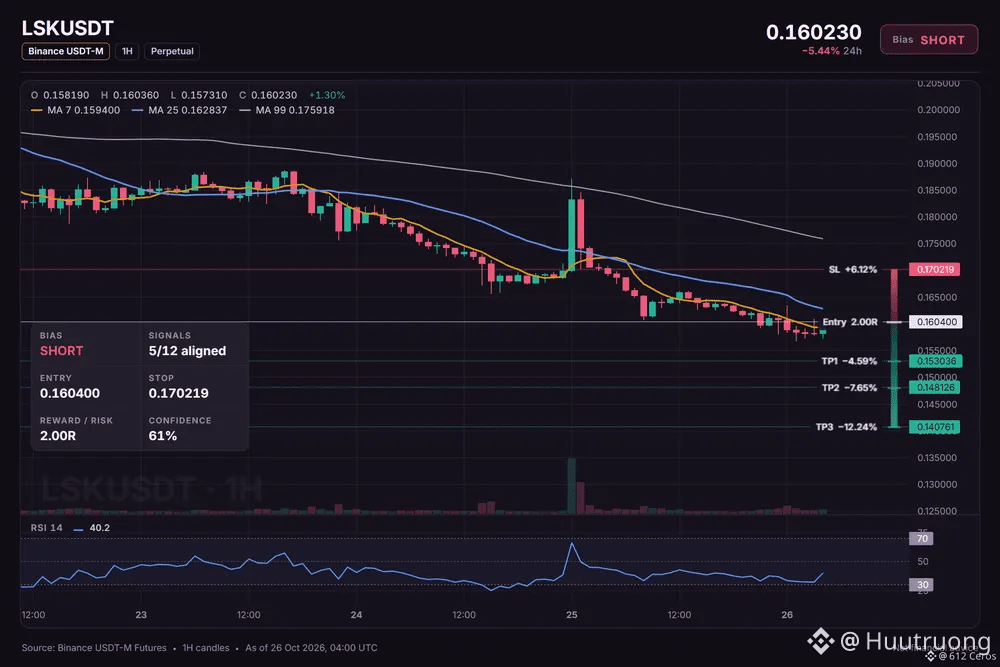
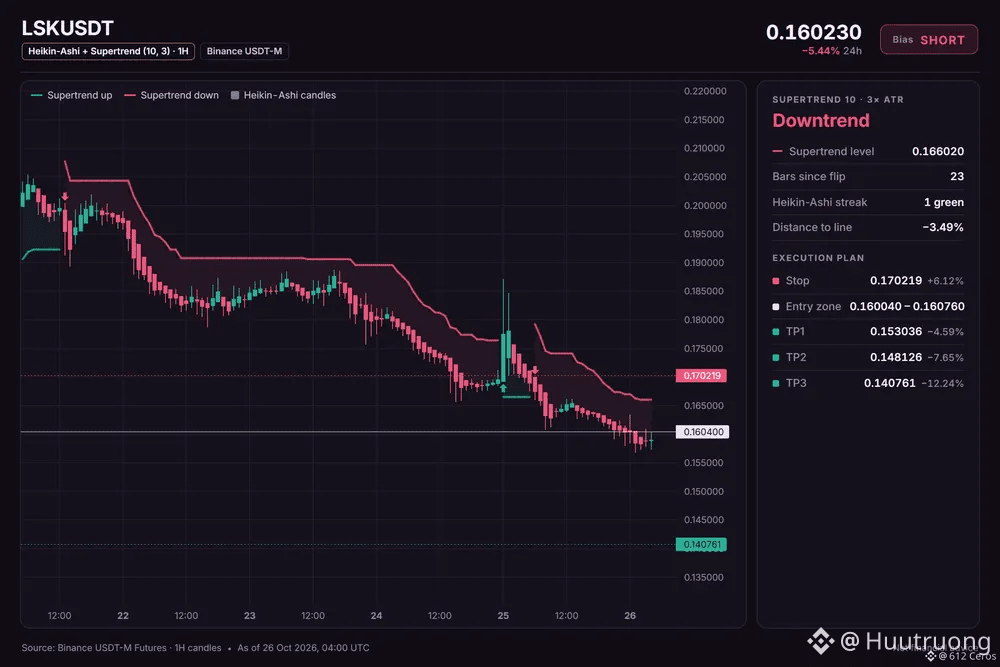
🔴 SHORT $LSK /USDT: expecting price to go DOWN
Bias: SHORT · Leaning
Entry: 0.160040 – 0.160760
TP1: 0.153036 (-4.6%)
TP2: 0.148126 (-7.7%)
TP3: 0.140761 (-12.2%)
SL: 0.170219 (+6.1%)
Plan: enter only inside the zone, close 50% at TP1, 25% at TP2, 25% at TP3, and move the stop to entry after TP1.
Note: moderate conviction only, keep size light.
LSK looks weak but buyers are fighting back now
Why SHORT? 5/12 signals agree, 2 against.
• 4h trend down (below EMA50 & EMA200)
• 1h trend down (below EMA50 & EMA200)
• Sellers have the momentum (1h RSI 40.2)
Risk: Price is washed out, bounces are common from here (4h RSI 24.4, oversold)
The 4h trend is bearish and the 1h RSI is below 45, but the 15m RSI shows buyers in control, so conviction is moderate.
What is your invalidation level if you are in this trade?
6
·
--
Bearish
PORTAL short setup: the levels I'm watching
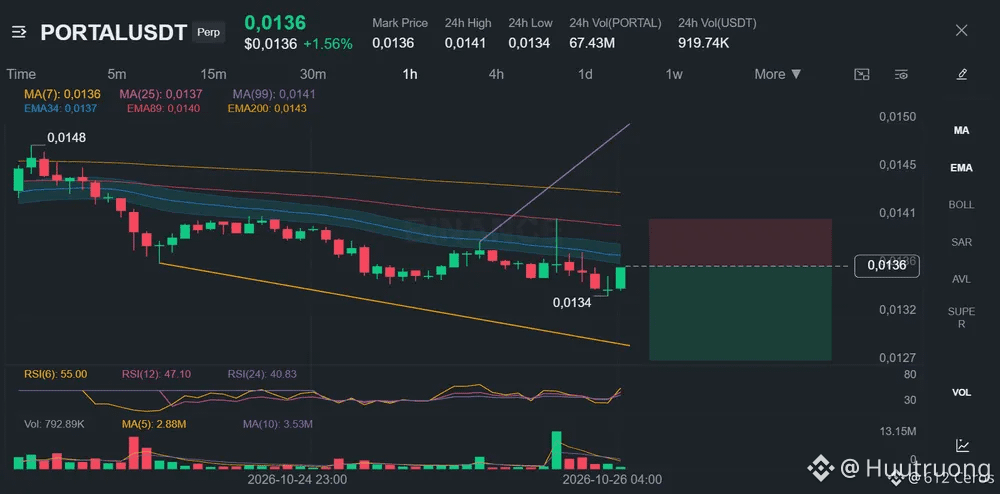
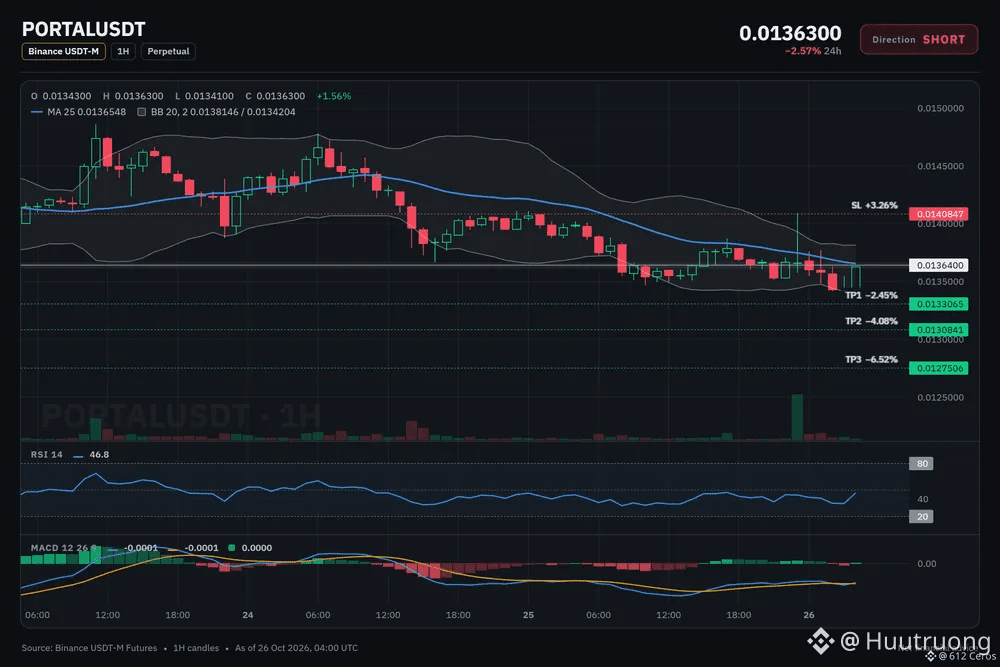
🔴 SHORT $PORTAL /USDT: expecting price to go DOWN
Bias: SHORT · Leaning
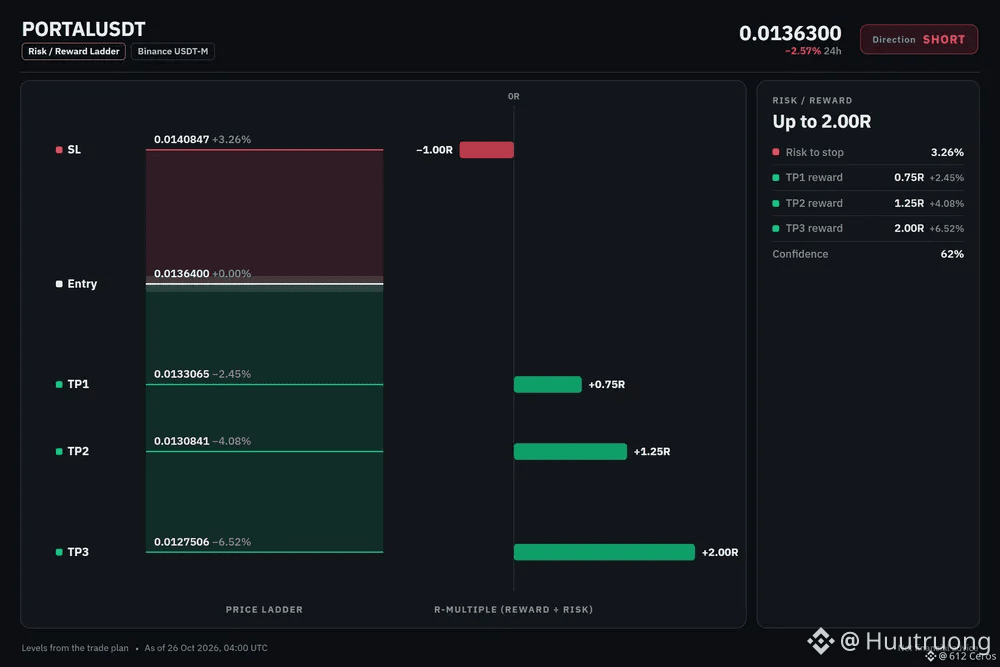
Entry: 0.0136135 – 0.0136665
TP1: 0.0133065 (-2.4%)
TP2: 0.0130841 (-4.1%)
TP3: 0.0127506 (-6.5%)
SL: 0.0140847 (+3.3%)
Plan: enter only inside the zone, close 50% at TP1, 25% at TP2, 25% at TP3, and move the stop to entry after TP1.
Note: moderate conviction only, keep size light.
Why SHORT? 4/12 signals agree, 1 against.
• 4h trend down (below EMA50 & EMA200)
• 1h trend down (below EMA50 & EMA200)
• Sellers have the momentum (4h RSI 34.9)
Risk: Buyers are pushing right now (+0.74% 15m candle)
In plain words:
The daily trend reads range, and 4/12 signals aligned favour the short side. The plan is to work the 0.0136135 – 0.0136665 zone, scale out at 0.0133065 and 0.0130841, and stay patient for 0.0127506. A move through 0.0140847 means the idea is wrong and the stop does its job.
Does PORTAL tag 0.0133065 first, or the stop?
7
·
--
Bullish
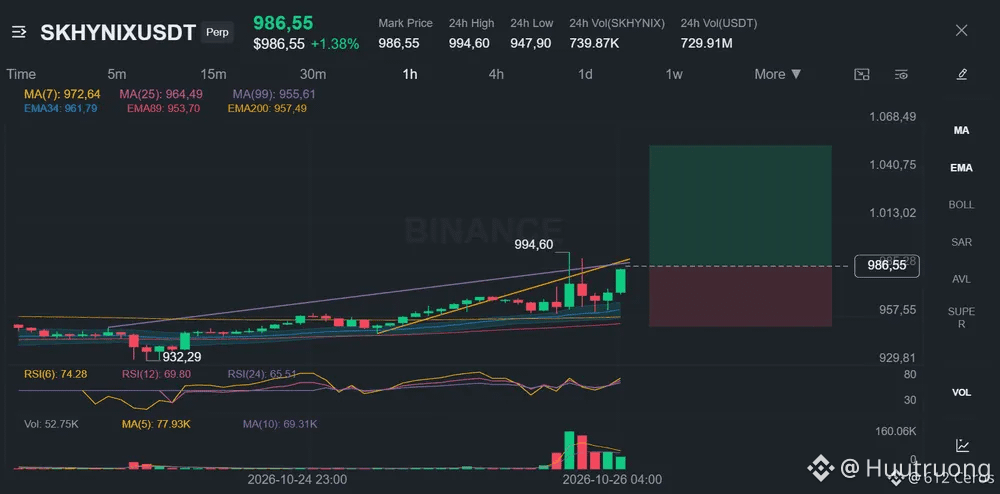
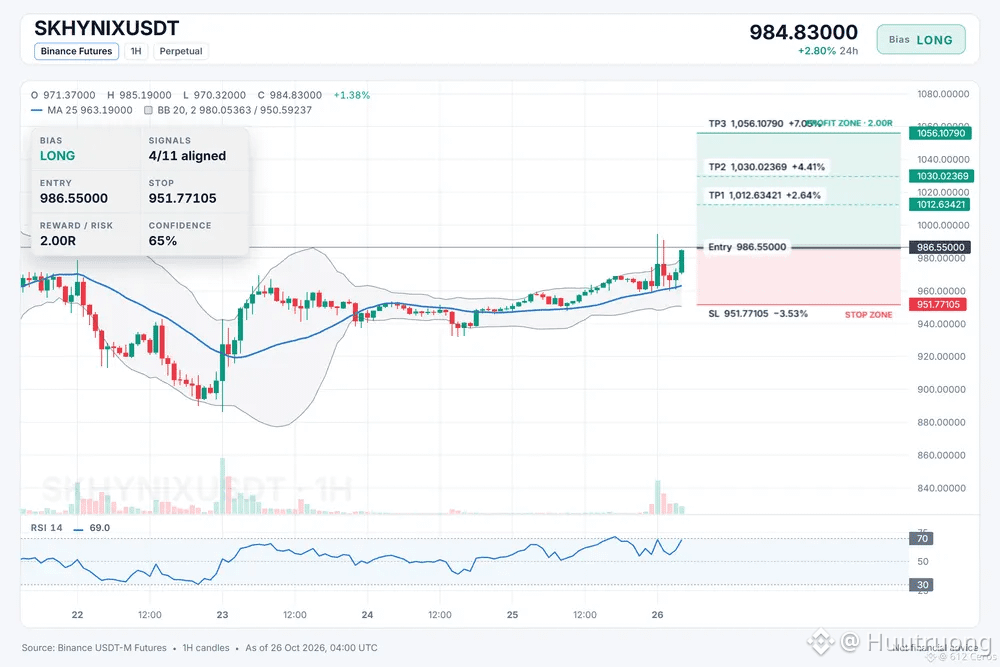
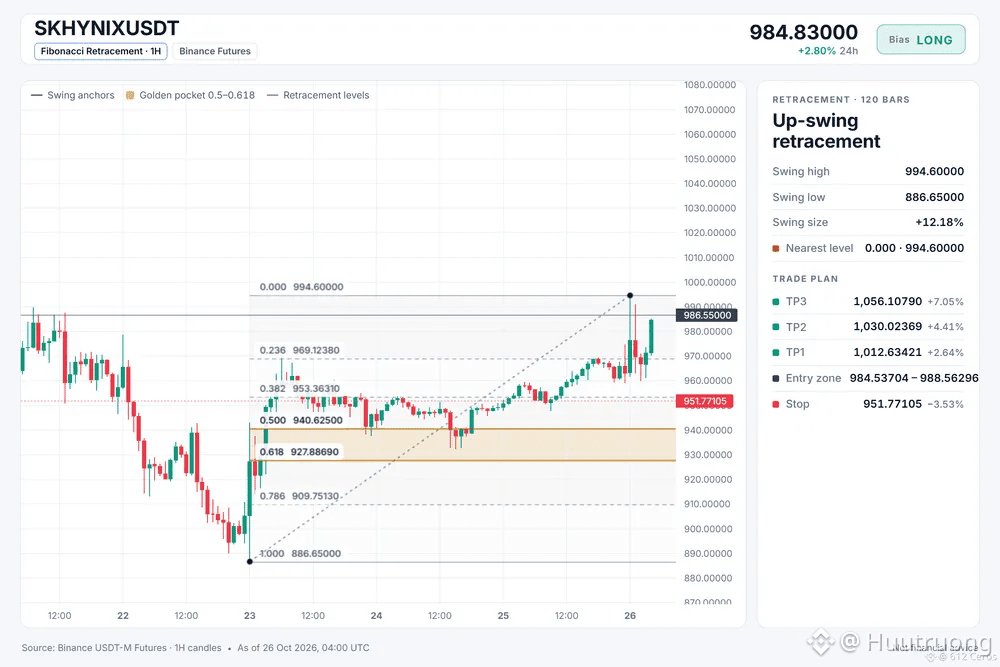
SKHYNIX looks stretched above its 1h EMA stack
🟢 LONG $SKHYNIX /USDT: expecting price to go UP
Bias: LONG · Leaning
Entry: 984.53704 – 988.56296
TP1: 1012.63421 (+2.6%)
TP2: 1030.02369 (+4.4%)
TP3: 1056.10790 (+7.1%)
SL: 951.77105 (-3.5%)
Plan: enter only inside the zone, close 50% at TP1, 25% at TP2, 25% at TP3, and move the stop to entry after TP1.
Note: moderate conviction only, keep size light.
Why LONG? 4/11 signals agree, 0 against.
• 1h trend up (above EMA50 & EMA200)
• Buyers have the momentum (4h RSI 59.1)
• Buyers have the momentum (1h RSI 69.0)
Bull path:
If the 1h trend holds above the EMA200, price could reach the first target, where the 1h RSI shows buyers still have momentum.
What kills it:
If price breaks the stop loss at the entry low, the daily range regime likely means this setup was wrong, so I would exit.
Where do you set your invalidation for this trade?
1
·
--
Bearish
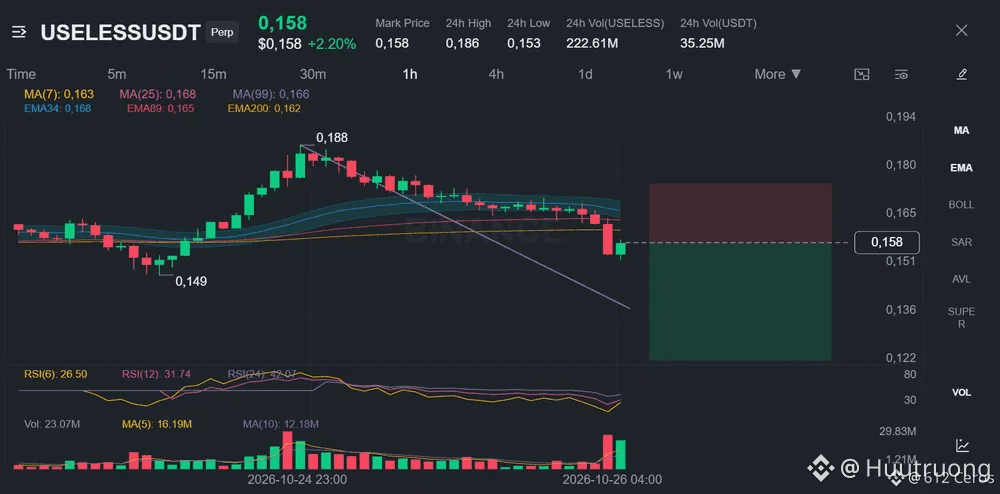
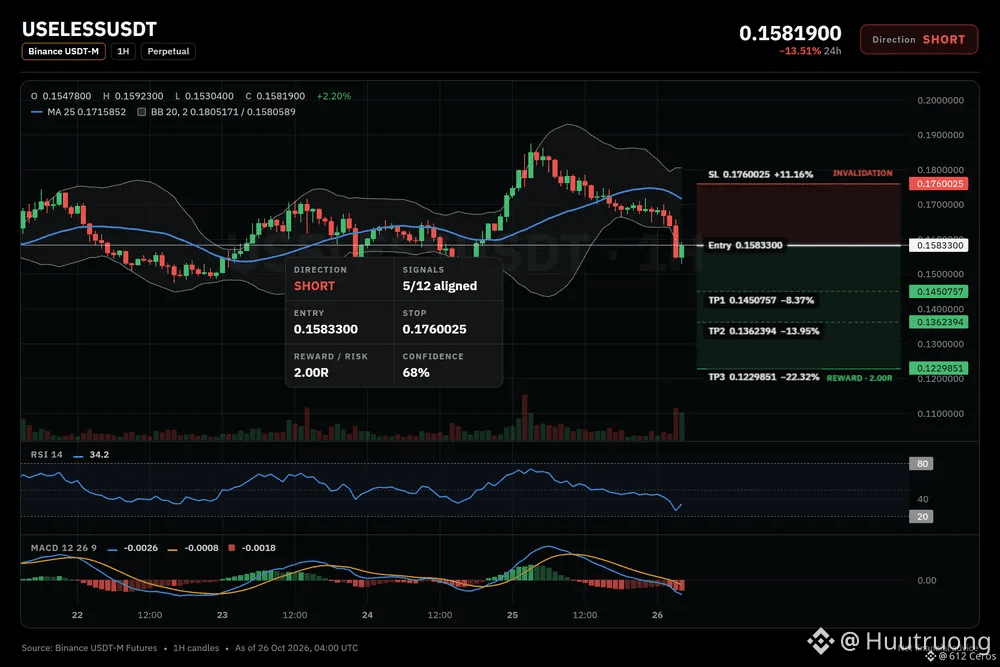
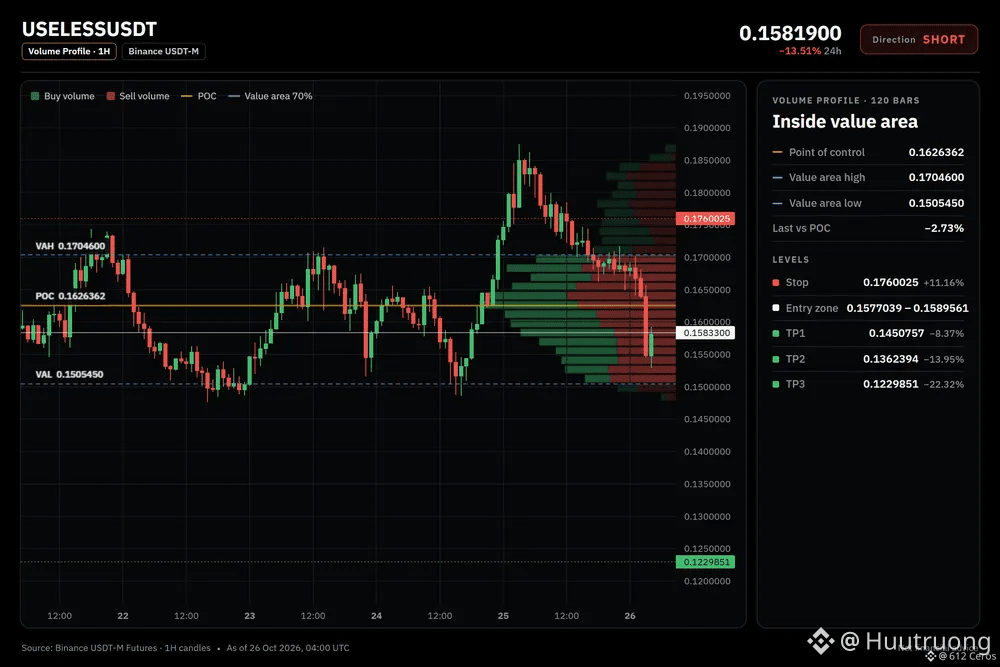
USELESS is grinding below its moving averages
🔴 SHORT $USELESS /USDT: expecting price to go DOWN
Bias: SHORT · Leaning
Entry: 0.1577039 – 0.1589561
TP1: 0.1450757 (-8.4%)
TP2: 0.1362394 (-14.0%)
TP3: 0.1229851 (-22.3%)
SL: 0.1760025 (+11.2%)
Plan: enter only inside the zone, close 50% at TP1, 25% at TP2, 25% at TP3, and move the stop to entry after TP1.
Note: moderate conviction only, keep size light.
Why SHORT? 5/12 signals agree, 0 against.
• 4h trend down (below EMA50 & EMA200)
• Sellers are driving the move (15m ADX 37.1)
• Sellers have the momentum (4h RSI 43.4)
Q: Why short when the daily trend is range?
A: The 4h chart shows a bearish stack with price below both EMAs.
Q: When is this setup wrong?
A: If price holds above 0.1760025 the short thesis fails.
What is your invalidation level for this trade?
10
·
--
Bearish
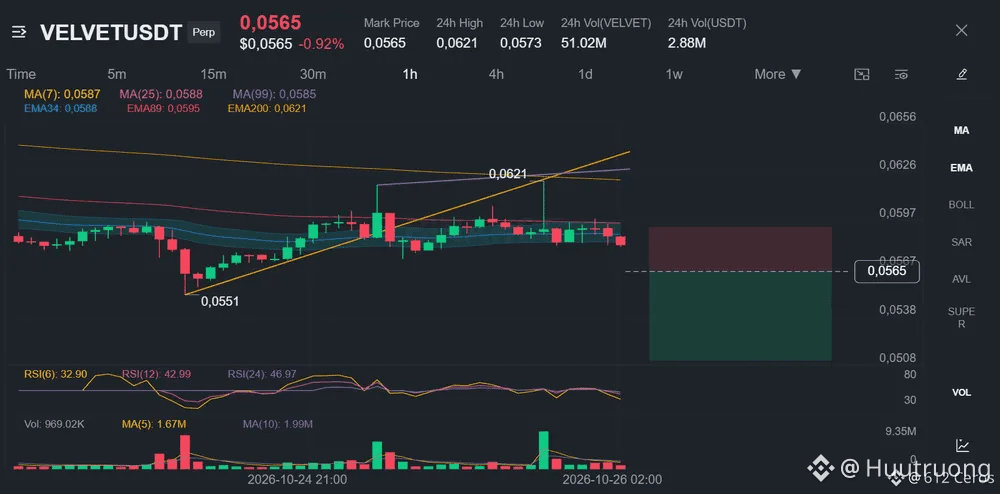
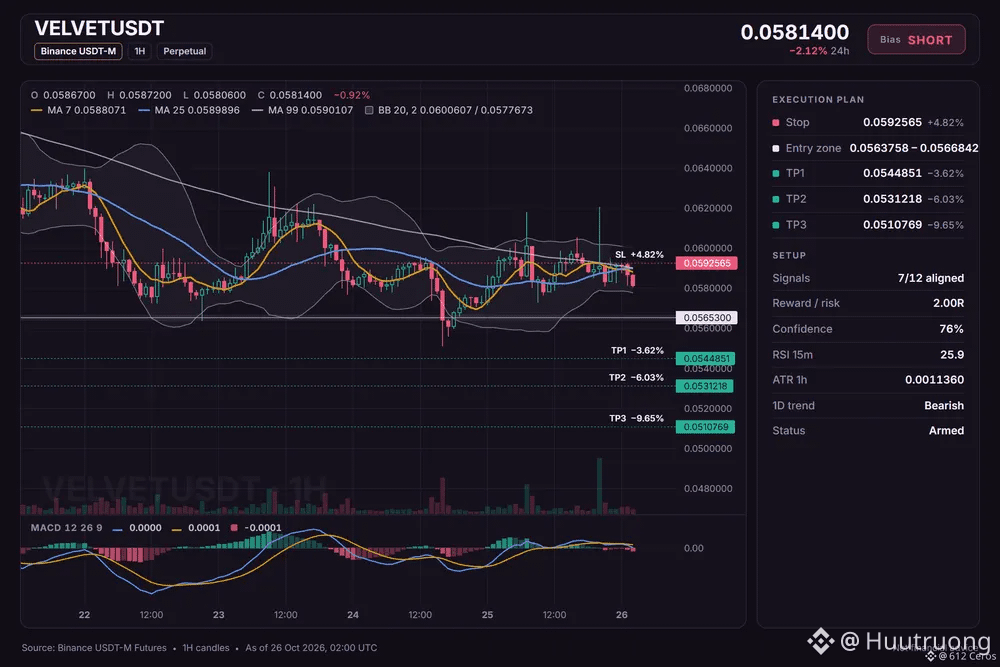
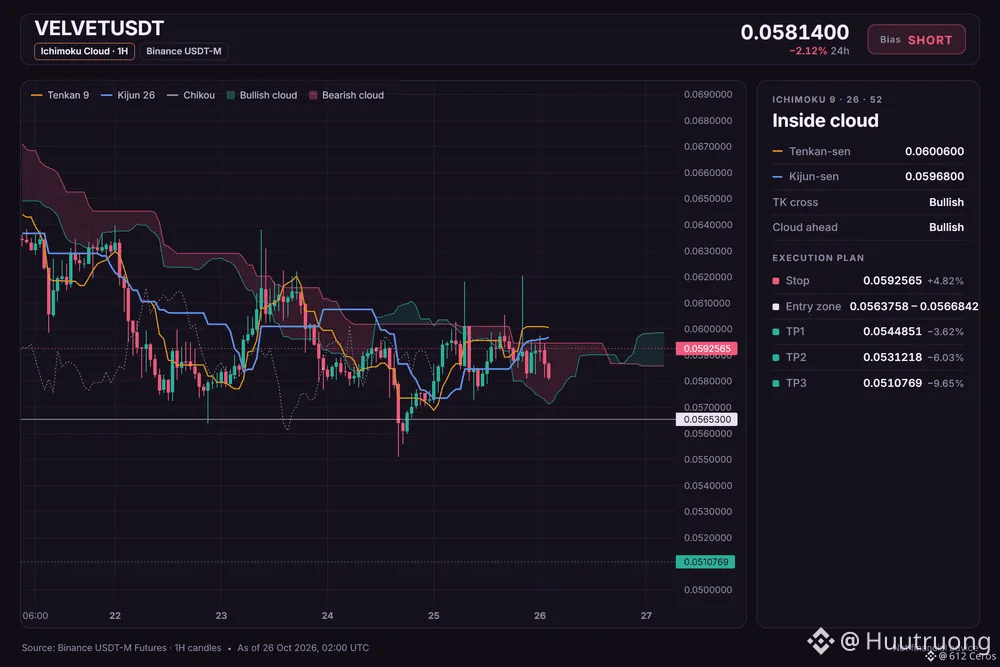
VELVET short setup: the levels I'm watching
🔴 SHORT $VELVET /USDT: expecting price to go DOWN
Bias: SHORT · Strong
Entry: 0.0563758 – 0.0566842
TP1: 0.0544851 (-3.6%)
TP2: 0.0531218 (-6.0%)
TP3: 0.0510769 (-9.6%)
SL: 0.0592565 (+4.8%)
Plan: enter only inside the zone, close 50% at TP1, 25% at TP2, 25% at TP3, and move the stop to entry after TP1.
Why SHORT? 7/12 signals agree, 1 against.
• Daily trend down (below EMA50 & EMA200)
• 4h trend down (below EMA50 & EMA200)
• 1h trend down (below EMA50 & EMA200)
Risk: Range bottom, buyers often step in (RSI z −2.72)
In plain words:
The daily trend reads bearish, and 7/12 signals aligned favour the short side. The plan is to work the 0.0563758 – 0.0566842 zone, scale out at 0.0544851 and 0.0531218, and stay patient for 0.0510769. A move through 0.0592565 means the idea is wrong and the stop does its job.
Does VELVET tag 0.0544851 first, or the stop?
6
Log in to explore more content
Join global crypto users on Binance Square
⚡️ Get latest and useful information about crypto.
💬 Trusted by the world’s largest crypto exchange.
👍 Discover real insights from verified creators.
Email / Phone number
Trending Topics
BinancePick
2.7M views
143,397 Discussing
Join #EarningsSeason: Predict Earnings on Binance Pick, Share Your Take on Binance Square!
Binance Square Official
·402 Likes
·339k views
EarningsSeason
5M views
24,599 Discussing
SouthKoreaReportedlyWeighsFourthCryptoTaxDelay
1,176 views
89 Discussing