

橙子研究院
2.4k Posts

橙子研究院
 Square Verified+
Report
Block User
2015 年入圈|10年Crypto资深投资者|擅长大趋势研判,主打中长线布局、波段锁利|推特 X:@chengzi866|币安 20 % 返佣邀请码:ZXZ4BNM3|感谢关注,投资路上并肩前行!
High-Frequency Trader
9.2 Years
21 Following
39.3K+ Followers
29.6K+ Liked
Posts
All
Quotes
Videos
Live
PINNED
·
--
Currently we have two order-trading accounts, each targeting a different market:
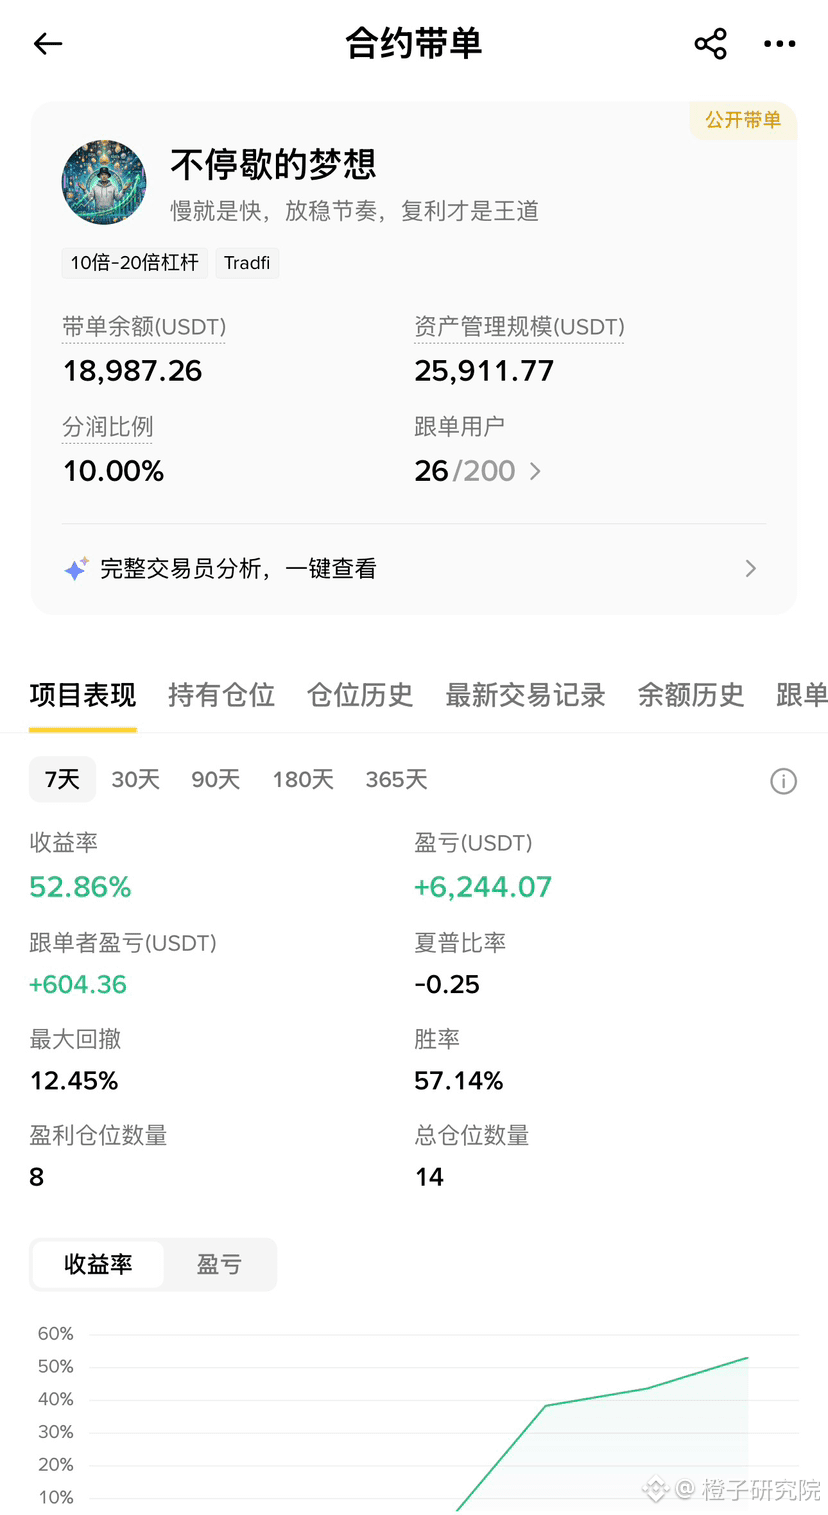
① The Never-Ending Dream
We mainly trade crypto assets, primarily cryptocurrencies such as BTC and ETH. We also participate in crypto futures copy trading. The 7-day staged return is 53%.
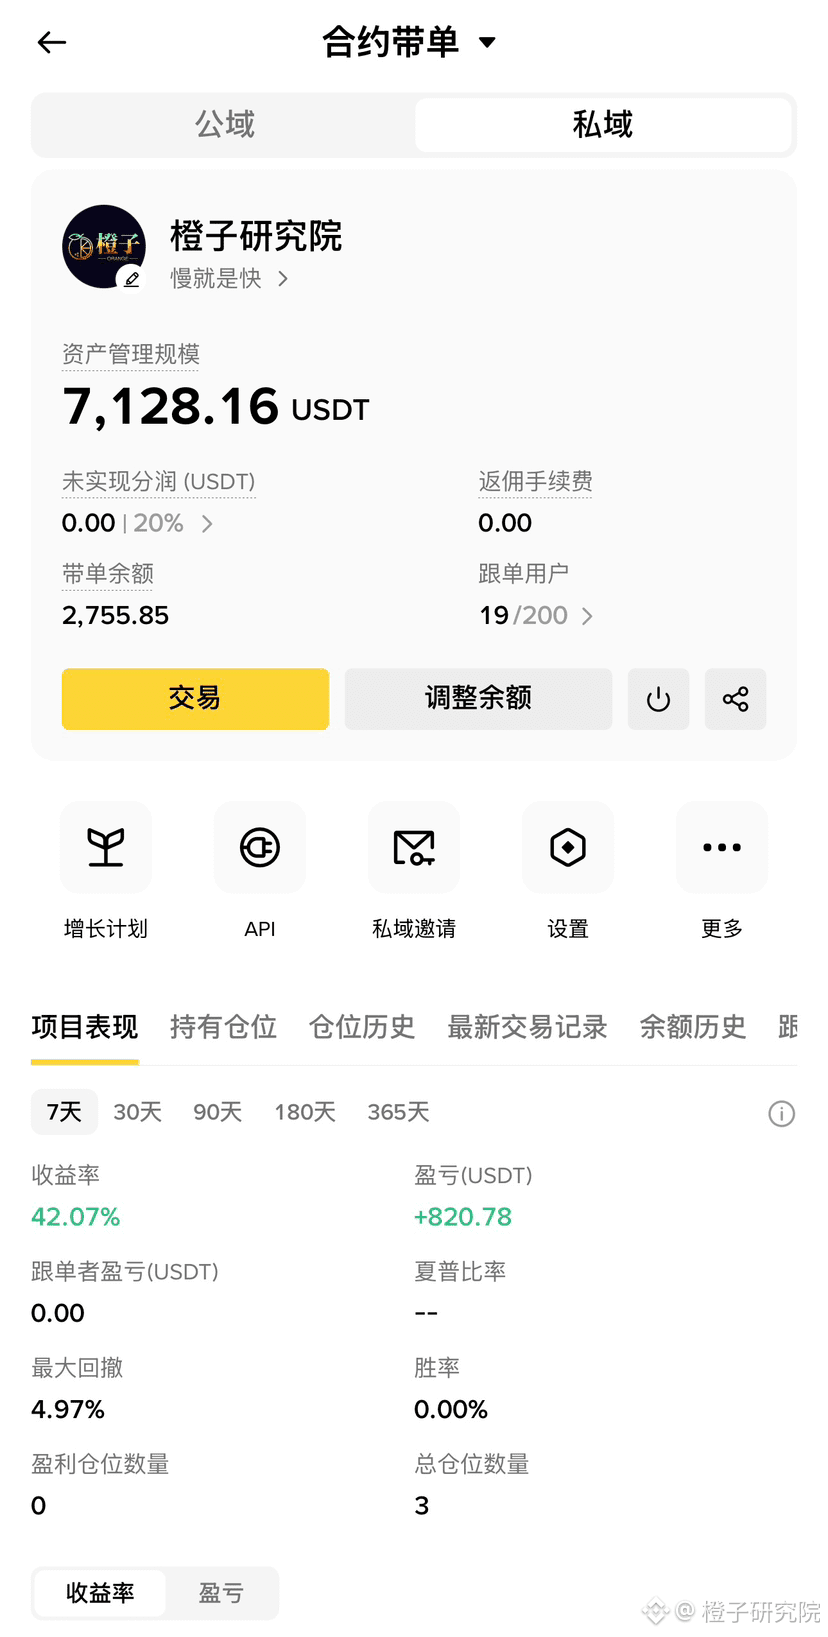
② Orange Research Institute
We mainly trade U.S. stock assets, focusing on U.S.-stock-related instruments. At present, we have one live account for copy trading with about a month of track record, and the staged return is approximately 40%.【Trade frequency: 2–5 entries per month】
Private-domain copy-trading invite code: 8W14NPoX
The two accounts have different philosophies, but they share one common point: controlling drawdowns and trading steadily and prudently. We don’t pursue reckless, all-in gains.
If you haven’t copied our trades before, you can first use a small amount of $100–$1,000 to experience our strategy for a period of time, then decide whether to increase funds based on your own situation.
Returns will fluctuate, and drawdowns may occur as well. Validating your confidence with small capital is more important than going heavy from the very start.
#BTC $ETH $SOL $NVDAB

13
50
1.4k
PINNED
·
--

Article
Understanding Bitcoin in One Article: Short-term Trading Logic + Medium-term Risks + Long-term OpportunitiesBitcoin's recent decline has been rapid and fierce. The first strong support we anticipated at 69000 was only slightly resisted before being broken. The trend then continuously fell below the second strong support at 63000, plunging to 60000 before rebounding and beginning to stabilize.
69000 This area is the shallow bear position we defined, and we had high hopes for it, but faced with a reality as fragile as paper, we need to update our thoughts on the upcoming market. The trend has formed, the shallow bear is unlikely, and the deep bear has become a reality!
Looking back at 2025, the most common phrase we hear is that the four-year cycle of Bitcoin has failed, but the market in the past few months has given us a loud slap in the face with reality. As we said, the cycle may be weakened, but it will never fail!
Understanding Bitcoin in One Article: Short-term Trading Logic + Medium-term Risks + Long-term Opportunities
Bitcoin's recent decline has been rapid and fierce. The first strong support we anticipated at 69000 was only slightly resisted before being broken. The trend then continuously fell below the second strong support at 63000, plunging to 60000 before rebounding and beginning to stabilize.
69000 This area is the shallow bear position we defined, and we had high hopes for it, but faced with a reality as fragile as paper, we need to update our thoughts on the upcoming market. The trend has formed, the shallow bear is unlikely, and the deep bear has become a reality!
Looking back at 2025, the most common phrase we hear is that the four-year cycle of Bitcoin has failed, but the market in the past few months has given us a loud slap in the face with reality. As we said, the cycle may be weakened, but it will never fail!
20
9
95
51.9k
·
--
【Bitcoin has been ranging between 80,000 and 85,000 for over 20 days! Which way will it break?】
The market has been incredibly dull. Will Bitcoin break up or down? Honestly, it’s still too early to tell!
Since my previous analysis, Bitcoin has been consolidating between 80,000 and 85,000 for over 20 days. Bulls and bears have been pulling back and forth, but the market still hasn’t truly chosen a direction. As I mentioned before, there’s no sign that the broader correction is over. The short-term trend remains weak, but there’s also fairly strong support below. For a sharp sell-off to begin, we’d need fresh negative catalysts.
So right now, the most important thing isn’t to guess the direction, but to prepare for either possibility.
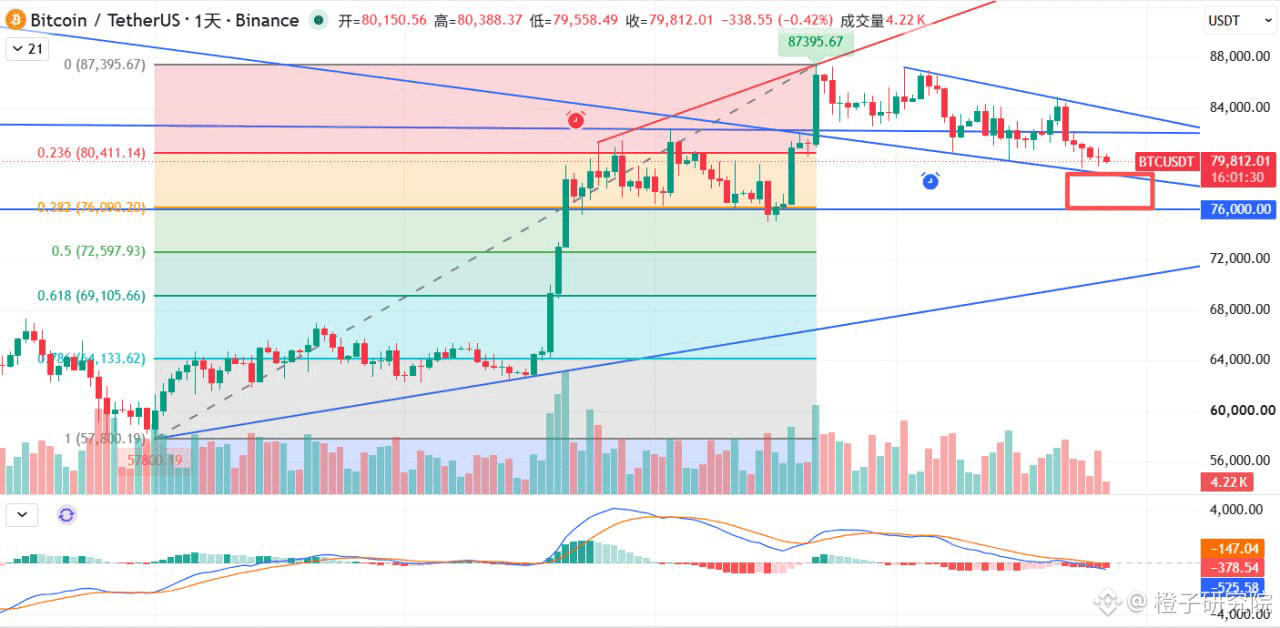
My spot strategy is still the same as the one I shared before: if your position is relatively small, you can patiently wait to build it in stages below $79,000. If your position is relatively large, consider adding below $78,000, saving your cash for more attractive entry points. The key support zone I highlighted before, between $78,600 and $76,000, remains valid. The worst-case level to watch is around $75,000. As long as Bitcoin doesn’t decisively break below $75,000, there’s no need to get overly bearish for now.【❤️As shown in Figure 1】
If Bitcoin breaks upward, there’s no need to rush in and chase the price. Stick to the previous plan and watch for opportunities to trade around $89,000. There’s a plan for a rally, and there’s a plan for a drop—no need to keep making moves in this range.
As for Ethereum and altcoins, I’ve mentioned before that some coins are performing even more weakly than Bitcoin. Until their trends improve, don’t let a boring market tempt you into chasing prices.
All in all, Bitcoin has been stuck in the 80,000–85,000 range for over 20 days, and there’s little point in continuing to guess which way it’ll go. For now, all we can do is wait for the market to choose a direction before deciding what to do. The duller the market gets, the more patience you need. Don’t let the final stretch of sideways trading shake you out!
#BTC $SOL #ETH
2
1
25
4.4k
·
--
【Anthropic’s IPO could be the final straw that breaks Bitcoin?】
Bitcoin continues to show weakness, drifting lower and now trading below 80,000, in line with our previous expectations.
Looking at last night’s price action, both the rallies and sell-offs around 80,000 came with high volume, showing an intense tug-of-war between bulls and bears. In other words, whether price can firmly reclaim 80,000 has become the key short-term level for judging market direction.
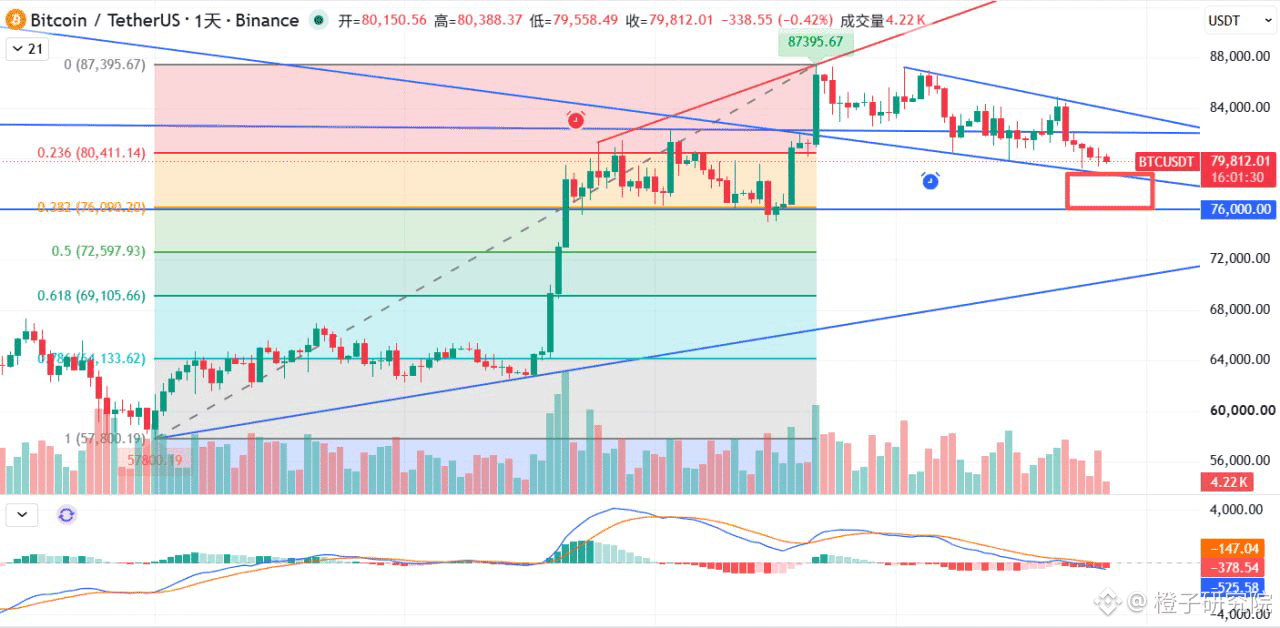
If the bulls can’t recover lost ground over the next couple of days, the late stages of a gradual decline are generally followed by an acceleration, with a sharp sell-off to find the bottom. Keep this in mind. For now, the downside support zone is 78,600–76,000. An extreme wick could briefly break below this zone, but as long as price doesn’t decisively fall below 75,000, it should be fine. 【❤️As shown in Figure 1】
Anthropic has officially filed for a Nasdaq IPO. This could siphon liquidity from the market and become the final straw that breaks Bitcoin.
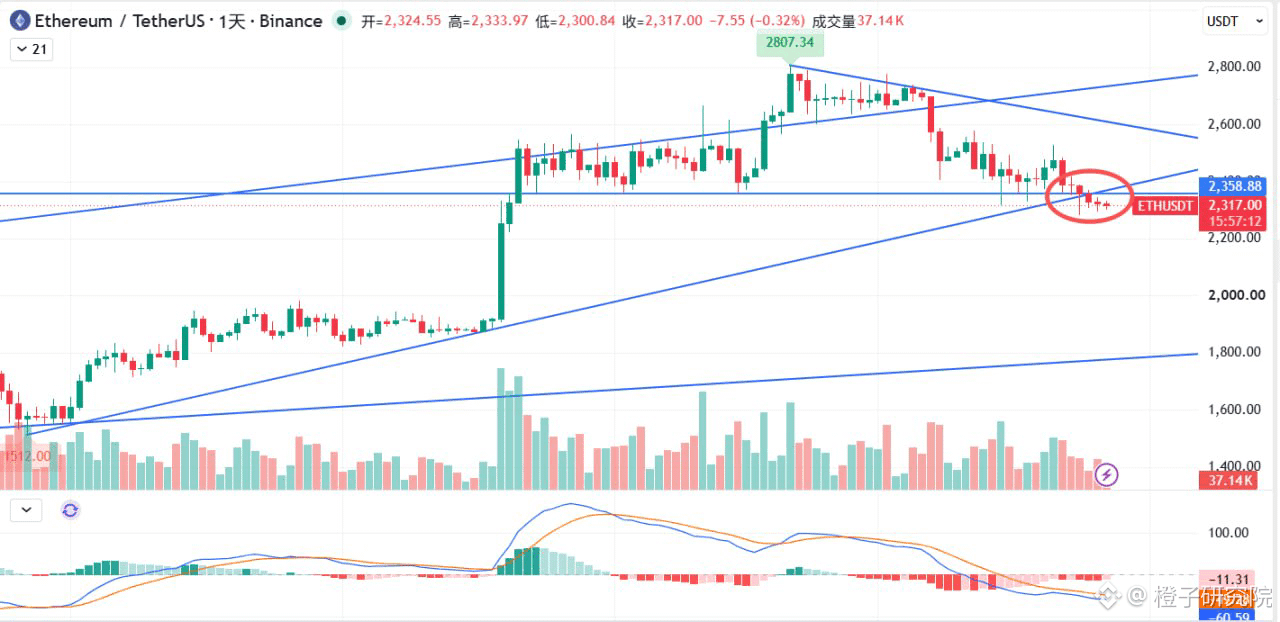
Yesterday I saw news that the Ethereum Foundation had sold some of its coins. Ethereum’s chart is indeed weaker than Bitcoin’s at the moment. It has now fallen out of the triangle, and after breaking below the uptrend line, it could accelerate downward at any time. So be extra cautious with altcoins—don’t chase prices higher! 【❤️As shown in Figure 2】
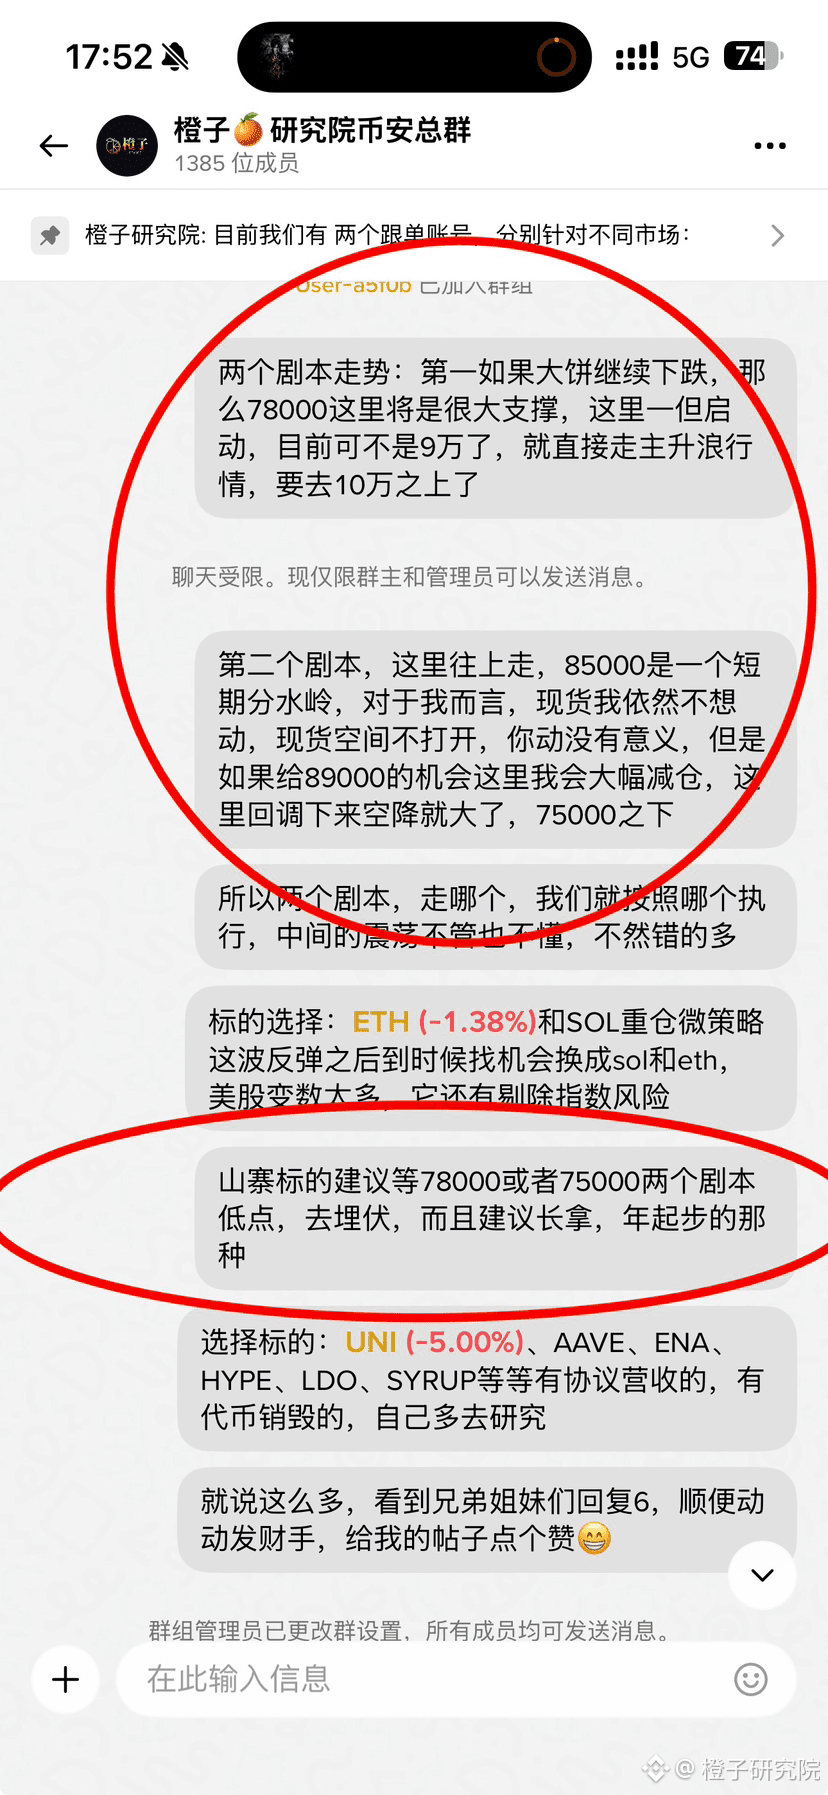
Spot trading suggestion: If you’re holding a small position, consider adding in three or four batches below 79,000. My own position is already heavily invested, so I’m waiting for Bitcoin to fall below $78,000 before preparing to go all in. (For reference only.)
#BTC走势分析 $SOL #ETH
18
22
7.3k
·
--
【Three consecutive weekly red candles! How much further will Bitcoin fall? Key levels are now clear】
The weekend rebound fell short of expectations. And as mentioned, there are still no signs that the broader trend correction is over. With momentum weak, Bitcoin unsurprisingly made a new low at 79,220 before forming a long lower wick and bouncing slightly.
First, let’s look at the weekly chart. It closed with a small red candle and a long upper wick, showing significant overhead pressure. After three consecutive weeks of declines, the Three Black Crows pattern suggests that this week may still be challenging.
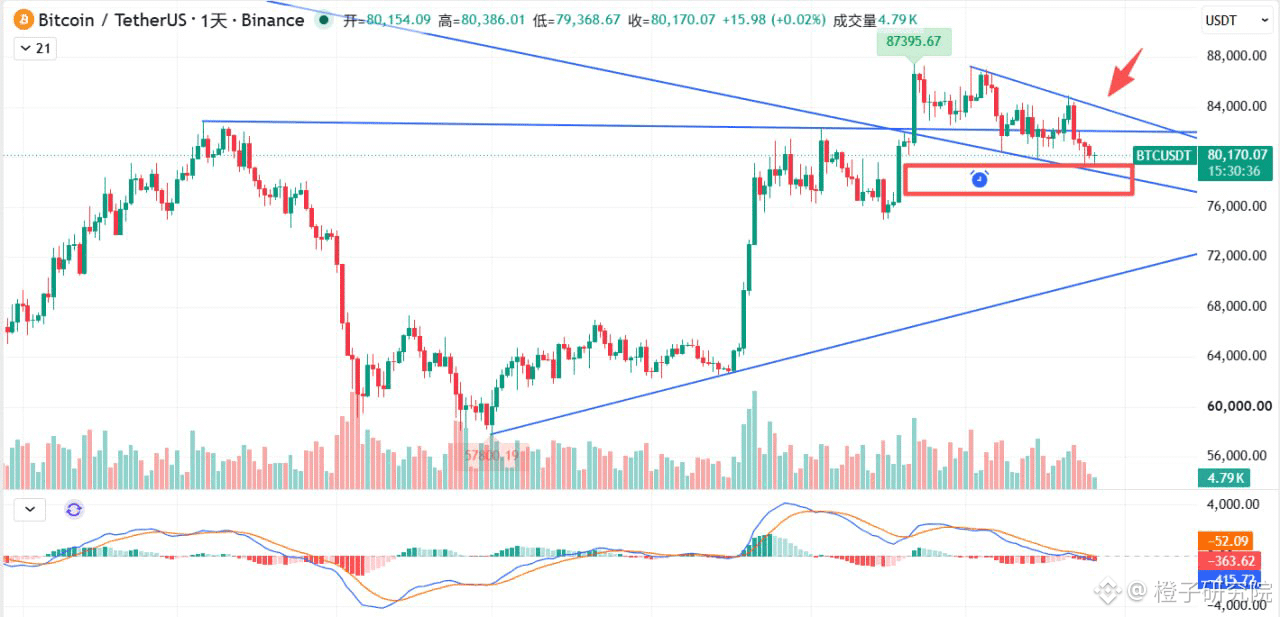
The daily chart is fairly clear: Bitcoin’s recent pullback has mostly followed the channel of a rising flag pattern. The lower boundary has now moved down to around 78,800, which could be where Bitcoin makes its next wick low. The MACD has crossed below the zero line, suggesting weakness may persist in the short term.
However, a rising flag is a bullish continuation pattern. Bitcoin could regain strength once it breaks above the upper boundary, currently around 84,000. A breakout above the resistance zone between 84,000 and 85,200 could therefore serve as a reference for a relatively conservative entry point.
The flag’s lower-boundary support now overlaps with the 78,600–76,000 support zone, and the previous low at 74,967 is also nearby. This should make support here fairly strong; under normal circumstances, a direct break below it would be difficult. Keep a close eye on this area. 【❤️As shown in Figure 1】
Negative news from global markets keeps coming, and financial markets abroad have been highly volatile. Bitcoin has not followed with a sharp drop, which is already a sign of strength. Ultimately, this is because we are in a bull market, and the broader trend remains upward.
Although we’ve seen three consecutive red candles on the weekly chart, the correction still seems a little short compared with the duration of the preceding rally. But what we really need to keep in mind is not to get shaken out during the consolidation!
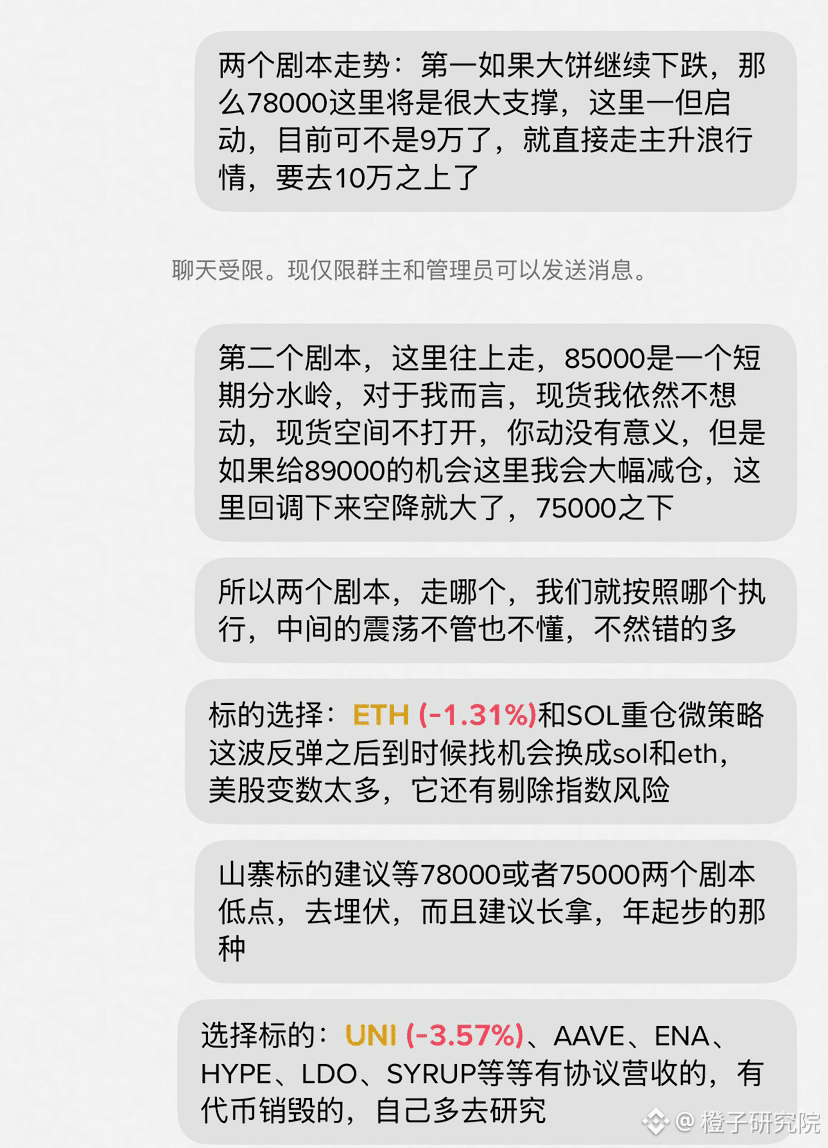
Trading suggestion: Continue holding your spot positions. If your spot allocation is small, you can build a position in batches below 79,000.
#BTC走势分析 $SOL #ETH
20
55
9.3k
·
--
【Bitcoin wicked down to 81,099! Is a rebound opportunity here, or do we keep holding on?】
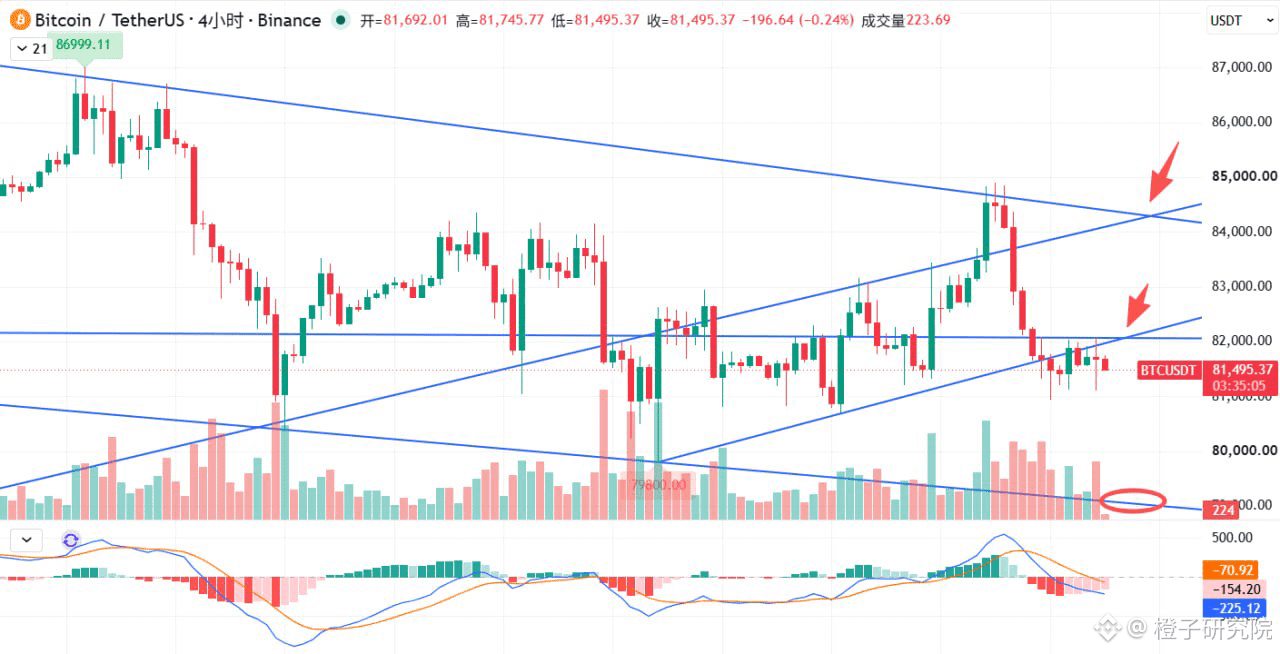
Bitcoin continues to trade sideways, and the market is pretty dull. Here’s a quick update: it wicked down to 81,099 tonight. For now, it looks like price has retested the recent short-term trend. The support around 80,800 still looks fairly solid. If tomorrow’s daily candle can close above 81,000, we could see a small-scale rebound. The daily MACD has returned to the zero line, and a bullish divergence on the 4-hour chart is offering some support to the market. 【❤️As shown in Figure 1】
The resistance levels are the same ones I’ve mentioned many times: around 83,200, and the narrower range from 84,300 to 85,200. Even if we get a rebound, it will probably be fairly limited, with the most likely target near the lower end of the 84,300 range. For a real recovery, we’ll need to see a breakout above 85,200!
Looking at the broader trend, there’s no sign that the pullback is over yet. We’ll keep waiting and watching the key levels. The 79,400 level has been lowered to 79,100. If Bitcoin moves sideways for a few more days, this support level will nearly overlap with the top of the 78,600–76,100 support zone. In the most extreme case, we could see the 75,000–73,000 range, but for now there’s no sign of a drop that deep—unless some black swan event throws a wrench in the works. Overall, the downside looks fairly limited, so just be patient!
#BTC走势分析 $SOL #ETH
18
1
19
7.3k
·
--
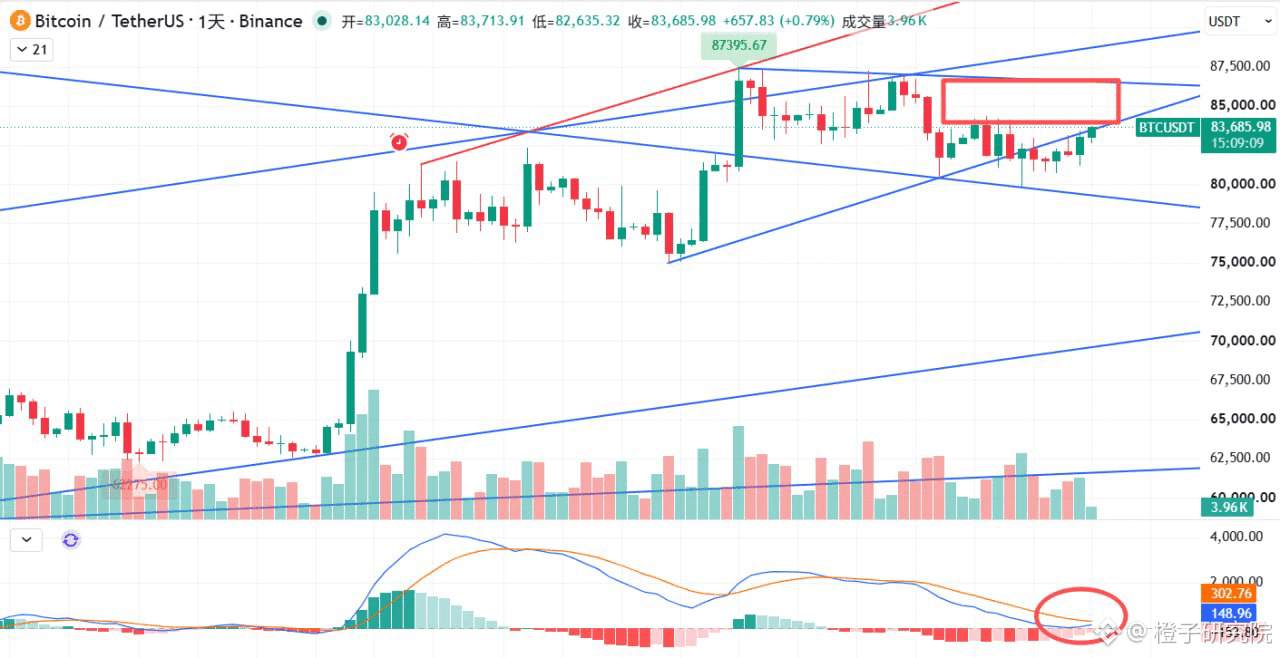
【BTC is starting to rebound on rising volume, and the daily MACD is about to form a golden cross above zero. Is the market about to turn?】
My overall view of BTC’s price action over the past couple of days has been that it will continue to move sideways and test investors’ patience. However, there’s no need to be overly bearish: downside is limited, and patience will pay off.
The market has largely followed that pattern. After hovering around 81,000 for quite a while, it has finally made a decent push higher and is now testing resistance at 83,400.
Volume has picked up somewhat during the rise, but it’s still not enough. It looks more like the market is still building momentum. Given the recent sharp declines in overseas financial markets and the many negative factors, BTC has held up without a major drop, showing clear strength. Also, the daily MACD is about to form a golden cross above zero, and the price action is developing in a positive direction.【❤️See image 1】
It’s hard to say whether BTC will break straight through 83,400 or move sideways again first, but I’m still leaning optimistic. It may just be a matter of time. The real challenge lies around 85,100.
The short-term strategy is actually fairly simple: as long as BTC’s daily close stays above 80,400, we’re in the safe zone. If it falls below that level, it may need to retest lower levels, as this is an important support level.
To the upside, BTC needs to hold above 85,100 before it has a chance to challenge the previous high—or even make a new one!
Trading plan: Continue holding a heavy spot position【❤️See images 2–4】
#BTC走势分析 $SOL #ETH $ENA


19
36
6.5k
·
--
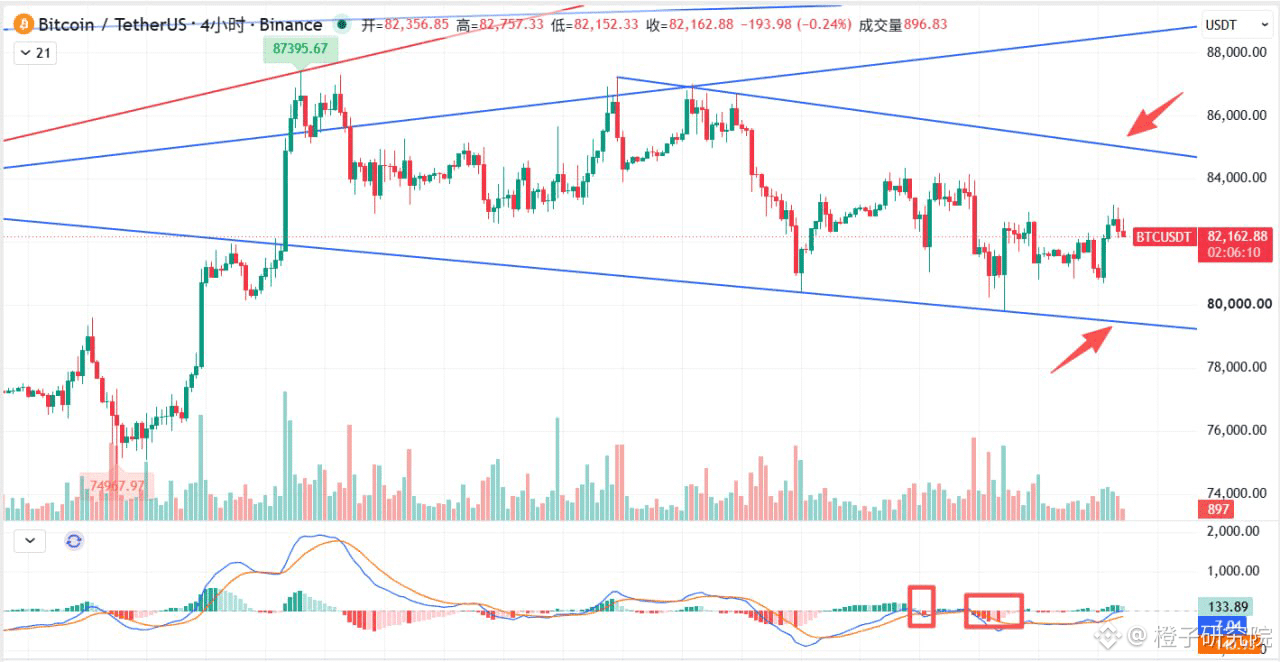
【 BTC bearish momentum is starting to fade, and 85,000 remains key! Wait patiently for the market to build momentum 】
BTC has been going in circles lately. A small rise makes you think it’s about to break out, while a slight dip makes you wonder whether the market is losing steam. Chasing a rally risks getting trapped, while selling into a dip risks missing the rebound—and futures traders can get hit from both sides.
But looking at the current chart, our view from yesterday hasn’t changed: the consolidation is showing signs of nearing its end. A further short-term pullback is still possible, but there’s no need to become overly bearish because of it.
Bearish momentum on the 4-hour chart has eased somewhat, and the falling wedge is also showing some positive signs. Watch support around 79,400, with 78,600–76,100 as the next area below. To the upside, 85,000 remains the key level. Only a high-volume breakout followed by a sustained hold above it would give the market a chance to take another run at the previous high of 87,300. 【❤️As shown in Figure 1】
Right now, the most important thing isn’t guessing what each candlestick will do, but being clear about your trading timeframe. For spot traders, short-term swings of a few percentage points aren’t worth constantly reacting to. As long as your overall outlook hasn’t fundamentally changed, there’s no need to let the market lead you around by the nose.
Hold on to what you should hold, and wait patiently for what you’re waiting for. At this stage, checking the charts less and trading less is more important than chasing every daily fluctuation. Wait for the market to truly choose a direction.
#BTC $SOL #ETH $UNI

橙子研究院
·
--
【 BTC keeps springing bull and bear traps—third time’s the charm! A decisive move may be coming this week 】
$BTC The grueling sideways market continues, with frequent bull and bear traps in a narrow range. This has little impact on spot traders, but is very unfriendly to highly leveraged users. The clear aim is still to flush out high-leverage liquidity from the market.
The weekly chart looks much like last week’s, with another small candle and a long lower wick. Price has moved lower, with support below and resistance above. This can’t go on forever, so a directional move this week looks very likely.
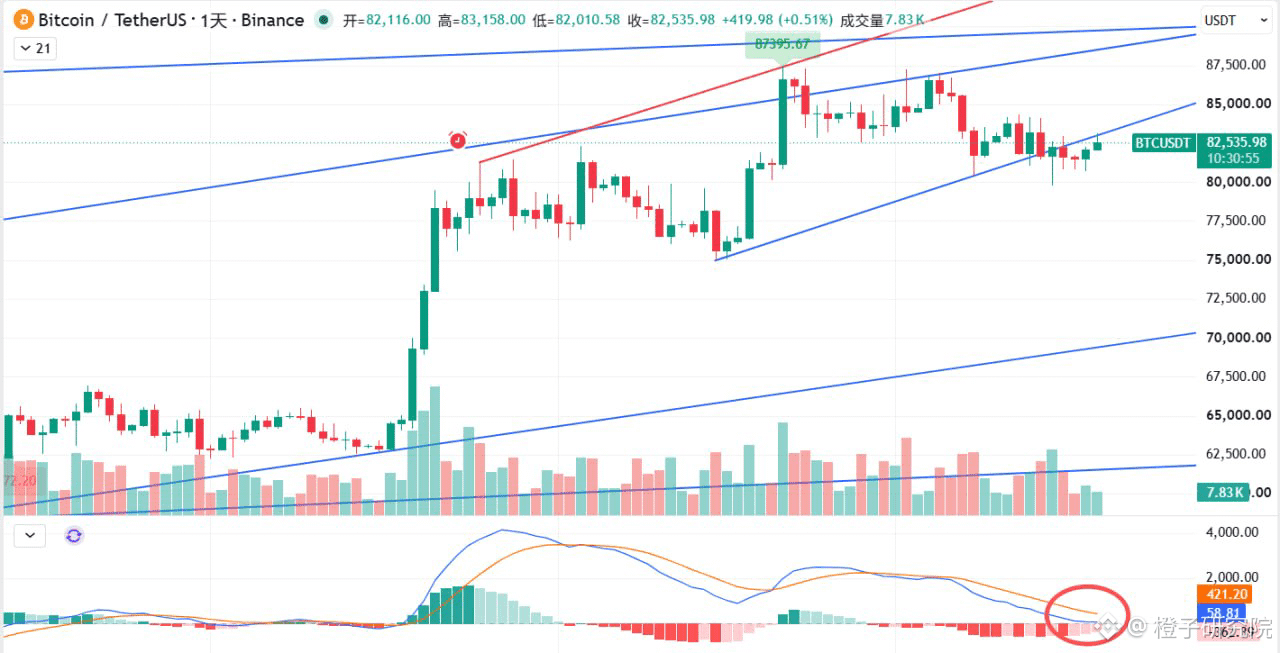
On the daily chart, price remains capped by the broken lower boundary of the short-term channel at 83000. The rebound lacks volume and is clearly under pressure. However, MACD has started to flatten after touching the zero line, suggesting selling pressure has eased. 【❤️As shown in Figure 1】
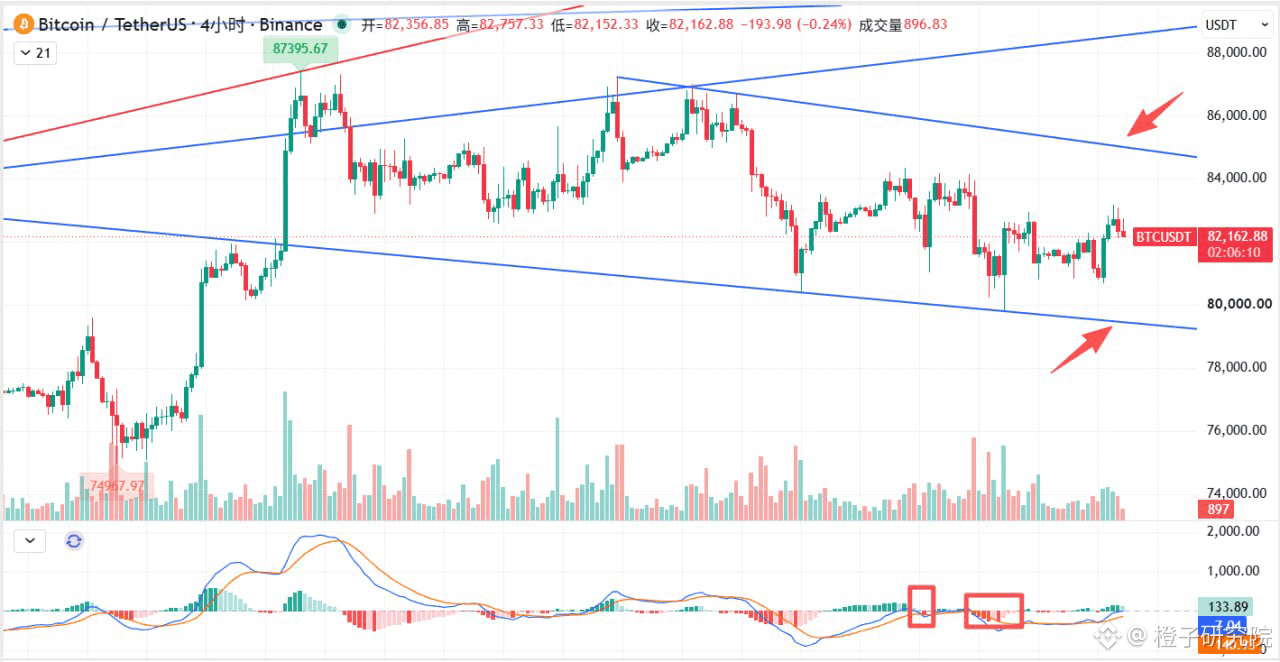
On the four-hour chart, Bitcoin is moving within a descending wedge. Resistance at the upper boundary is still around 85000, while support at the lower boundary has moved down to 79450. After a bullish MACD divergence, a second golden cross has formed. Despite several sell-offs, the MACD red bars have been relatively limited, showing that bearish momentum is clearly fading. 【❤️As shown in Figure 2】
Taking the overall pattern, trading volume, and momentum into account, the sideways market appears to be nearing its end. The price action may remain complicated, but there’s no need to be excessively bearish. If the decline continues, 79400 at the lower boundary of the wedge is a good level to watch. Even if that breaks, the next major support zone, from 78600 to 76100, is not far below. This won’t make much difference to spot traders, but it could be painful for futures traders, so I wouldn’t recommend it.
As for the upside, there are several hurdles: 83000, 85000, and the previous high of 87300. A breakout will need strong volume. The key level to watch is 85000, which is the dividing line for the market. A breakout above it would open the door to new highs. Until then, expect more sideways price action and be patient!
Trading recommendation: Continue holding spot positions
#BTC走势分析 $ETH #SOL $UNI
17
32
5.2k
·
--
【 BTC keeps springing bull and bear traps—third time’s the charm! A decisive move may be coming this week 】
$BTC The grueling sideways market continues, with frequent bull and bear traps in a narrow range. This has little impact on spot traders, but is very unfriendly to highly leveraged users. The clear aim is still to flush out high-leverage liquidity from the market.
The weekly chart looks much like last week’s, with another small candle and a long lower wick. Price has moved lower, with support below and resistance above. This can’t go on forever, so a directional move this week looks very likely.
On the daily chart, price remains capped by the broken lower boundary of the short-term channel at 83000. The rebound lacks volume and is clearly under pressure. However, MACD has started to flatten after touching the zero line, suggesting selling pressure has eased. 【❤️As shown in Figure 1】
On the four-hour chart, Bitcoin is moving within a descending wedge. Resistance at the upper boundary is still around 85000, while support at the lower boundary has moved down to 79450. After a bullish MACD divergence, a second golden cross has formed. Despite several sell-offs, the MACD red bars have been relatively limited, showing that bearish momentum is clearly fading. 【❤️As shown in Figure 2】
Taking the overall pattern, trading volume, and momentum into account, the sideways market appears to be nearing its end. The price action may remain complicated, but there’s no need to be excessively bearish. If the decline continues, 79400 at the lower boundary of the wedge is a good level to watch. Even if that breaks, the next major support zone, from 78600 to 76100, is not far below. This won’t make much difference to spot traders, but it could be painful for futures traders, so I wouldn’t recommend it.
As for the upside, there are several hurdles: 83000, 85000, and the previous high of 87300. A breakout will need strong volume. The key level to watch is 85000, which is the dividing line for the market. A breakout above it would open the door to new highs. Until then, expect more sideways price action and be patient!
Trading recommendation: Continue holding spot positions
#BTC走势分析 $ETH #SOL $UNI
21
1
45
7.2k
·
--
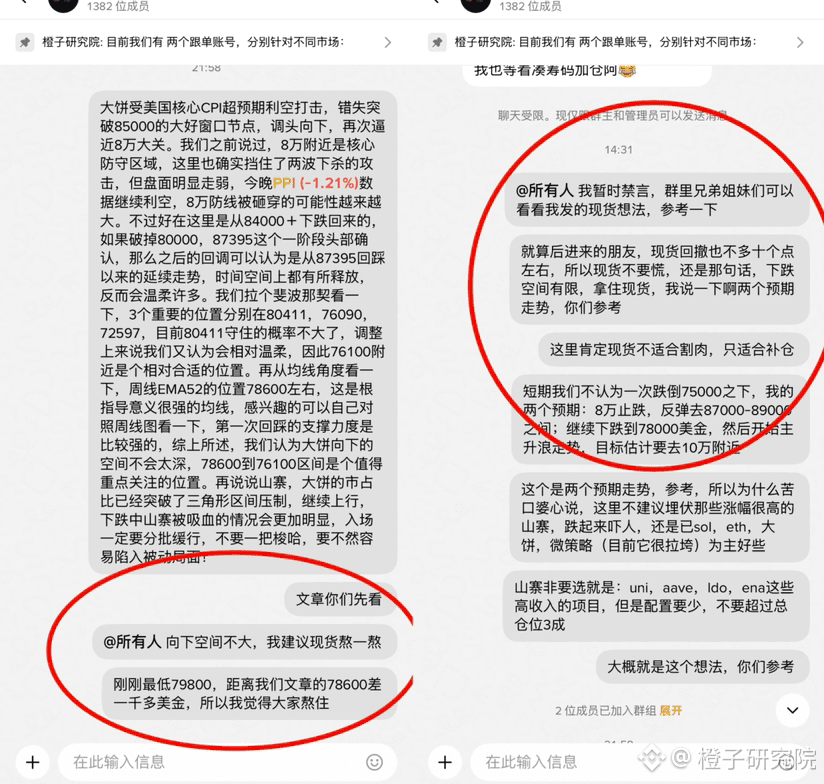
【 Bitcoin enters a choppy, grinding phase: hold your spot, don’t get shaken out by a wick 】
Yesterday, we said that after Bitcoin briefly wicked below 80,000 and then formed a long wick, this couldn’t yet be considered a confirmed breakdown. The key is still the daily close.
Bitcoin has now returned to its previous trading range. The daily chart shows rising volume and a long lower wick, a bullish divergence has been confirmed on the 4-hour chart, and the daily MACD is also approaching support at the zero line. Short-term indicators and price action have both improved somewhat.
For now, keep an eye on the 84,000–85,000 range. Whether Bitcoin can break through and hold above it will determine if it can make another run at the previous high in the short term. If it continues to fail to break through, the market will likely remain choppy, so be prepared for more sideways trading.
But for spot holders, there’s no need to be overly bearish here. We remain bullish on the broader trend. Even if Bitcoin moves down to test lower levels again in the short term, the area around 78,000 is worth watching closely and is expected to provide strong support.
Also, from a risk-reward perspective, compared with chasing the rally, the downside risk and potential upside from current levels are not entirely balanced.
So keep holding your spot, watch more and trade less. Don’t let short-term wicks scare you into constantly changing your position. Choppy markets are the most exhausting; the most comfortable trades often come after the direction becomes clear.
❤️ Be sure to check out Figures 1 and 2 for key points. For reference.
#BTC $ETH #sol $UNI

21
59
10.2k
·
--
【 $BTC High-volume long-wick close; 4-hour bullish divergence confirmed! 84,000–85,000 is the next key zone 】
Last night, I said there was an increasing chance Bitcoin would be pushed below 80,000. Sure enough, after testing the level several times, it finally broke below 80,000, dipped to 79,800, and then closed with a long wick.
So, does this mean the defense has failed and the decline is about to continue? Let me clarify: when we talk about a breakdown, we generally mean a confirmed breakdown. Major support levels are usually judged by the daily close, so a brief wick below the level doesn’t count.
You can think of it as a lot of stop-loss orders and liquidations clustered around 80,000. The whales simply pushed the price below that level to take out the liquidity underneath.
Bitcoin has now returned to its previous trading range. The daily candle closed with a long wick on high volume, the 4-hour bullish divergence has been confirmed, and the daily MACD is approaching support at the zero line. Both the indicators and price action are looking better. 【❤️As shown in Figure 1】
Next, we’re back in the cycle again. For now, keep an eye on the 84,000–85,000 range. If Bitcoin can’t break through, we may see more back-and-forth price action. If it breaks through and holds above the range, then it can continue heading toward new highs! 【❤️As shown in Figure 2】
Now you can see why we’ve kept emphasizing that this market will be very complex. These choppy phases are simply frustrating; trading gets much more comfortable only after the market picks a direction.
For spot, stay patient and avoid making too many moves. Let’s wait for the market to choose a direction!
Trading plan: Yesterday, near BTC’s low, I repeatedly reminded you that adding to your position was appropriate, but selling at a loss was not. Hold on to your spot holdings; we remain heavily invested in spot for now. 【❤️As shown in Figure 3】
#BTC走势分析 $UNI #ETH $SOL
15
38
7.7k
·
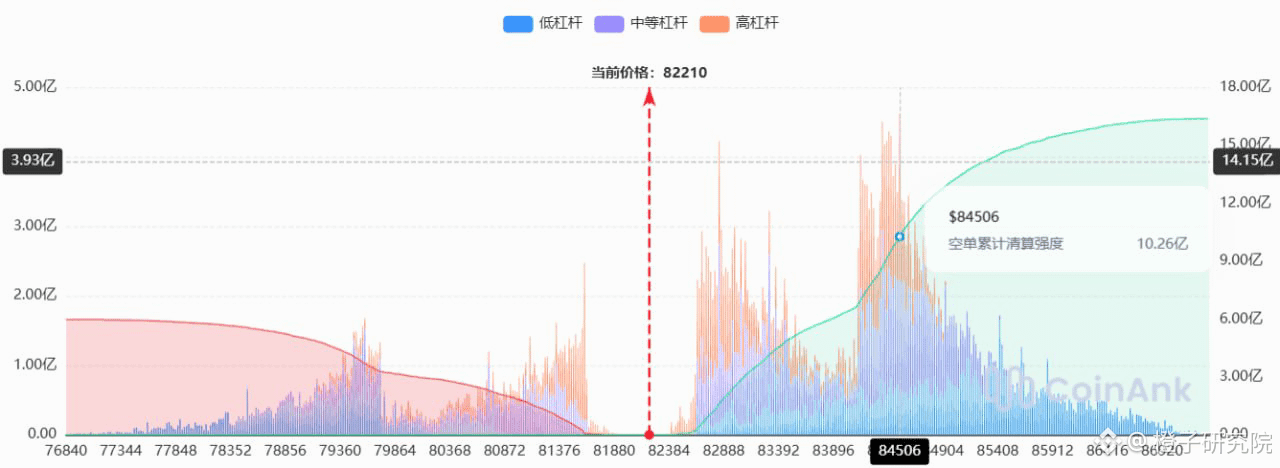
--
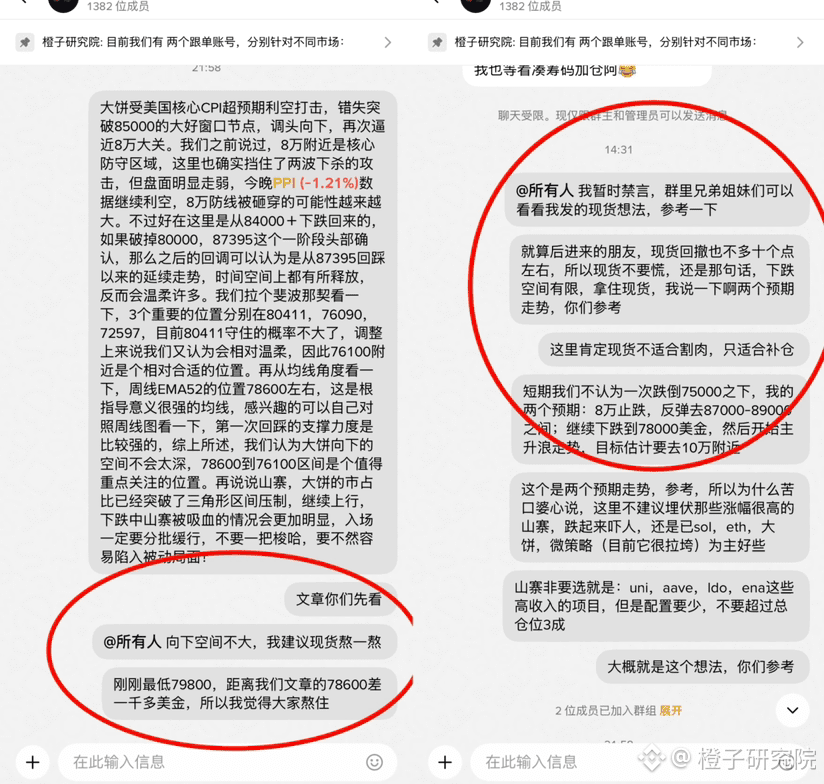
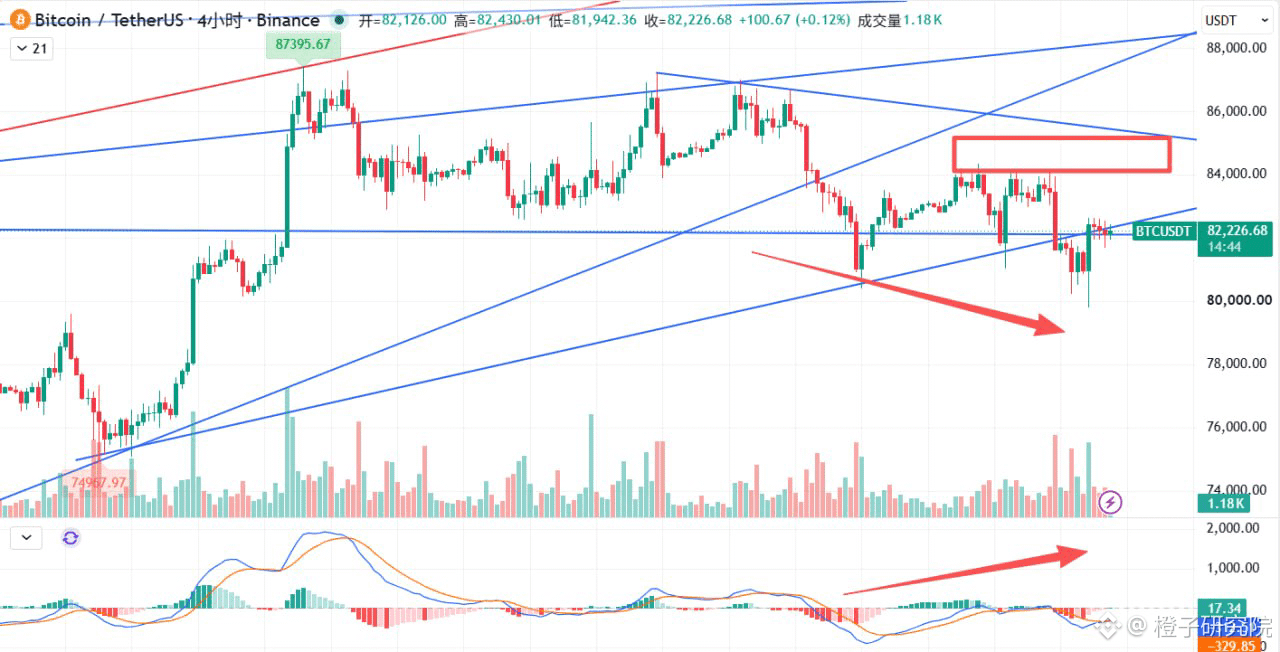
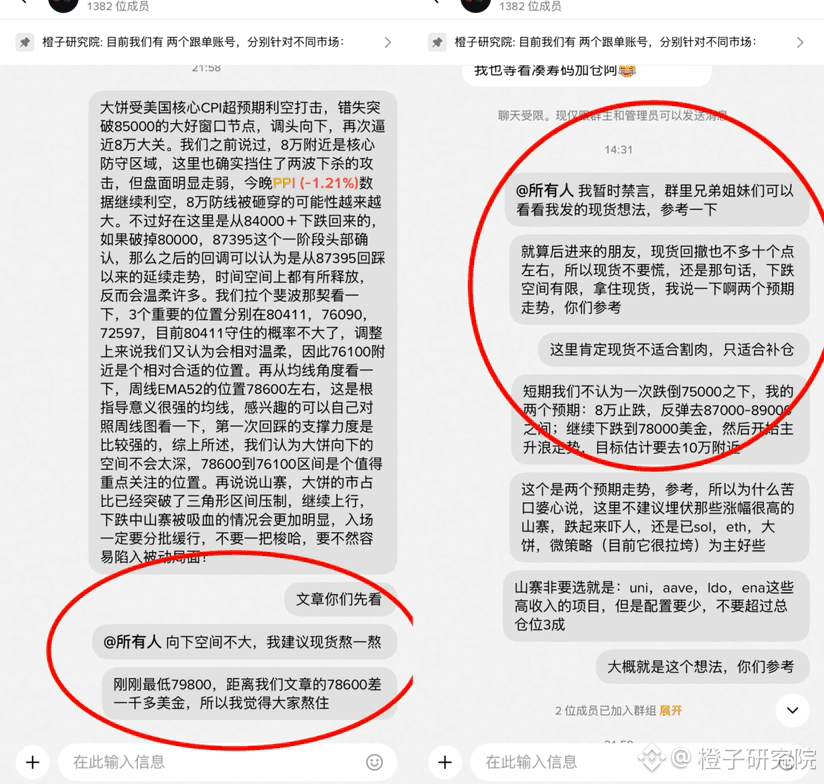
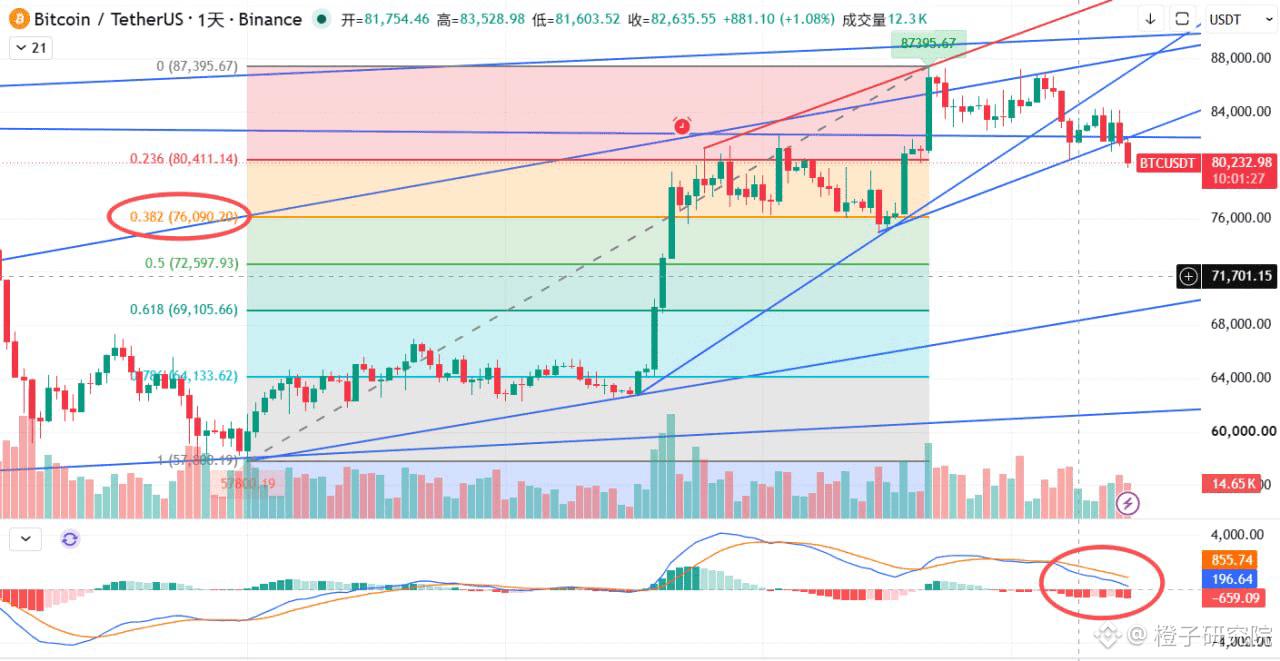
【BTC fails to break through 85,000. Where next? 78,600–76,100 is a key zone】
❤️Figure 1 contains a lot of notes, so be sure to take a look. Many of these ideas may be helpful for spot trading.
Bitcoin was hit by the bearish surprise of higher-than-expected U.S. core CPI, missing a prime opportunity to break through 85,000 before turning downward and once again approaching the 80,000 mark.
As we’ve said before, around 80,000 is a key support zone. It has indeed held back two waves of selling, but the market is clearly weakening. Tonight’s PPI data is also bearish, making it increasingly likely that the 80,000 support will be broken.
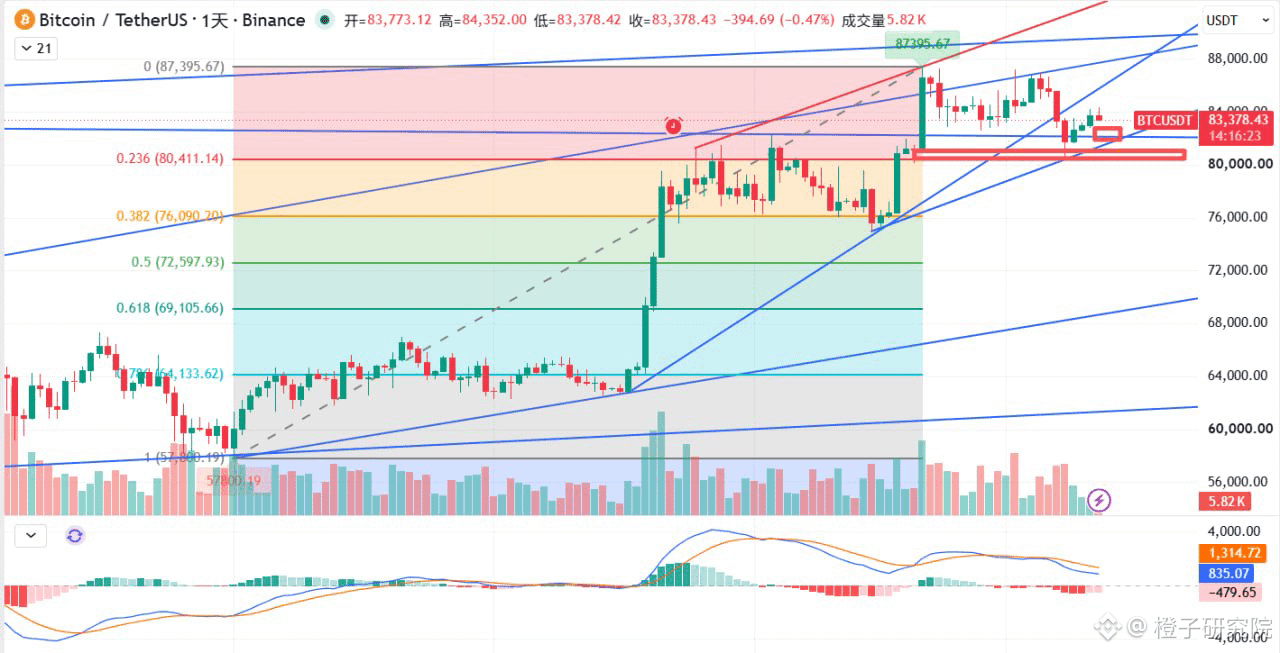
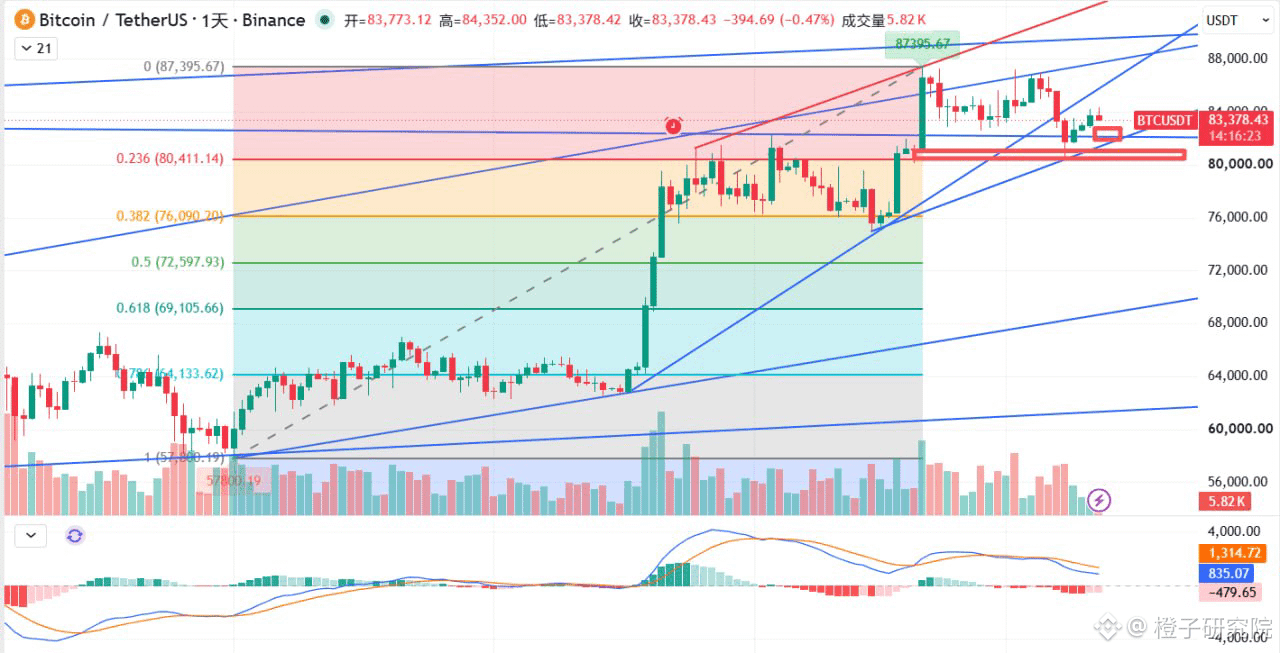
Fortunately, price has fallen back from above 84,000. If 80,000 breaks, that would confirm 87,395 as a first-stage top. The subsequent pullback could then be seen as an extension of the retracement that began at 87,395, meaning much of the correction in both time and price would already have played out—and the decline may be more gradual.
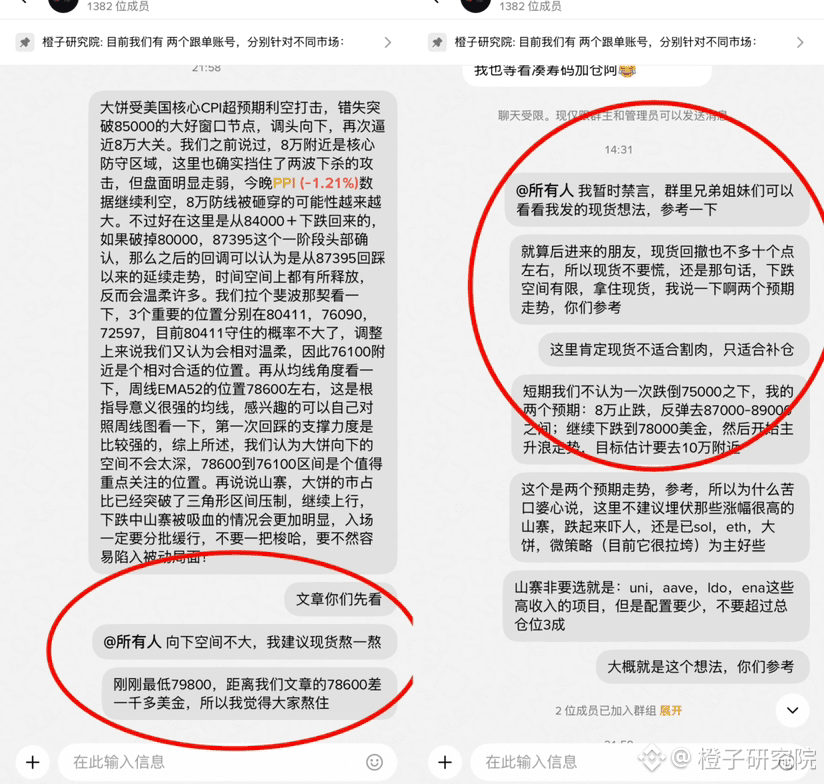
Let’s take a look at the Fibonacci levels. The three key levels are 80,411, 76,090, and 72,597. It’s now unlikely that 80,411 will hold. Given that we expect the correction to be relatively mild, around 76,100 looks like a more suitable level to watch.【❤️See Figure 2】
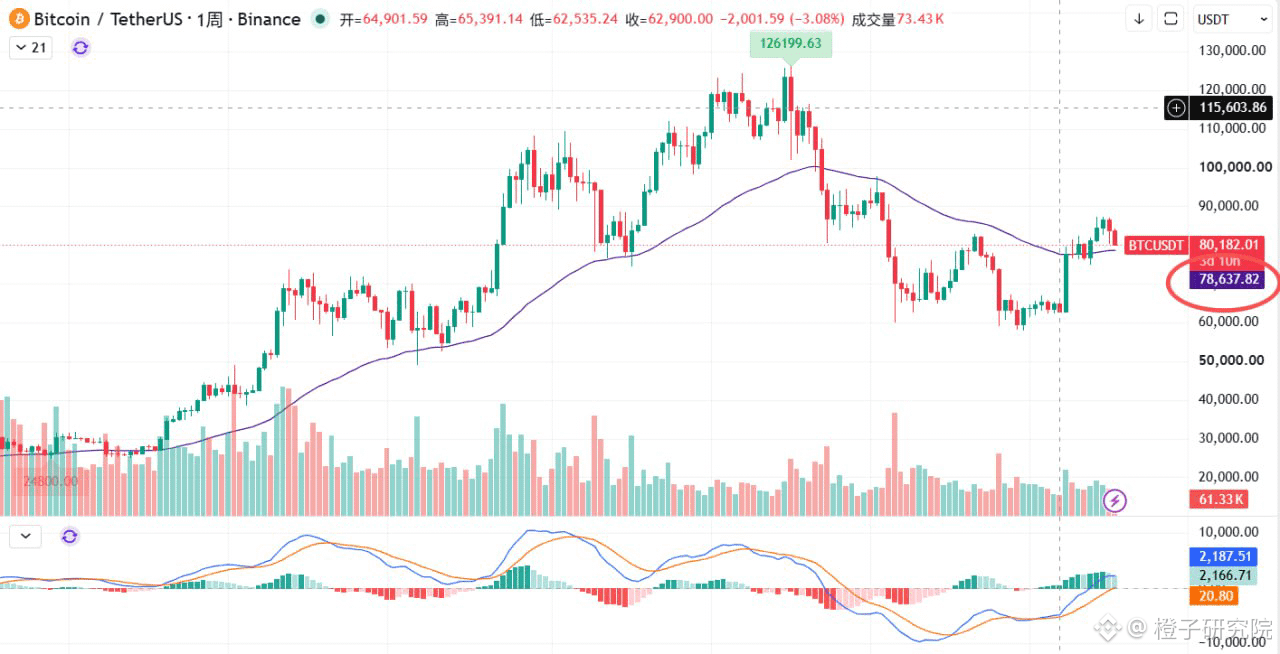
Now let’s look at the moving averages. The weekly EMA52 is around 78,600. This is a highly significant moving average; if you’re interested, you can check it against the weekly chart. The support on the first retest was quite strong. Taking all of this into account, we don’t expect much further downside for Bitcoin. The 78,600–76,100 range is worth watching closely.【❤️See Figure 3】
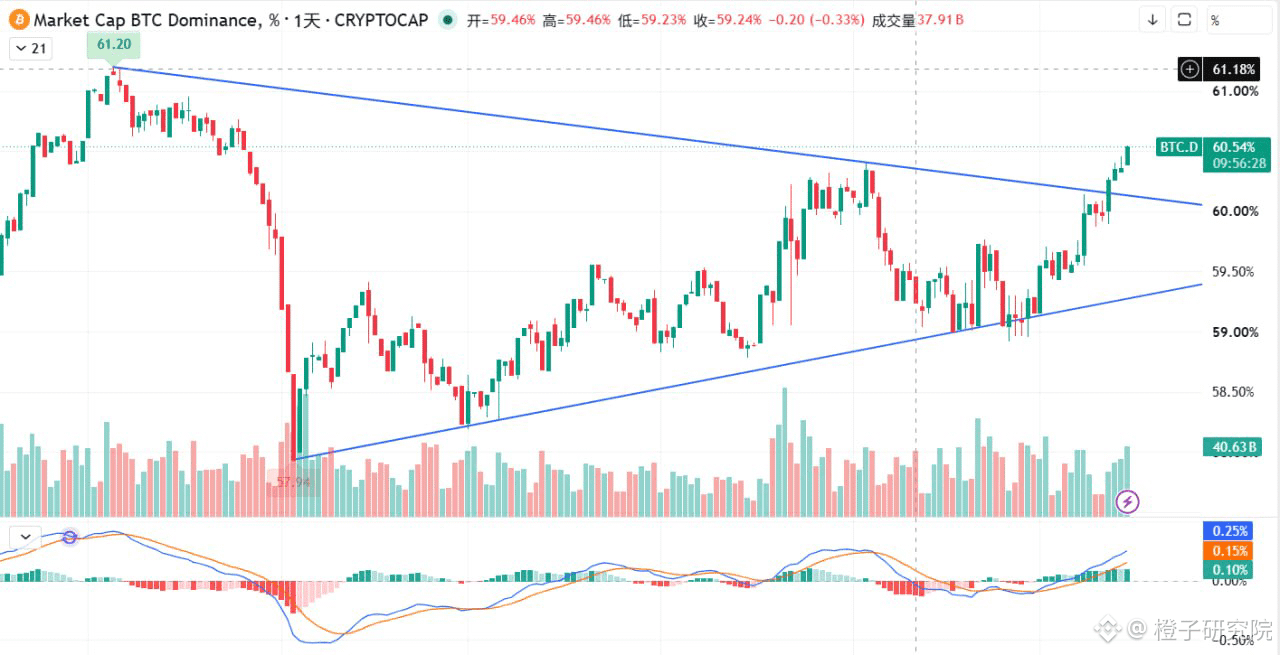
As for altcoins, Bitcoin dominance has broken above the resistance of the triangle range and continues to rise. As prices fall, altcoins are likely to be drained of liquidity even more noticeably. If you enter the market, be sure to scale in gradually—don’t go all in at once, or you could end up in a difficult position!【❤️See Figure 4】
Trading suggestion: Personally and as a community, we are already heavily positioned in spot. Those with smaller positions may consider adding gradually.
#BTC走势分析 $ETH #sol $UNI

8
1
34
7k
·
--
【All positions in the community have been bought back around 82,000! Can Bitcoin use tonight’s CPI release to break above its previous high?】
Bitcoin’s pullback has largely followed the pace we expected. It retested the previous low and found solid support, then bounced smoothly. It’s now around 84,100.
Next, all eyes are on 85,000. Whether the price can break through decisively will determine if it can continue toward the previous high in the short term (the trendline resistance).
U.S. CPI data is due at 8:30 tonight, and volatility may pick up around the release. The market’s biggest concern right now is inflation coming in higher than expected and shifting interest rate expectations. So don’t just watch whether prices go up or down tonight—also watch how the market reacts after the data comes out. (Reuters)
In the community, all spot positions have now been bought back around 82,000, so we’re currently heavily invested in spot.
Now that our positions are back up, patience is even more important. If 85,000 breaks, we’ll keep watching for the previous high and possibly a new high. If the breakout fails, we also need to accept the possibility that the market will continue to trade sideways.
As a seasoned crypto trader, the most important thing isn’t getting every call right. It’s having a plan in advance, holding on when the opportunity comes, and knowing how to respond when risk appears.
Tonight, focus on CPI and 85,000. Wait for the market to show its direction before making a judgment, and don’t lose your rhythm over a few sudden wicks.
Trading suggestion: Continue holding your spot positions and wait for a chance to exit near the highs and trade the swings.
#BTC走势分析 $ETH $SOL

7
32
5.8k
·
--
【BTC fell without breaking support—does that give it more confidence to break out? Keep a close eye on 85,000 next】
Yesterday, we said Bitcoin was facing significant resistance around 85,000. After meeting resistance, it would most likely look for support lower down, with 82,100 as the first key level to watch, followed by 80,400.
So far, the market has broadly moved as expected. Bitcoin has retested the area near its previous low, and support held as anticipated. It then rebounded smoothly, completing a second test of support.
The key level to watch next is still 85,000.
Looking at the price action so far, resistance here is considerable. Even if Bitcoin makes another attempt in the short term, it may still trade back and forth. But completing this second test shows that support below has held up, giving it more confidence for a potential upside breakout.
So, for now, the overall outlook is cautiously optimistic.
If Bitcoin can break above 85,000 convincingly and hold there, it may have a chance to challenge its previous high and perhaps even reach a new one. However, be alert to the possibility of a short-term bull trap after a breakout. Don’t chase the rally blindly just because the price has broken out.
For now, keep watching to see whether Bitcoin breaks through 85,000. There’s no need to rush into buying or selling. Support has been confirmed, so a rebound is possible, but the next phase of the trend will ultimately depend on whether the price can decisively hold above this key resistance level.
The second test is complete; keep watching 85,000. If it breaks through, the previous high is next—but the higher it goes, the more mindful you need to be of the risks.
Position: Currently heavily invested in spot; just continue holding
#BTC走势分析 $SOL #ETH

橙子研究院
·
--
【 $BTC Capped by 87268 for Two Consecutive Months! Why Can’t It Break Through in the Early Bull Market?】
Bitcoin’s price action over the past couple of days has been testing our patience. After briefly dipping below 80,000 and recovering, it ran into resistance near 85,000 and has continued to move sideways within a narrow range.
On the weekly chart, we have a moderately bearish candle down 3%, erasing the previous small bullish candle. However, it also has a long lower wick, suggesting that gains may be hard to come by this week, while buyers are stepping in to support the price on dips. A smooth decline is unlikely either, so the most likely scenario is continued weak, range-bound trading.
On the daily chart, the price is currently meeting resistance near 85,000 at the breakdown trendline we’ve been watching closely. Whether it can reclaim and hold this level will determine what happens next. If it gets back above and holds, it could revisit the previous high or even set a new one. If it continues to fail to break through, the market will weaken and move lower.
Looking at the monthly Bollinger Bands, the price has been capped by the middle band at 87268 for two consecutive months. As the dividing line between strength and weakness in the broader trend, this level won’t be easy to break decisively. It will take repeated attempts and sustained accumulation of trading volume—which is exactly why we characterize this as the early stage of a bull market!
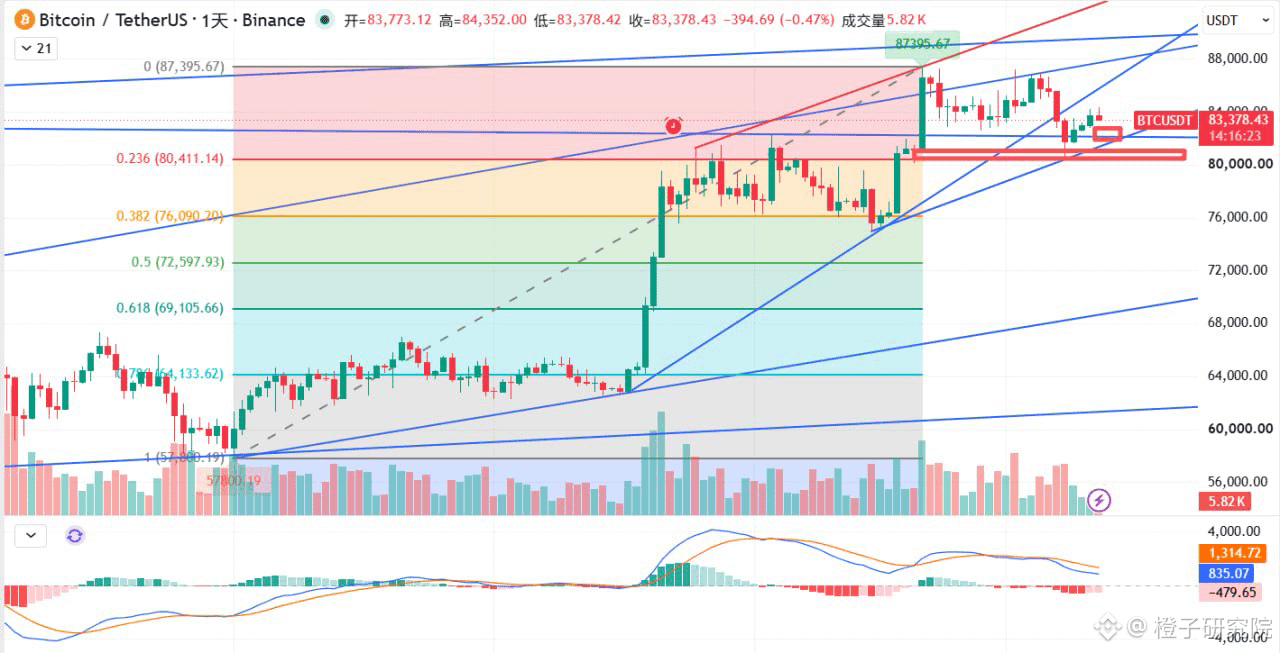
Overall, resistance near 85000 remains significant for now, and the most likely scenario is a rejection followed by a move down to look for support.
That said, the downside may be limited. First, watch 82100, followed by the Fibonacci 0.236 level at 80400. This level has already held during a previous decline, so near-term support looks fairly solid.【❤️As shown in Figure 1】
For now, it’s best to watch more and trade less. The price action ahead may be more complex than expected, so it’s safer to wait until the direction becomes relatively clear before making a decision!
Trading plan: I’ve now fully replenished my Binance community spot position near the lows, around 82000. I’m currently heavily invested in spot, so I’ll simply hold.【❤️As shown in Figure 2】
#BTC走势分析 $SOL #eth
6
36
4.2k
·
--
【 $BTC Capped by 87268 for Two Consecutive Months! Why Can’t It Break Through in the Early Bull Market?】
Bitcoin’s price action over the past couple of days has been testing our patience. After briefly dipping below 80,000 and recovering, it ran into resistance near 85,000 and has continued to move sideways within a narrow range.
On the weekly chart, we have a moderately bearish candle down 3%, erasing the previous small bullish candle. However, it also has a long lower wick, suggesting that gains may be hard to come by this week, while buyers are stepping in to support the price on dips. A smooth decline is unlikely either, so the most likely scenario is continued weak, range-bound trading.
On the daily chart, the price is currently meeting resistance near 85,000 at the breakdown trendline we’ve been watching closely. Whether it can reclaim and hold this level will determine what happens next. If it gets back above and holds, it could revisit the previous high or even set a new one. If it continues to fail to break through, the market will weaken and move lower.
Looking at the monthly Bollinger Bands, the price has been capped by the middle band at 87268 for two consecutive months. As the dividing line between strength and weakness in the broader trend, this level won’t be easy to break decisively. It will take repeated attempts and sustained accumulation of trading volume—which is exactly why we characterize this as the early stage of a bull market!
Overall, resistance near 85000 remains significant for now, and the most likely scenario is a rejection followed by a move down to look for support.
That said, the downside may be limited. First, watch 82100, followed by the Fibonacci 0.236 level at 80400. This level has already held during a previous decline, so near-term support looks fairly solid.【❤️As shown in Figure 1】
For now, it’s best to watch more and trade less. The price action ahead may be more complex than expected, so it’s safer to wait until the direction becomes relatively clear before making a decision!
Trading plan: I’ve now fully replenished my Binance community spot position near the lows, around 82000. I’m currently heavily invested in spot, so I’ll simply hold.【❤️As shown in Figure 2】
#BTC走势分析 $SOL #eth

16
1
42
5.7k
·
--
【 $BTC The drop nearly broke 80,000! Why am I still bullish on $180,000—$200,000?】
The past couple of days have really been a bit scary for Bitcoin.
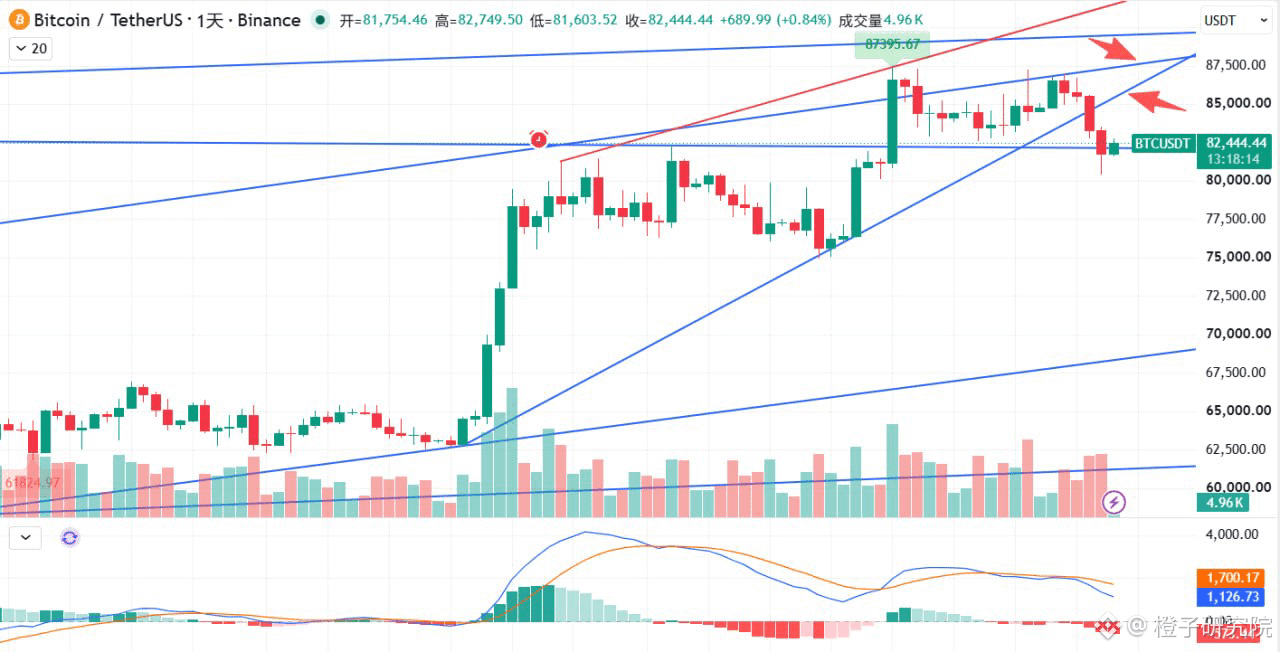
The 83,500 support level up front failed to hold, and the price dropped straight to 80,393 at the low, just a hair away from punching through the last line of defense at 80,000. Although the daily candle closed back above 81,754, this selloff was both fast and brutal, and the short-term structure has already been damaged.
So, the previous expectation of 90,000, I’m now proactively lowering to around 87,000.
First, watch 82,800 above, then 85,000. If the rebound reaches that area but still can’t break through, be careful that 87,395 may become the stage top. There is also a dense area of short positions around 84,000 and 86,800, so pay close attention if price reaches those levels.
But as a veteran who entered the crypto market in 2017, I’m not going to overturn the entire bull-market thesis just because of one big bearish candle.
The broader trend is still bullish; it’s just that this bull run may be moving faster than before. If the cycle comes earlier, the top may also come earlier, but the long-term target is still $180,000—$200,000.
Of course, being bullish doesn’t mean going all-in blindly right now.
If you already hold spot positions, you can keep holding them. If the market continues to pull back in the short term, 75,000—78,000 is a zone worth watching. As for altcoins, I’d rather look for projects like UNI, AAVE, and HYPE that have revenue, buyback, or burn mechanics, instead of chasing whatever coin is pumping the hardest.
Keep total altcoin exposure within 30%, and leave the rest of your capital for real opportunities.
In a bull market, the hardest thing isn’t being bullish — it’s staying bullish while still controlling your position size.
#BTC走势分析 $SOL #ETH $MSTRB

橙子研究院
·
--
【U.S. stocks, Treasury yields, and oil prices pile on the pressure! BTC bottoms at 80393—could 87395 mark a local top?】
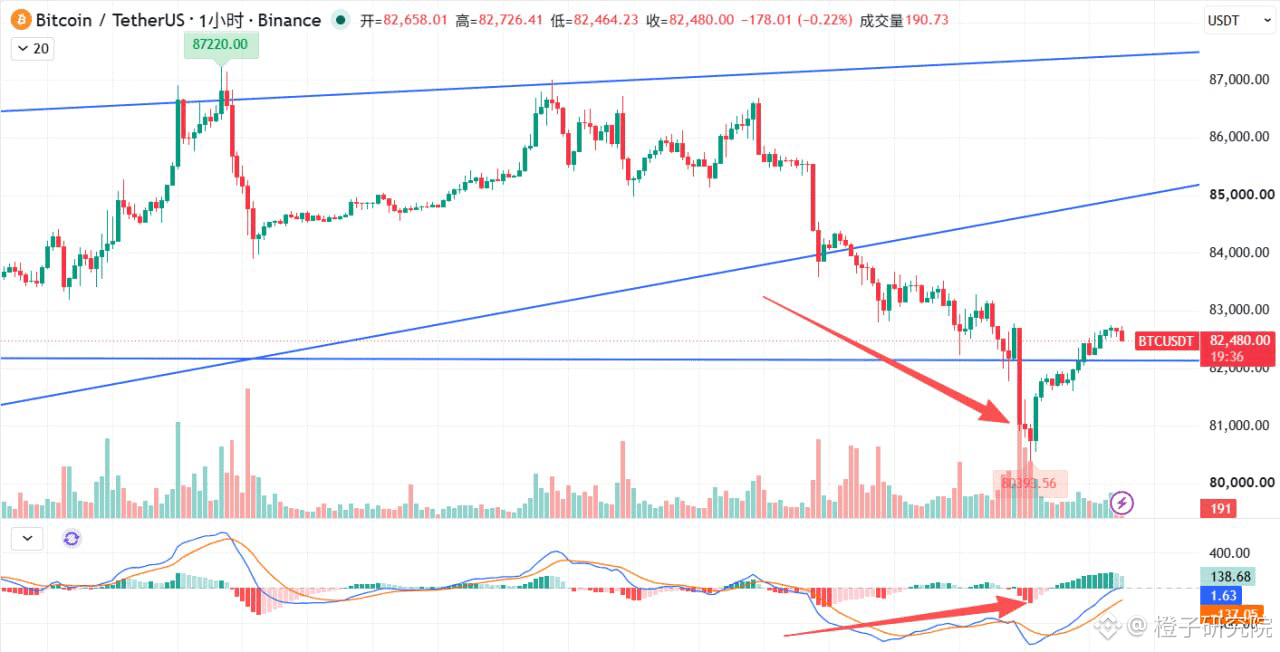
$BTC After the U.S. government repeatedly transferred seized assets to exchanges, and amid a sharp evening sell-off in U.S. tech stocks, a surge in Treasury yields, and a jump in oil prices, BTC suffered a steep decline, plunging to a low of 80393—just a hair’s breadth above the final line of defense at 80000.
Although the low still landed near the lower end of our expected range, around 81000, the high-volume plunge straight to 80000 with no pause was a little too deep.
Fortunately, the daily candle still closed back above 81754. It wasn’t a decisive breakdown, which bought the market some time to rebound.
Since the support zone was cleanly and decisively broken, damaging the structure, we should lower our expectations for a new high.
BTC has already gradually erased its largest bearish candle on the one-hour chart, and the MACD has formed a very clear bullish divergence. However, a bullish divergence on a higher timeframe has yet to take shape, so this rebound probably won’t be a smooth one, and its strength remains to be seen【❤️As shown in Figure 1】
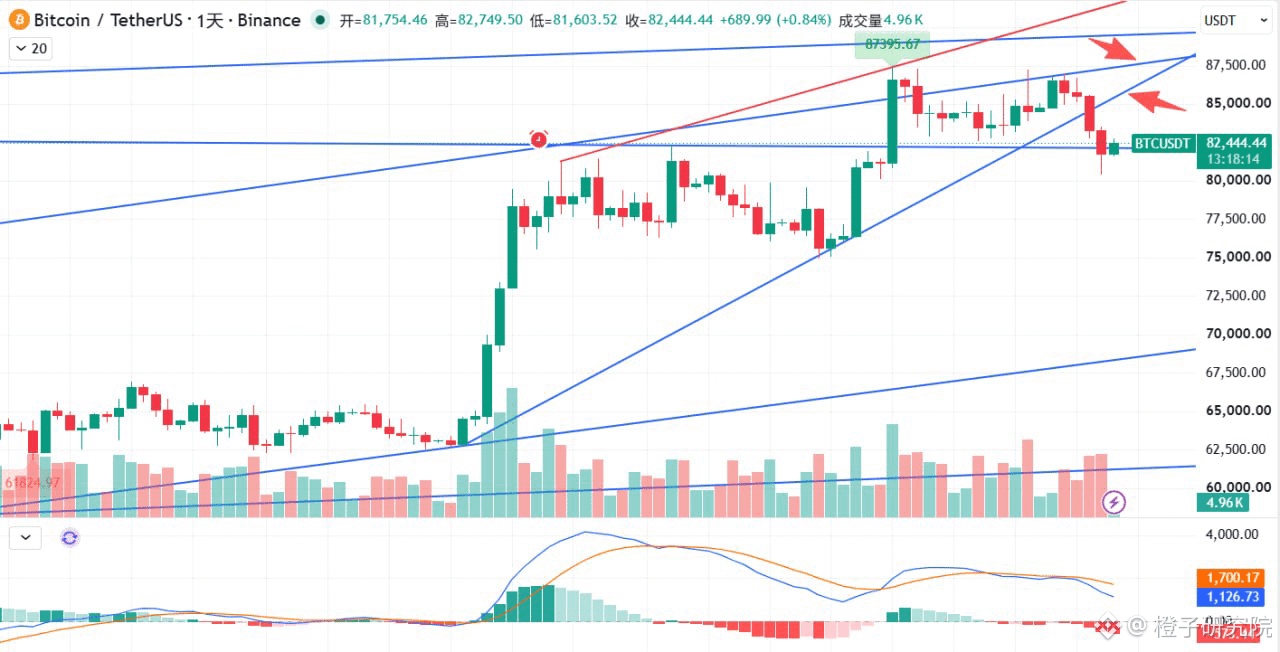
Right now, price is facing the first resistance near 82800. Based on the price action, a break above this level seems fairly likely. Above that, price will encounter resistance near 85000 at the broken trendline. That’s where things become uncertain. If price can’t push higher, we may see a rebound to retest the breakdown, which would greatly increase the odds of 87395 being the top【❤️As shown in Figure 2】
We should also lower our highest expected target from around 90000 to around 87000. If price reaches that level, consider it an opportunity to significantly reduce your position. There probably won’t be much room left to run, so it’s more prudent to wait for a pullback and then buy back in.
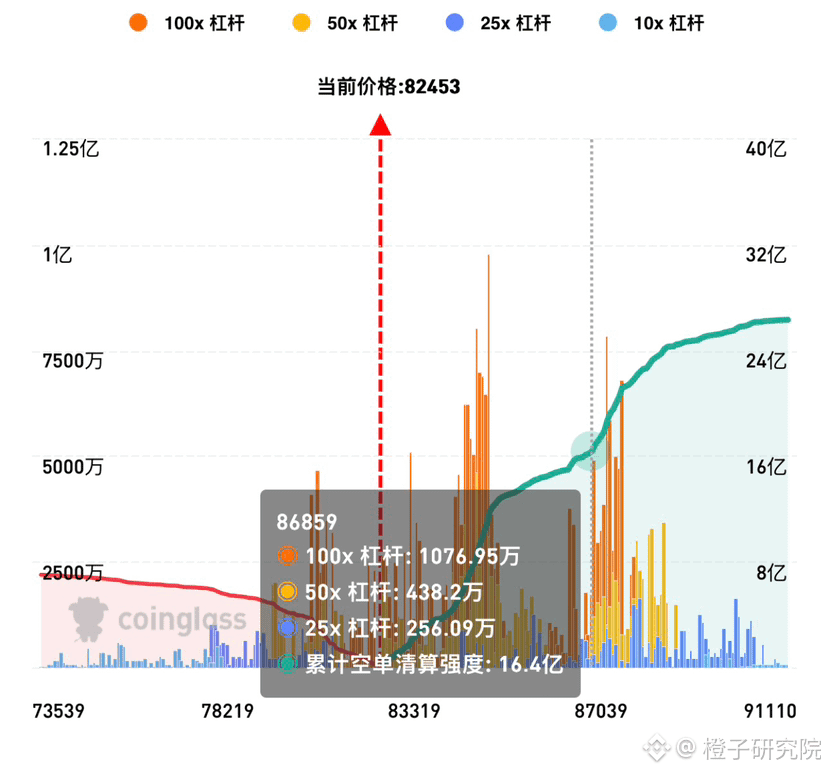
The liquidation map shows two clusters of short positions, around 84000 and 86800, which broadly coincide with our resistance levels. Keep a close eye on price when it reaches these areas!【❤️As shown in Figure 3】
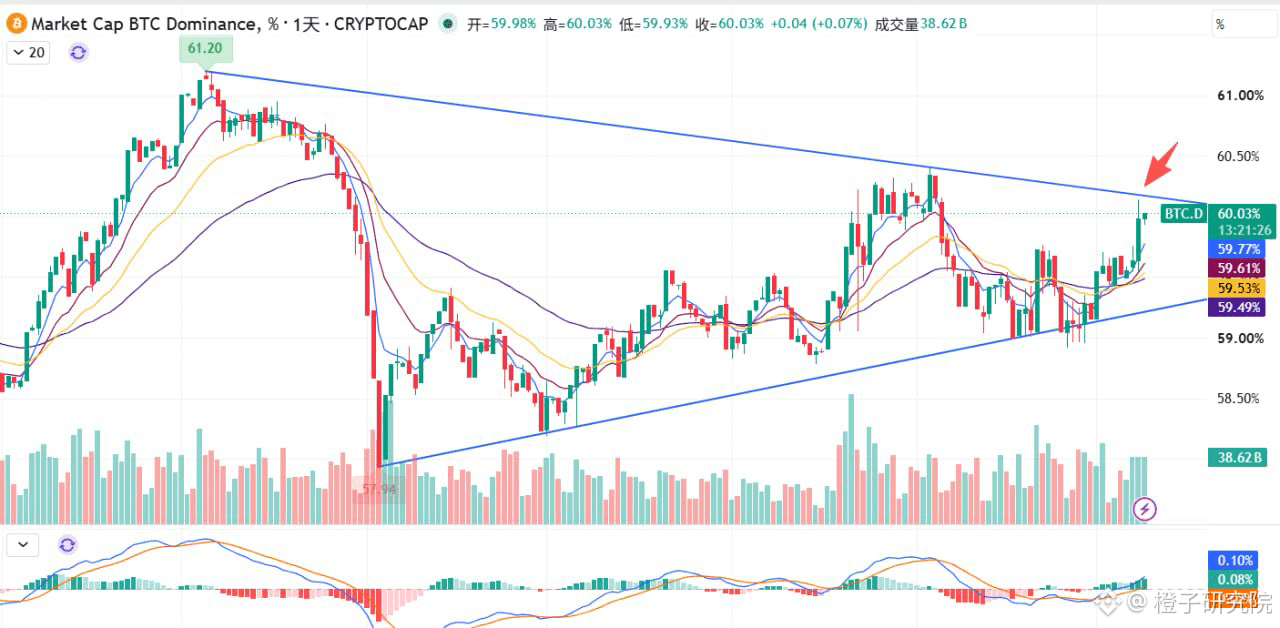
Altcoins have taken a double hit during the decline: the drop itself, plus BTC sucking liquidity out of the market. As a result, they’ve fallen particularly hard. Looking at market dominance, there’s still a little room before it reaches resistance, so don’t chase altcoins that have already surged. They’re always the first to get hit when BTC sucks up liquidity, so be mindful of the risk!【❤️As shown in Figure 4】
Trading plan: Yesterday, those who sold near 87000 to trade the range while BTC was between 81000 and 82000 have now fully bought back in. We’re waiting to take profits and exit in batches near 86000.
#BTC走势分析 $ETH
28
53
8.4k
·
--
【U.S. stocks, Treasury yields, and oil prices pile on the pressure! BTC bottoms at 80393—could 87395 mark a local top?】
$BTC After the U.S. government repeatedly transferred seized assets to exchanges, and amid a sharp evening sell-off in U.S. tech stocks, a surge in Treasury yields, and a jump in oil prices, BTC suffered a steep decline, plunging to a low of 80393—just a hair’s breadth above the final line of defense at 80000.
Although the low still landed near the lower end of our expected range, around 81000, the high-volume plunge straight to 80000 with no pause was a little too deep.
Fortunately, the daily candle still closed back above 81754. It wasn’t a decisive breakdown, which bought the market some time to rebound.
Since the support zone was cleanly and decisively broken, damaging the structure, we should lower our expectations for a new high.
BTC has already gradually erased its largest bearish candle on the one-hour chart, and the MACD has formed a very clear bullish divergence. However, a bullish divergence on a higher timeframe has yet to take shape, so this rebound probably won’t be a smooth one, and its strength remains to be seen【❤️As shown in Figure 1】
Right now, price is facing the first resistance near 82800. Based on the price action, a break above this level seems fairly likely. Above that, price will encounter resistance near 85000 at the broken trendline. That’s where things become uncertain. If price can’t push higher, we may see a rebound to retest the breakdown, which would greatly increase the odds of 87395 being the top【❤️As shown in Figure 2】
We should also lower our highest expected target from around 90000 to around 87000. If price reaches that level, consider it an opportunity to significantly reduce your position. There probably won’t be much room left to run, so it’s more prudent to wait for a pullback and then buy back in.
The liquidation map shows two clusters of short positions, around 84000 and 86800, which broadly coincide with our resistance levels. Keep a close eye on price when it reaches these areas!【❤️As shown in Figure 3】
Altcoins have taken a double hit during the decline: the drop itself, plus BTC sucking liquidity out of the market. As a result, they’ve fallen particularly hard. Looking at market dominance, there’s still a little room before it reaches resistance, so don’t chase altcoins that have already surged. They’re always the first to get hit when BTC sucks up liquidity, so be mindful of the risk!【❤️As shown in Figure 4】
Trading plan: Yesterday, those who sold near 87000 to trade the range while BTC was between 81000 and 82000 have now fully bought back in. We’re waiting to take profits and exit in batches near 86000.
#BTC走势分析 $ETH
14
1
40
6.4k
·
--
【 $BTC Another wick? 82200 enters a strong support zone, with a rebound target of 87000-90000?!】
Yesterday’s article mentioned that the support at 83500 was questionable. Sure enough, Bitcoin continued lower in search of support and has now retested 82227, reaching the upper end of our estimated range.
Looking at how the price action is developing, the one-hour candle closed with a long lower wick, so support here is clearly evident. However, the decline came with increased volume, and the bullish divergence is only on the one-hour timeframe. It’s hard to say whether there will be another sharp wick, but price has already entered a strong support zone. Even if it wicks down again to around 81000, there’s still a good chance it will hold. As long as price finds a bottom here and starts to rebound, we still expect it to go on to make a new high.
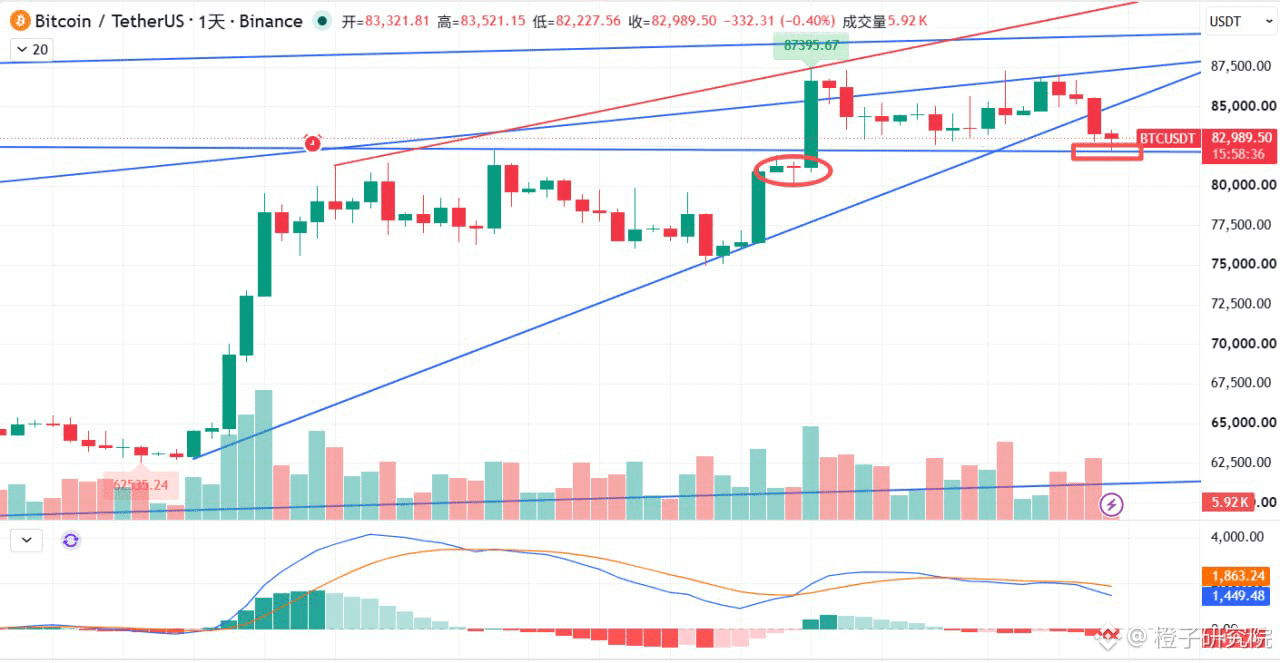
One thing to note, though: Bitcoin must not decisively break below the lower boundary of the September 20 breakout starting point. A break below would mean this rebound trade could be over—that level is 80126. So around 80000 is our last line of defense and deserves close attention! 【❤️As shown in Figure 1】
Back to the trading strategy: the most important thing in trading is the risk-reward ratio. From this level, the upside scenario is a new high, while the downside is a stop around 2000 dollars lower. Overall, the risk-reward ratio is quite favorable, making this a good entry point. If the market continues to develop as expected, the real risk is actually a false breakout near the new high. We’ve explained clearly what price action to look for and how to respond, so make sure you have a plan!
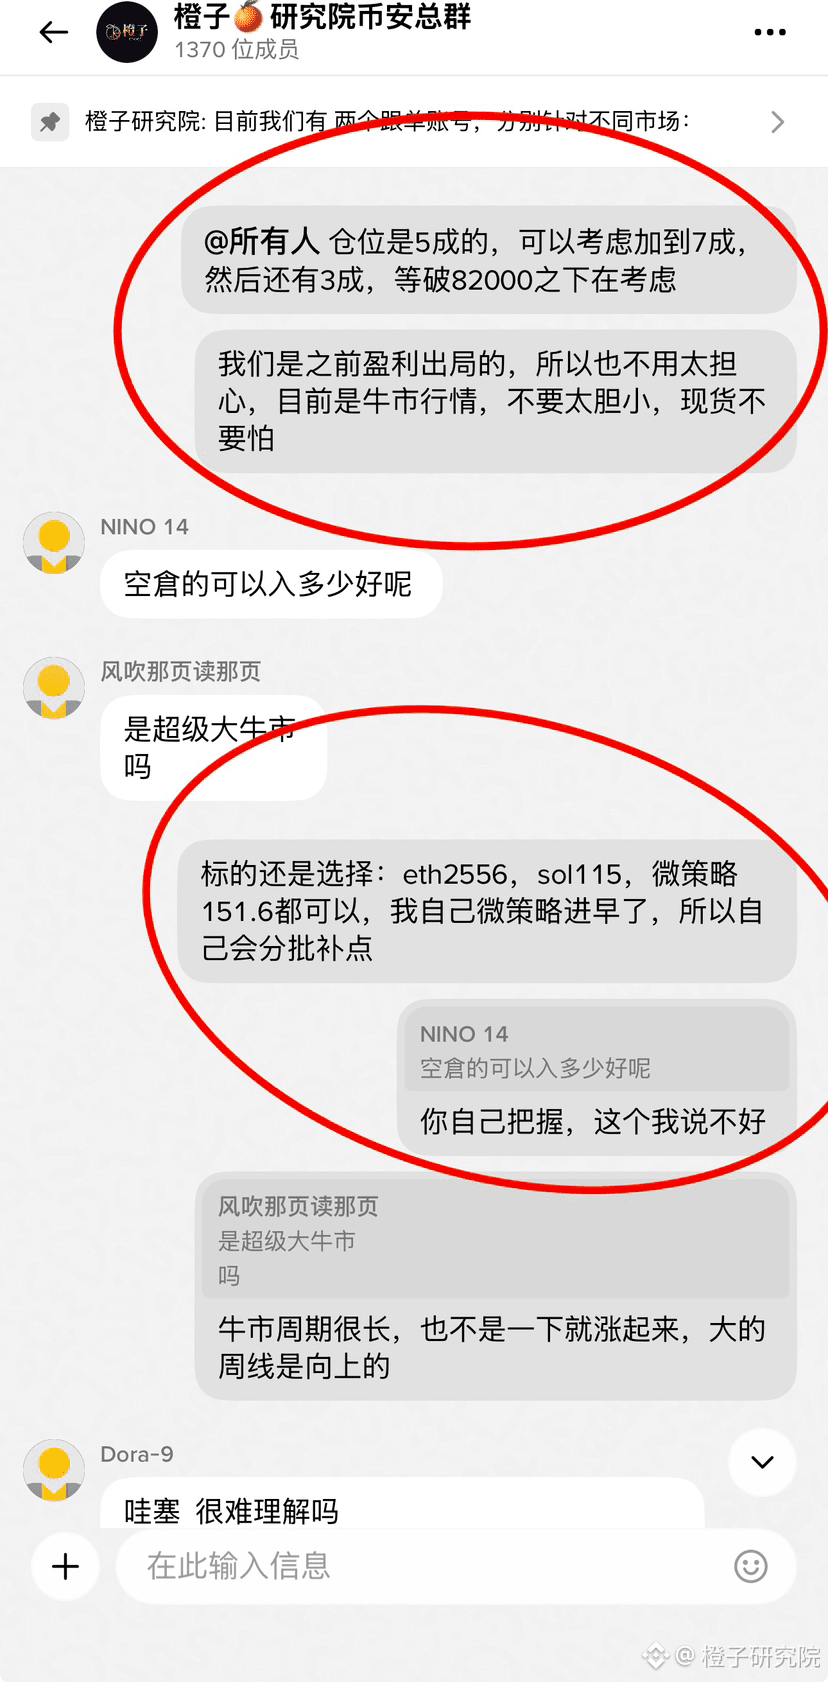
I exited 50% of my position near 87000 at the highs. I’ve now added back to 70% of my position, and still expect a rebound to 87000-90000. If price reaches that range, I’ll exit in stages. 【❤️As shown in Figures 2 and 3】
#BTC走势分析 $ETH #美联储纪要聚焦10月暂停加息 $SOL

橙子研究院
·
--
【 Repeated resistance at 87,000: Is Bitcoin’s first-stage rally nearing its end? Watch this range next 】
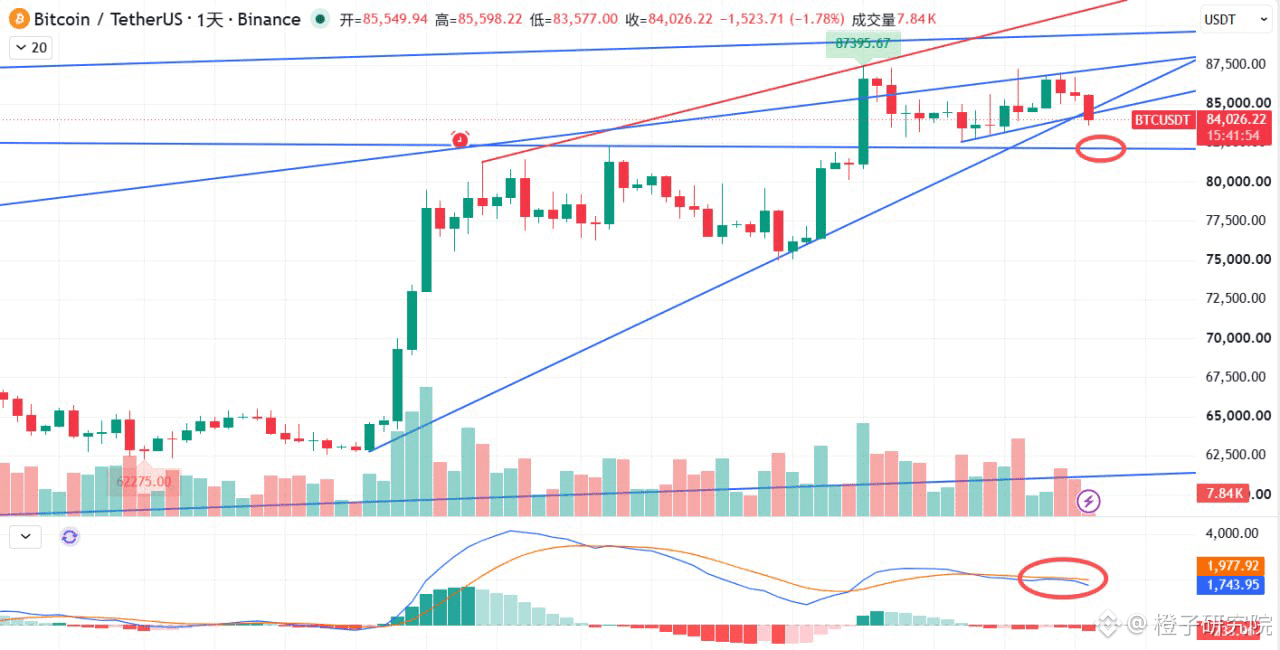
Bitcoin has tested the resistance near 87,000 several times but has yet to break through decisively. After news that a U.S. government address transferred out 833.6 BTC ($71.56 million) and that the funds had reached Coinbase, the market began to turn lower. Price failed to perform during the window period, which is a bit of a shame!
Bitcoin has now fallen below the smaller 4-hour ascending channel and found support at 83,500, but for now it remains uncertain whether it can stop falling here.
On the daily chart, the price has broken below the lower support of the wedge. If it cannot reclaim that level by the daily close, we’ll need to return to our previous view that it could retest the 82,200–81,000 area.
Looking at the MACD, the bullish crossover has failed and the fast line is starting to diverge downward, indicating weak momentum. Indicators across multiple timeframes are also showing a bearish crossover, so there’s still a high probability that the daily support level will fail. Fortunately, the strong support zone below isn’t far away, so patience is all that’s needed.
The first-stage rally is nearing its end, and complex, volatile price action is likely to be the norm from here. Don’t chase rallies or panic-sell—be sure to keep this in mind!
Position advice: Hold your existing spot position for now. Community exposure is currently at 50–70%. If the price reaches around 82,000, those with a 50% position can consider adding some back. The broader trend still has a strong chance of taking Bitcoin back to the 87,000–91,000 range.
#BTC走势分析 $ETH #币安推出BinanceIntelligence $SOL
18
34
10.9k
·
--
【 Repeated resistance at 87,000: Is Bitcoin’s first-stage rally nearing its end? Watch this range next 】
Bitcoin has tested the resistance near 87,000 several times but has yet to break through decisively. After news that a U.S. government address transferred out 833.6 BTC ($71.56 million) and that the funds had reached Coinbase, the market began to turn lower. Price failed to perform during the window period, which is a bit of a shame!
Bitcoin has now fallen below the smaller 4-hour ascending channel and found support at 83,500, but for now it remains uncertain whether it can stop falling here.
On the daily chart, the price has broken below the lower support of the wedge. If it cannot reclaim that level by the daily close, we’ll need to return to our previous view that it could retest the 82,200–81,000 area.
Looking at the MACD, the bullish crossover has failed and the fast line is starting to diverge downward, indicating weak momentum. Indicators across multiple timeframes are also showing a bearish crossover, so there’s still a high probability that the daily support level will fail. Fortunately, the strong support zone below isn’t far away, so patience is all that’s needed.
The first-stage rally is nearing its end, and complex, volatile price action is likely to be the norm from here. Don’t chase rallies or panic-sell—be sure to keep this in mind!
Position advice: Hold your existing spot position for now. Community exposure is currently at 50–70%. If the price reaches around 82,000, those with a 50% position can consider adding some back. The broader trend still has a strong chance of taking Bitcoin back to the 87,000–91,000 range.
#BTC走势分析 $ETH #币安推出BinanceIntelligence $SOL
10
1
50
9.1k
·
--
Bullish
【Is 87,000 just the first hurdle? BTC’s next targets are 89,500, or even 92,000!】
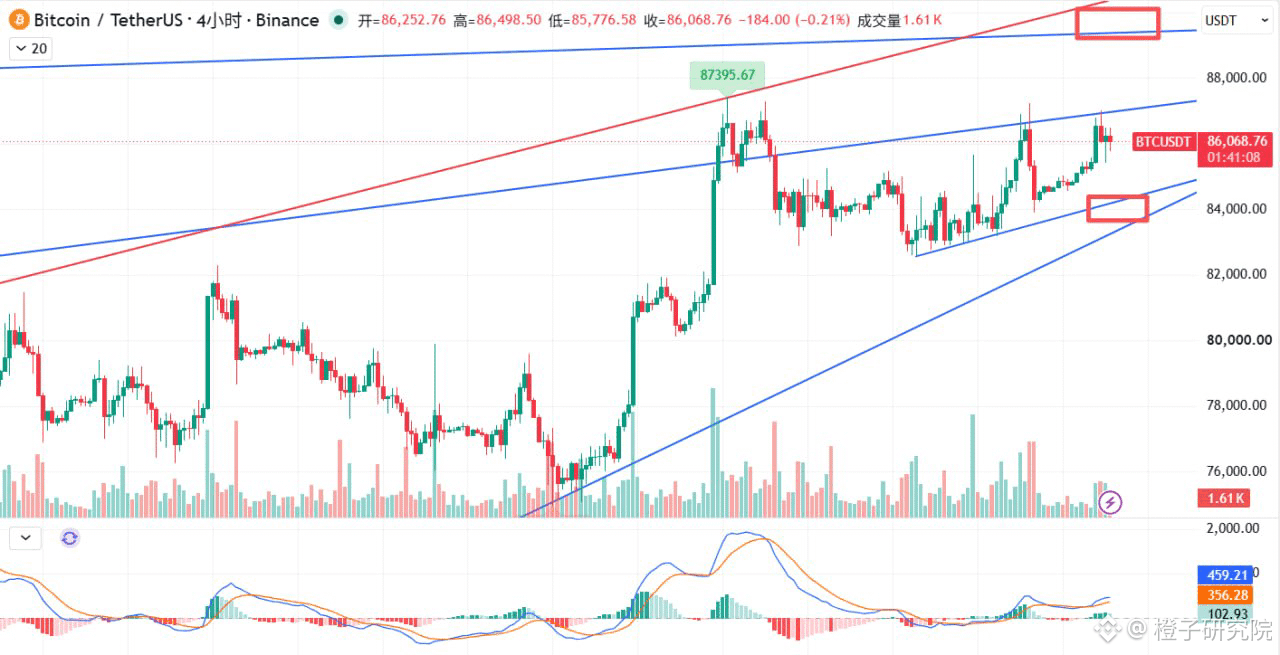
$BTC has been moving in a narrow range, with higher lows and a relatively strong trend. It’s showing signs of gradually improving by moving sideways instead of falling. Support has moved up to around 83,700, and downside potential has been reduced.
The weekly chart closed with a small bullish candle and is steadily moving up, with nothing unusual in sight. After a bearish MACD crossover on the daily chart, the fast and slow lines have become entangled rather than diverging downward, and could cross bullishly at any time. On the 4-hour chart, there’s a bullish crossover above the zero line, and the consolidation phase is complete.
Overall, price is currently capped by resistance at 87,000, but selling pressure is weak. When a market refuses to fall, watch for a potential rise.
The 87,000 resistance overhead is bound to be broken. The neckline of the previous major head-and-shoulders top has moved up to around 89,500, which should be reached.
Since most short positions in the market are placed between 89,000 and 90,000, if price reaches 89,500, it will most likely keep going to liquidate more shorts and capture liquidity higher up. It could spike to around 91,000–92,000, so just keep that in mind! 【❤️As shown in Figure 1】
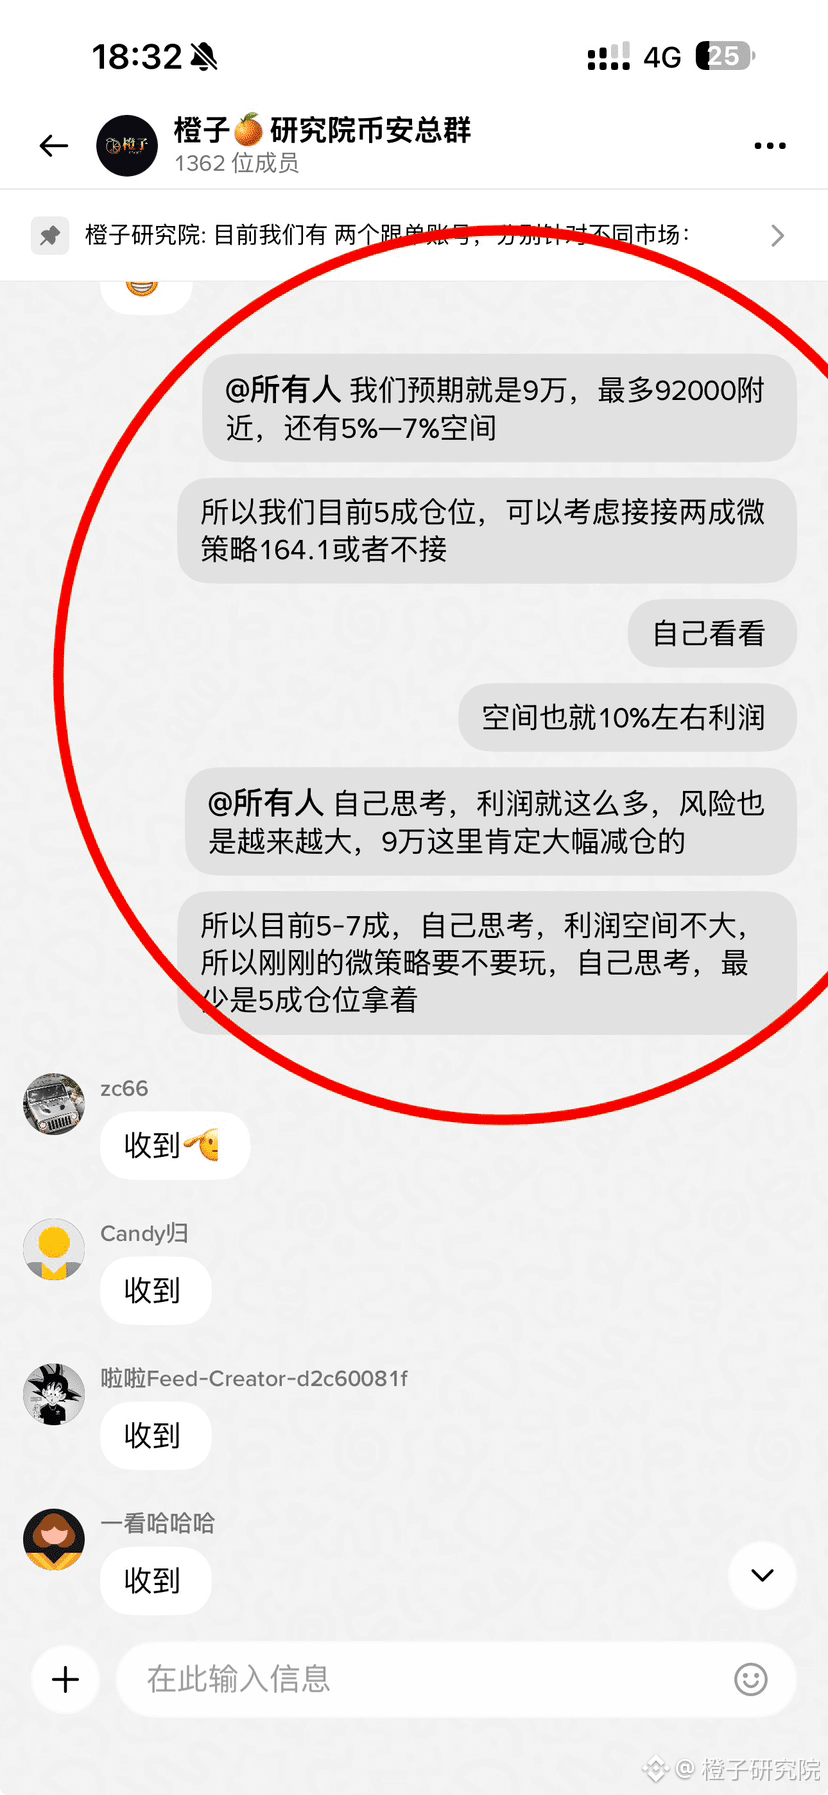
First round of buying the dip:
ETH at 1,556, SOL at 65, about 40% of the total position 【❤️As shown in Figure 3】
Second round of buying the dip:
ETH at 2,400, SOL at 98, MSTRB at 157.6 【❤️As shown in Figure 4】
#BTC走势分析 $SOL #ETH $CRCLB


22
52
14.8k
Log in to explore more content
Join global crypto users on Binance Square
⚡️ Get latest and useful information about crypto.
💬 Trusted by the world’s largest crypto exchange.
👍 Discover real insights from verified creators.
Email / Phone number