
CRYPTOVISION _BNB
5.2k Posts

CRYPTOVISION _BNB
Perspectivas del mercado. Configuraciones de trading. Oportunidades en criptomonedas.
Open Trade
Frequent Trader
2.6 Years
28 Following
3.6K+ Followers
6.4K+ Liked
Posts
Portfolio
All
Quotes
PINNED
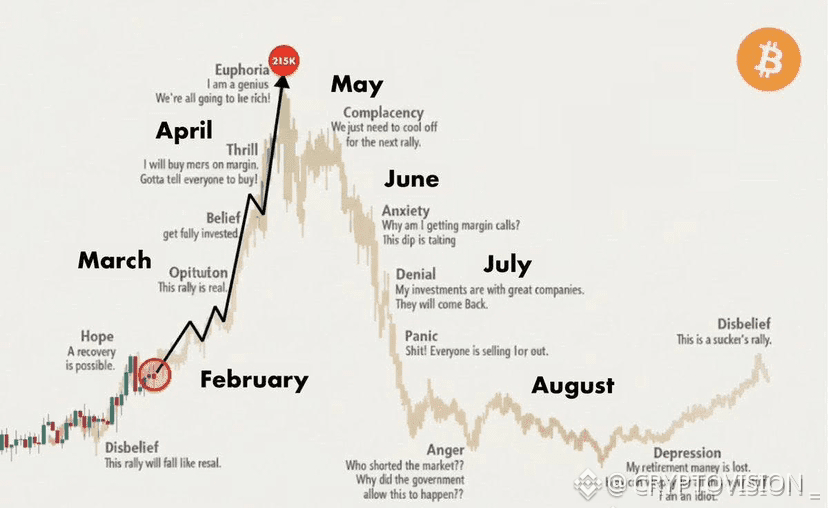
Predictions on the Bull Run of $BTC in 2026: A possible trajectory🎢
- February: Bear trap
- March: Gold/Silver drop -> Bitcoin skyrockets
- April: Altcoin season
- May: New All-Time High (ATH)
- June: Bull trap
- July: Mass liquidation
- August: Start of bear market
👉 These are speculative predictions and the market changes fast. Do you agree with this trajectory? 😂
trade down here ⬇️ with $BTC
- February: Bear trap
- March: Gold/Silver drop -> Bitcoin skyrockets
- April: Altcoin season
- May: New All-Time High (ATH)
- June: Bull trap
- July: Mass liquidation
- August: Start of bear market
👉 These are speculative predictions and the market changes fast. Do you agree with this trajectory? 😂
trade down here ⬇️ with $BTC
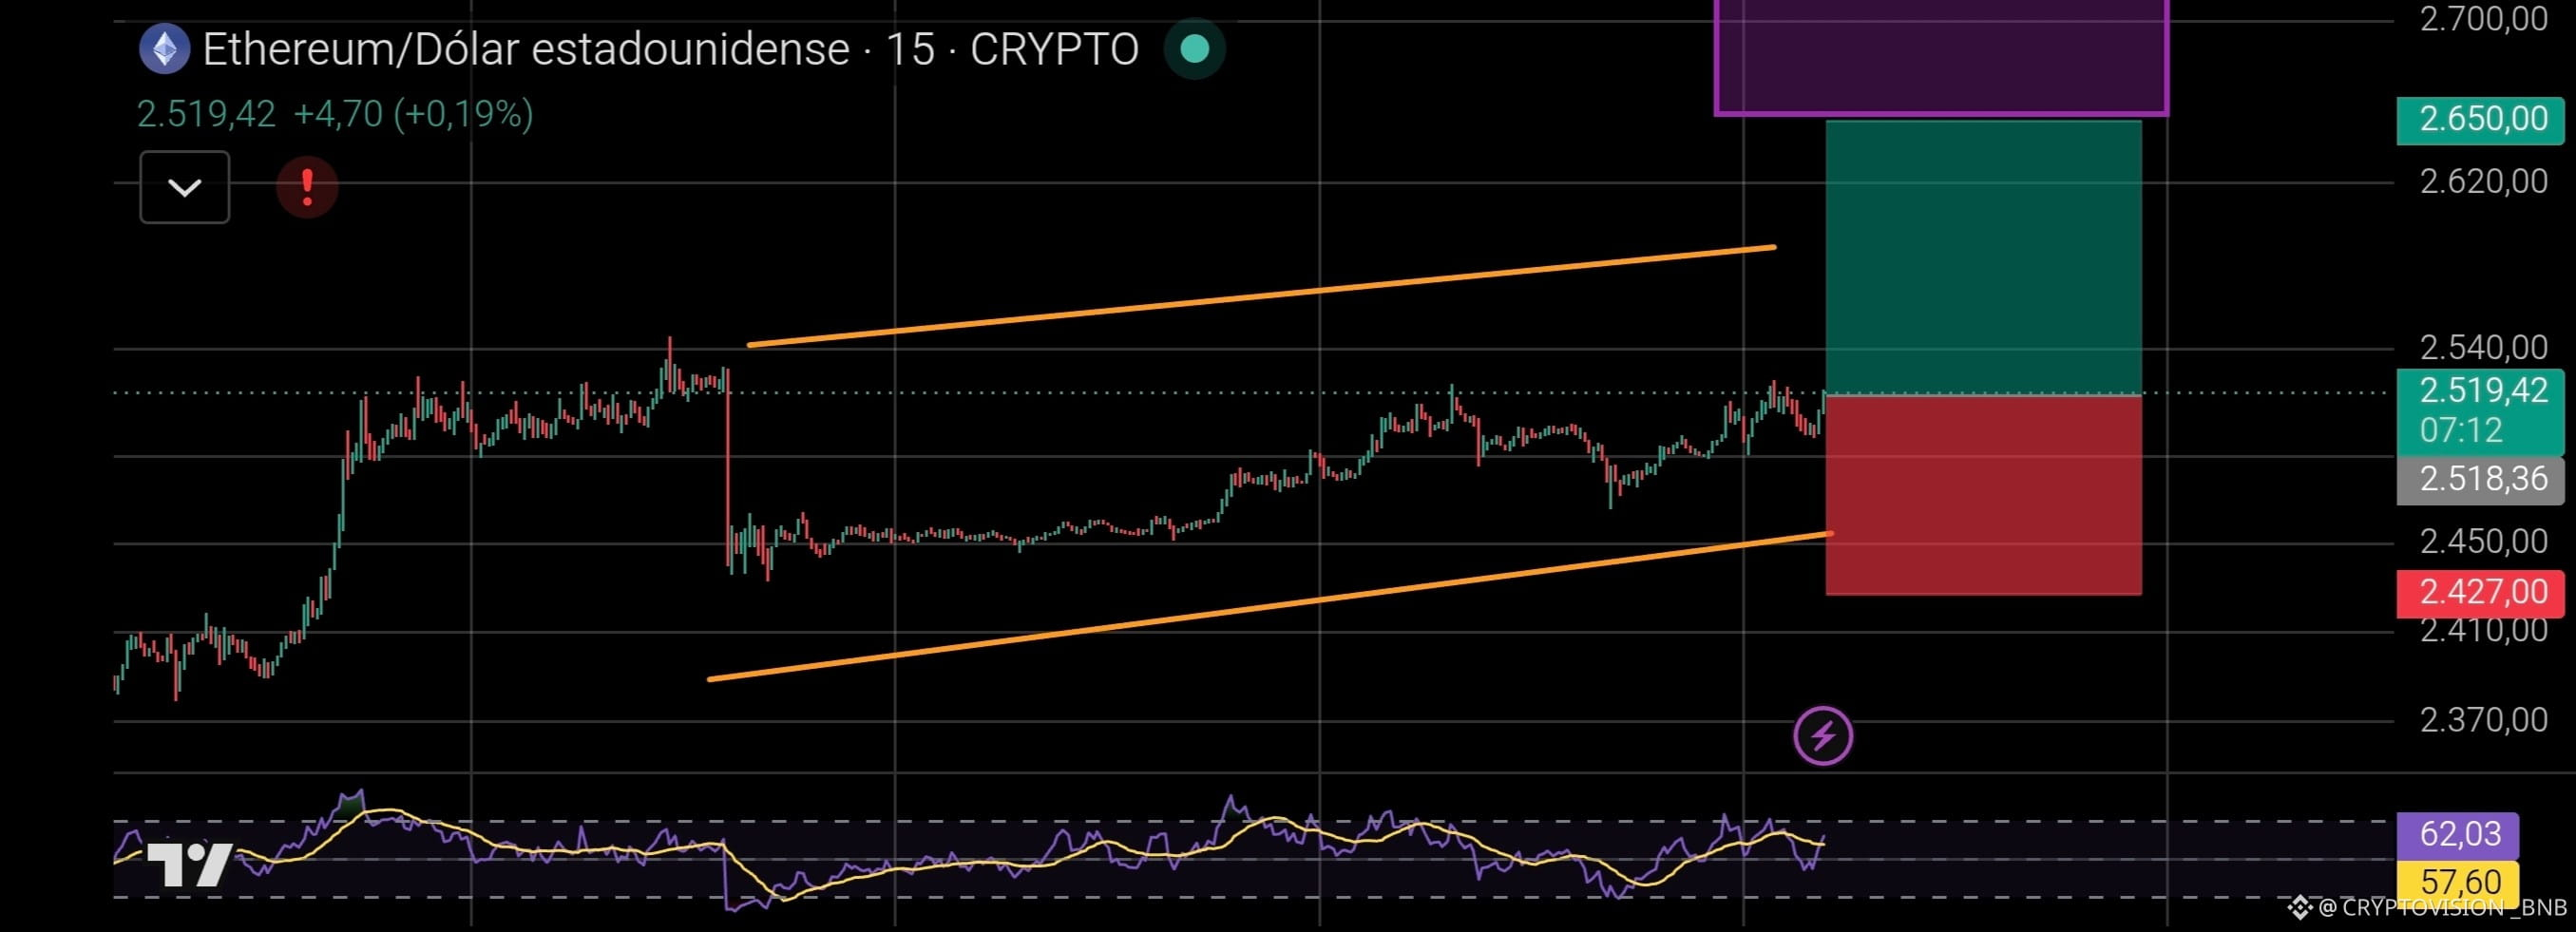
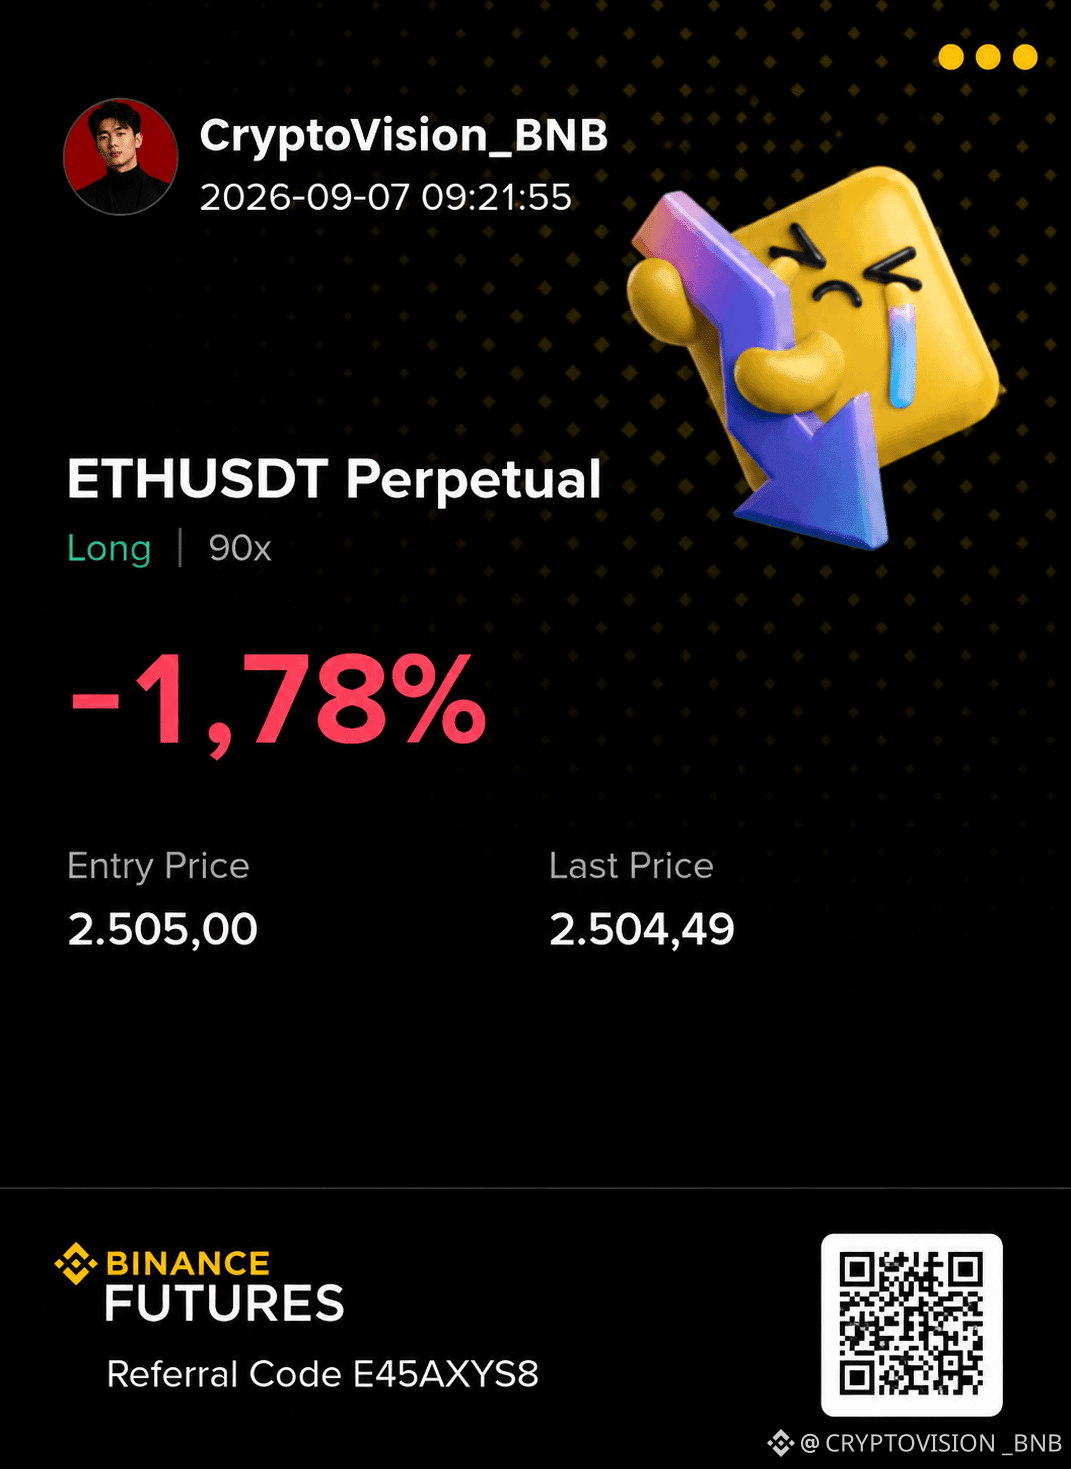
$ETH 🚀 New week, new setup.
SL: $2,427
TP: $2,650
Looking for a new bullish momentum.
Long $ETH 👇
SL: $2,427
TP: $2,650
Looking for a new bullish momentum.
Long $ETH 👇
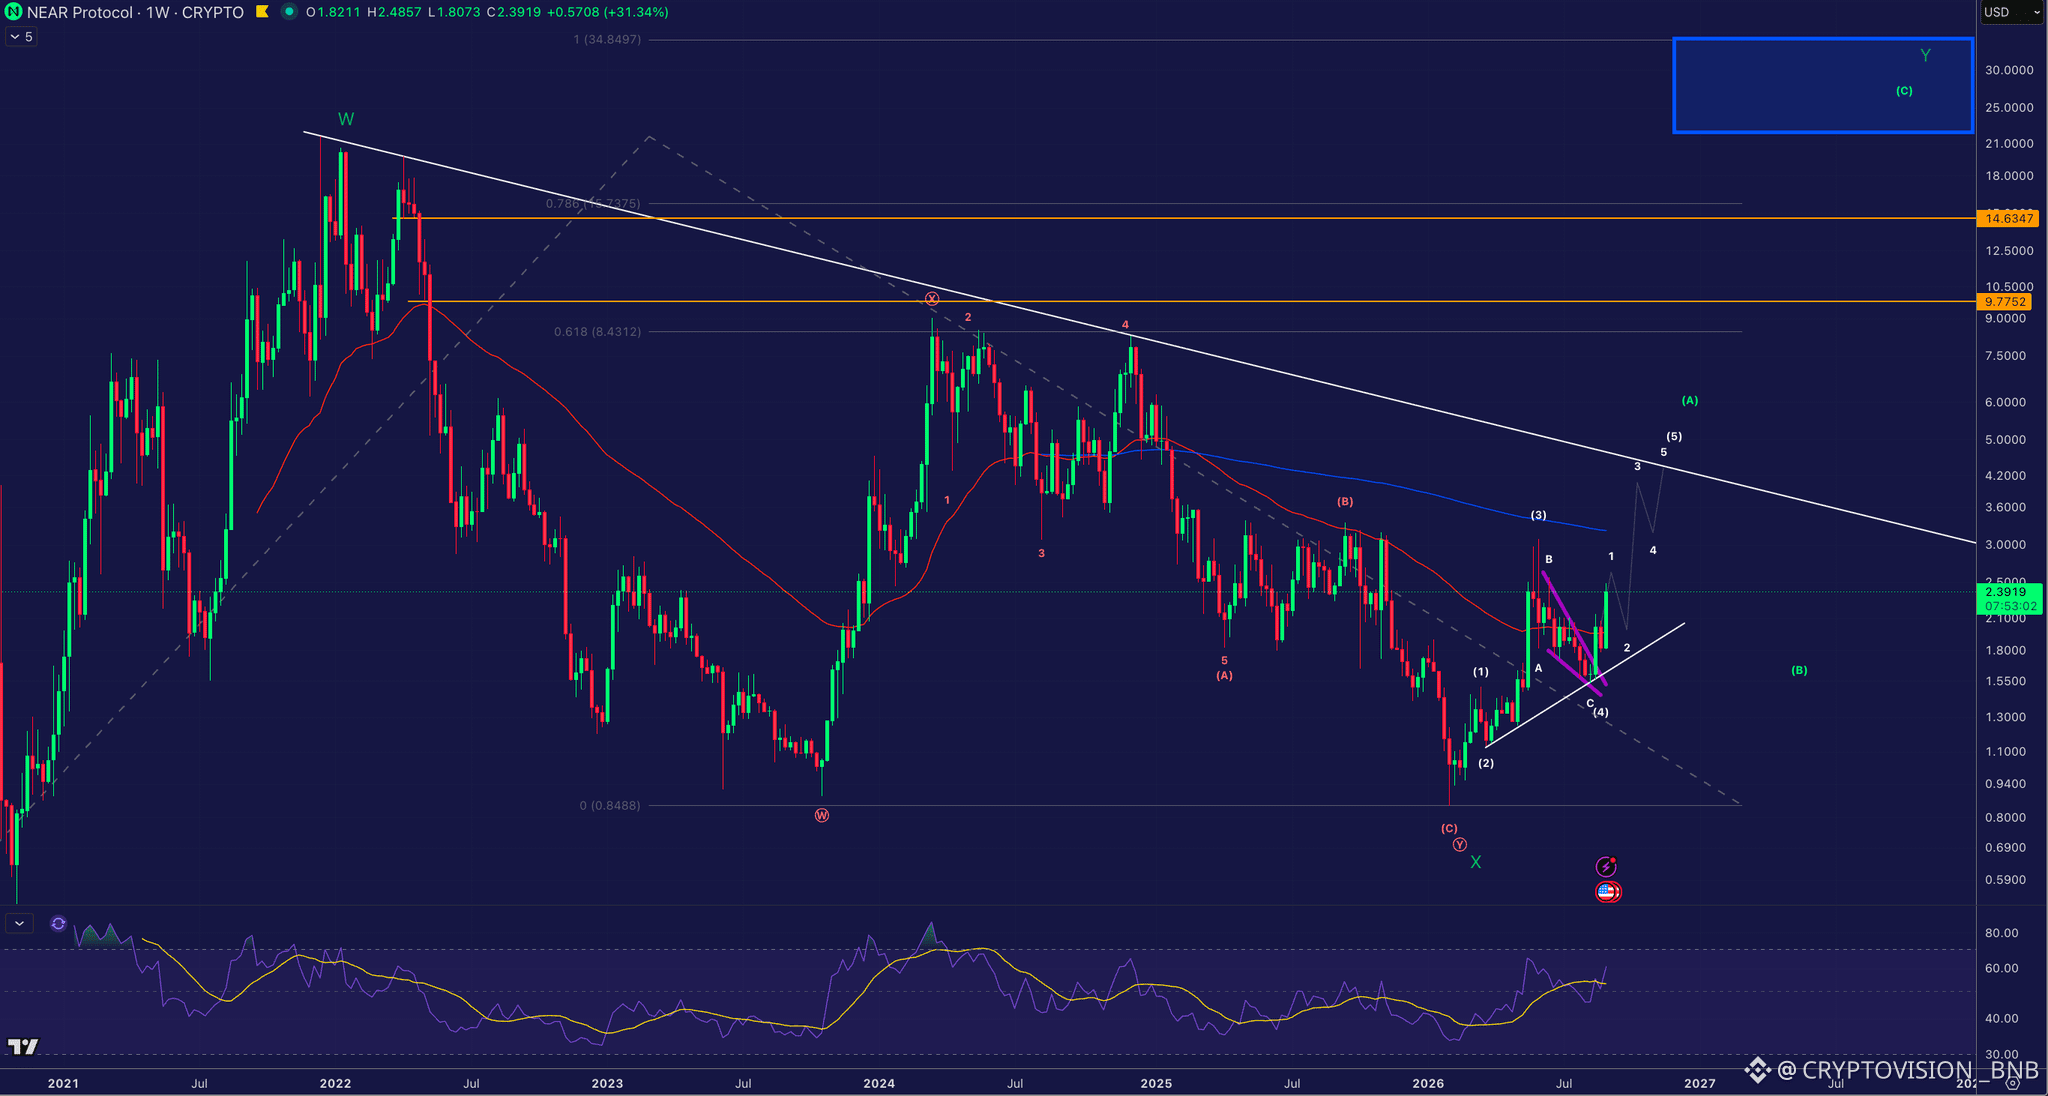
$NEAR es another one (besides HYPE, etc.) that has been on an uptrend over the past 6 months, and it has risen 260% from its current low.
Right now, it is forming Wave 5 of the first 5-wave bullish move: if extended, it will be a larger 5-wave bullish move, as shown in the chart.
Looking back across the entire chart, NEAR Protocol made a 3-wave ABC bullish move in 2021, then a 3-wave corrective move downward that for now bottomed in February 2026.
With the current data on the chart, this is a WXY double-three pattern, in which NEAR would now be in a 5-wave bullish move of Wave A of a macro Wave Y (ABC bullish move).
NEAR has to complete the current 5-wave bullish move to prove that this is the first Wave A of a larger ABC bullish move.
Looking upward, there are two orange FVGs located above that have not yet been filled.
It is good to know that Wave Ys cannot be truncated and have to go beyond Wave W. That would place a minimum Wave Y target from above the ATH to the common 1.0 fib at $34.80.
Do you think NEAR reaches a new ATH in the next bull cycle?
$NEAR
Right now, it is forming Wave 5 of the first 5-wave bullish move: if extended, it will be a larger 5-wave bullish move, as shown in the chart.
Looking back across the entire chart, NEAR Protocol made a 3-wave ABC bullish move in 2021, then a 3-wave corrective move downward that for now bottomed in February 2026.
With the current data on the chart, this is a WXY double-three pattern, in which NEAR would now be in a 5-wave bullish move of Wave A of a macro Wave Y (ABC bullish move).
NEAR has to complete the current 5-wave bullish move to prove that this is the first Wave A of a larger ABC bullish move.
Looking upward, there are two orange FVGs located above that have not yet been filled.
It is good to know that Wave Ys cannot be truncated and have to go beyond Wave W. That would place a minimum Wave Y target from above the ATH to the common 1.0 fib at $34.80.
Do you think NEAR reaches a new ATH in the next bull cycle?
$NEAR
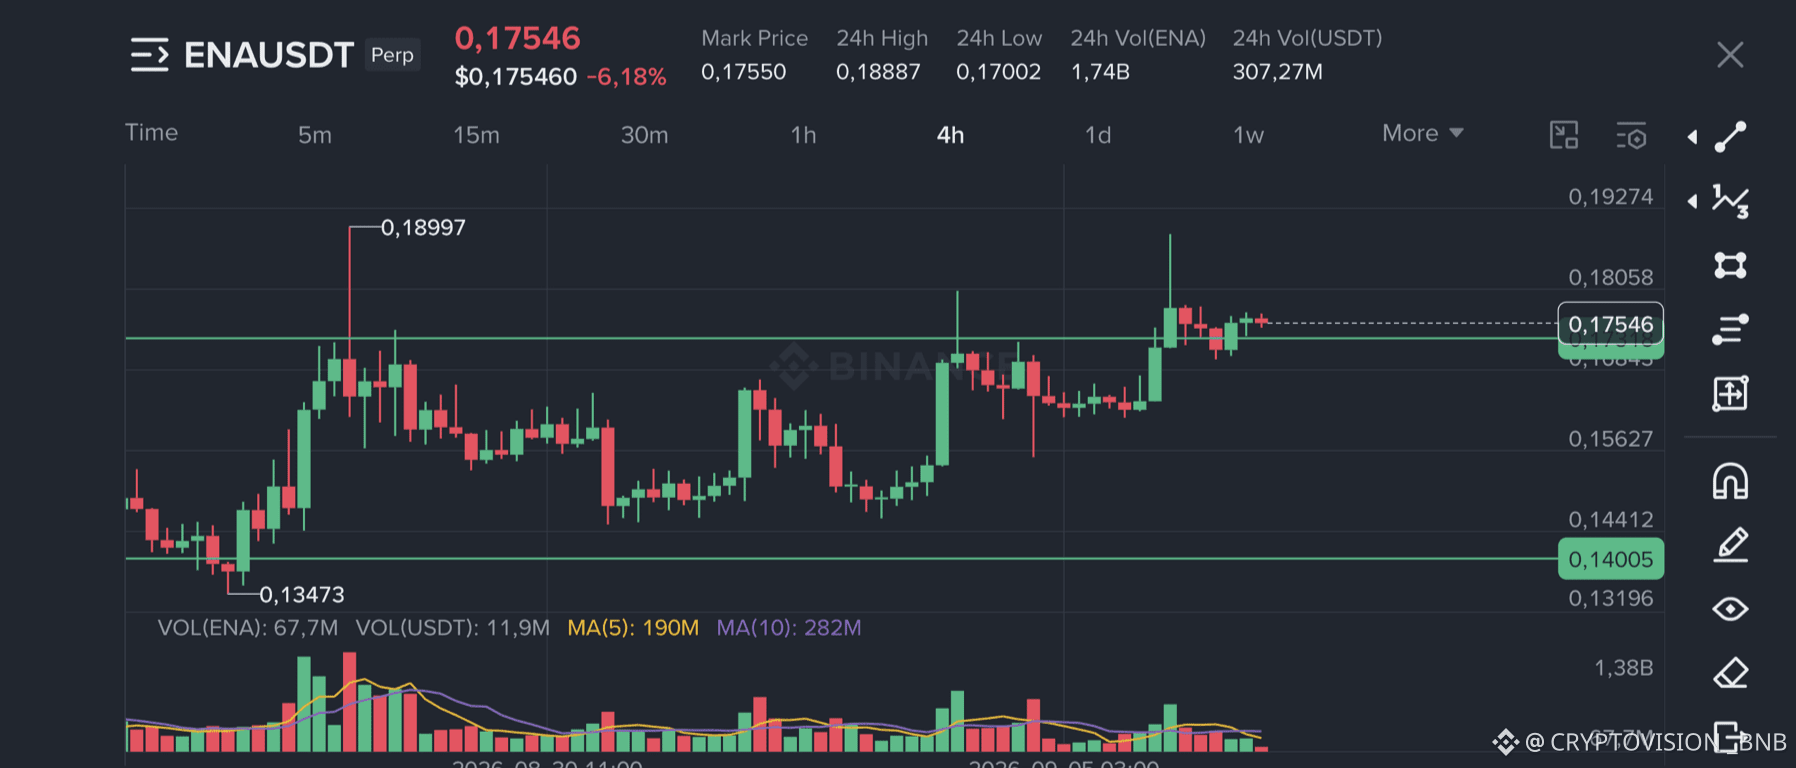
$ENA 🚀 Solid base above $0.17
Entry: $0.17–$0.175
SL: $0.157
TP: $0.18 / $0.19 / $0.20 / $0.22 / $0.25 / $0.30
Bullish setup. If the zone holds, the next move could be interesting.
Long $ENA 👇
Entry: $0.17–$0.175
SL: $0.157
TP: $0.18 / $0.19 / $0.20 / $0.22 / $0.25 / $0.30
Bullish setup. If the zone holds, the next move could be interesting.
Long $ENA 👇
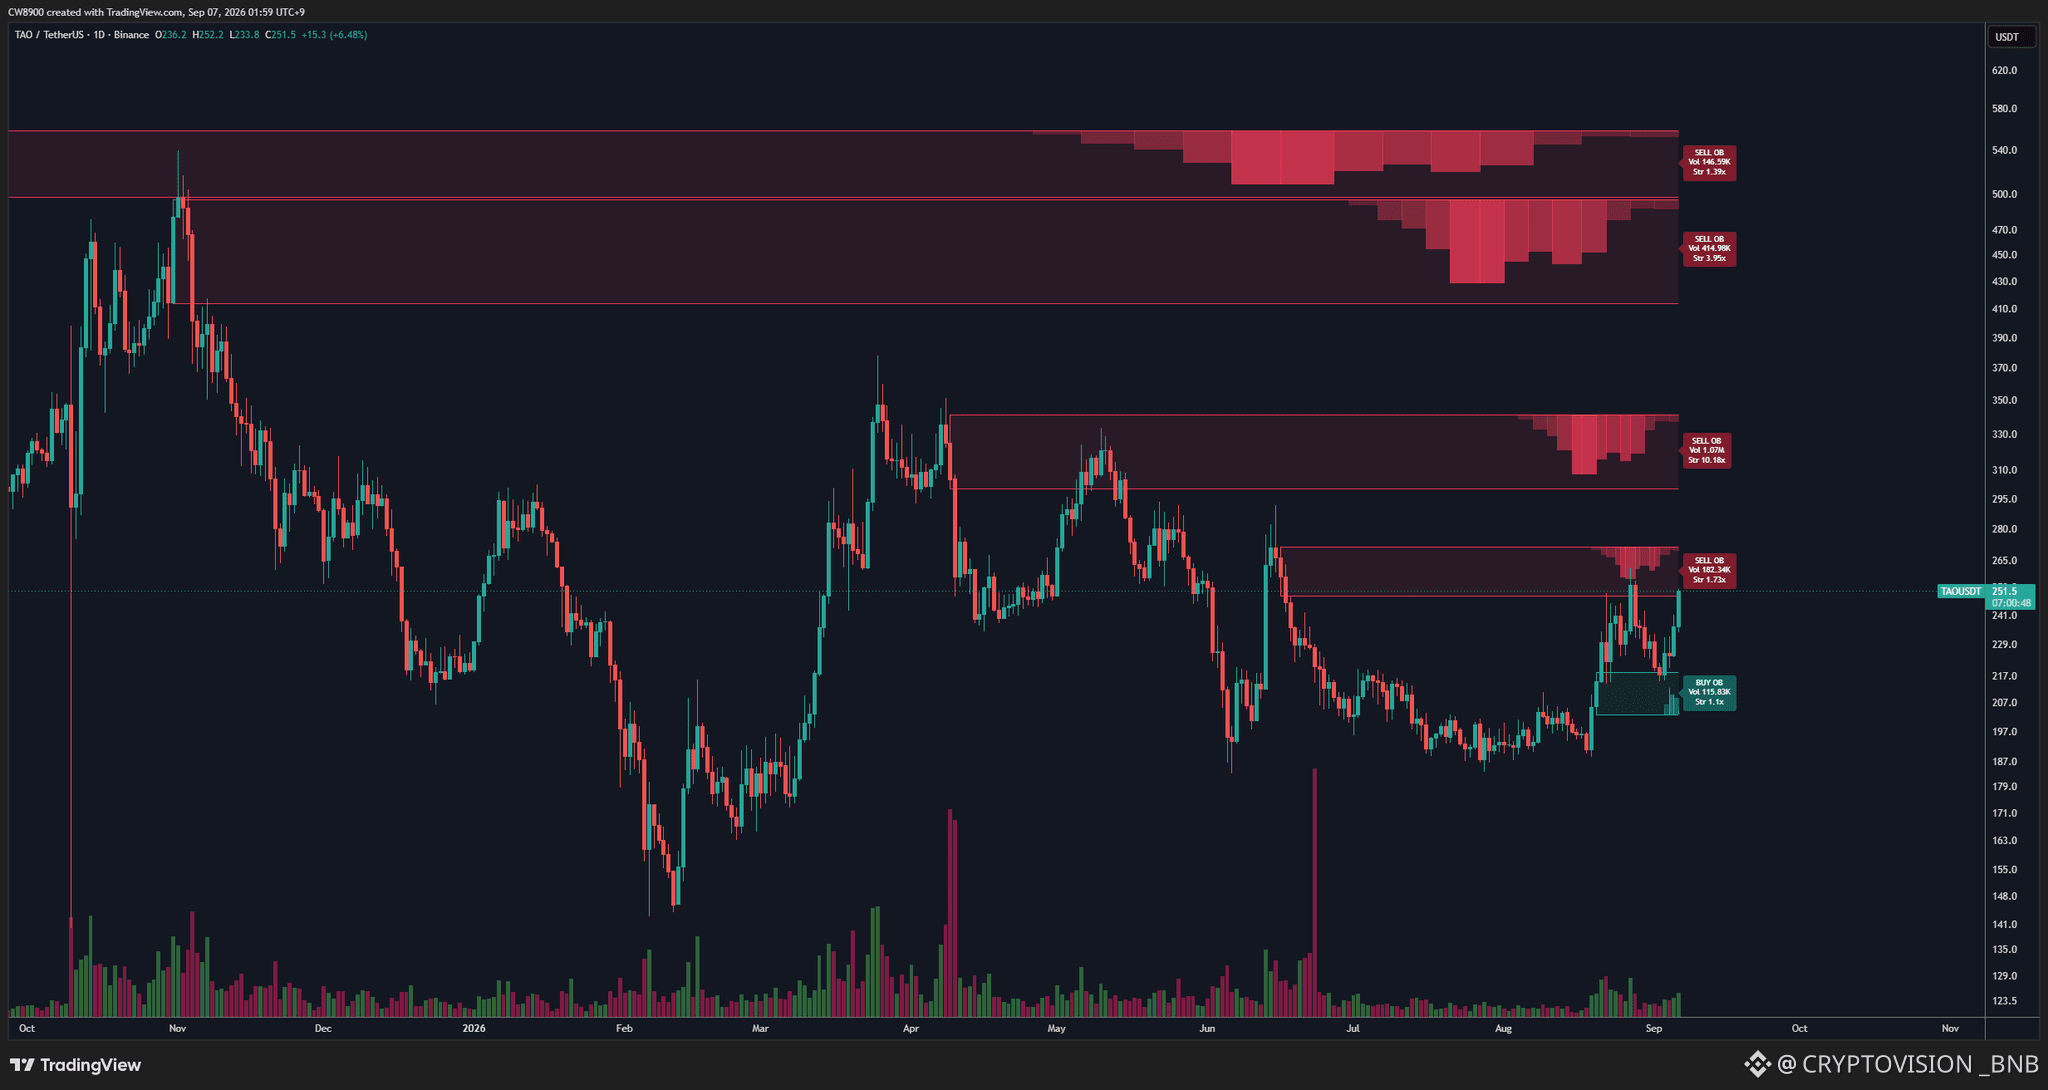
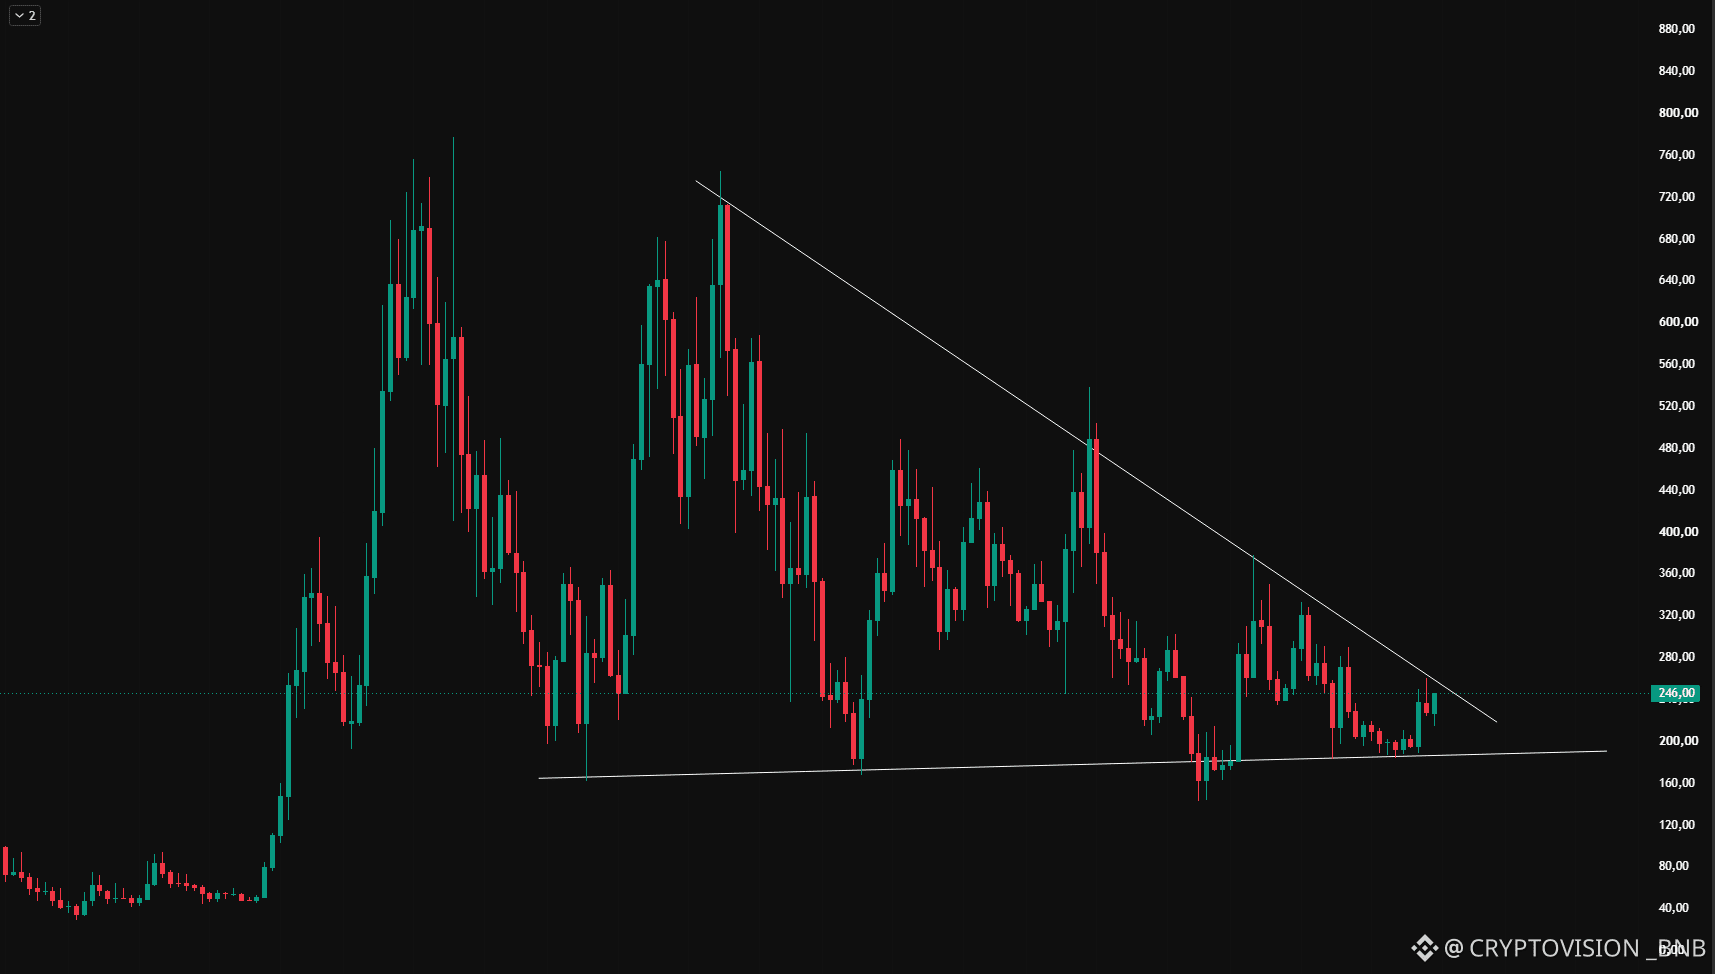
$TAO has reached a sell wall.
The current sell wall is forming up to $271.
If this sell wall breaks, the rise will continue to $300.
$TAO
The current sell wall is forming up to $271.
If this sell wall breaks, the rise will continue to $300.
$TAO
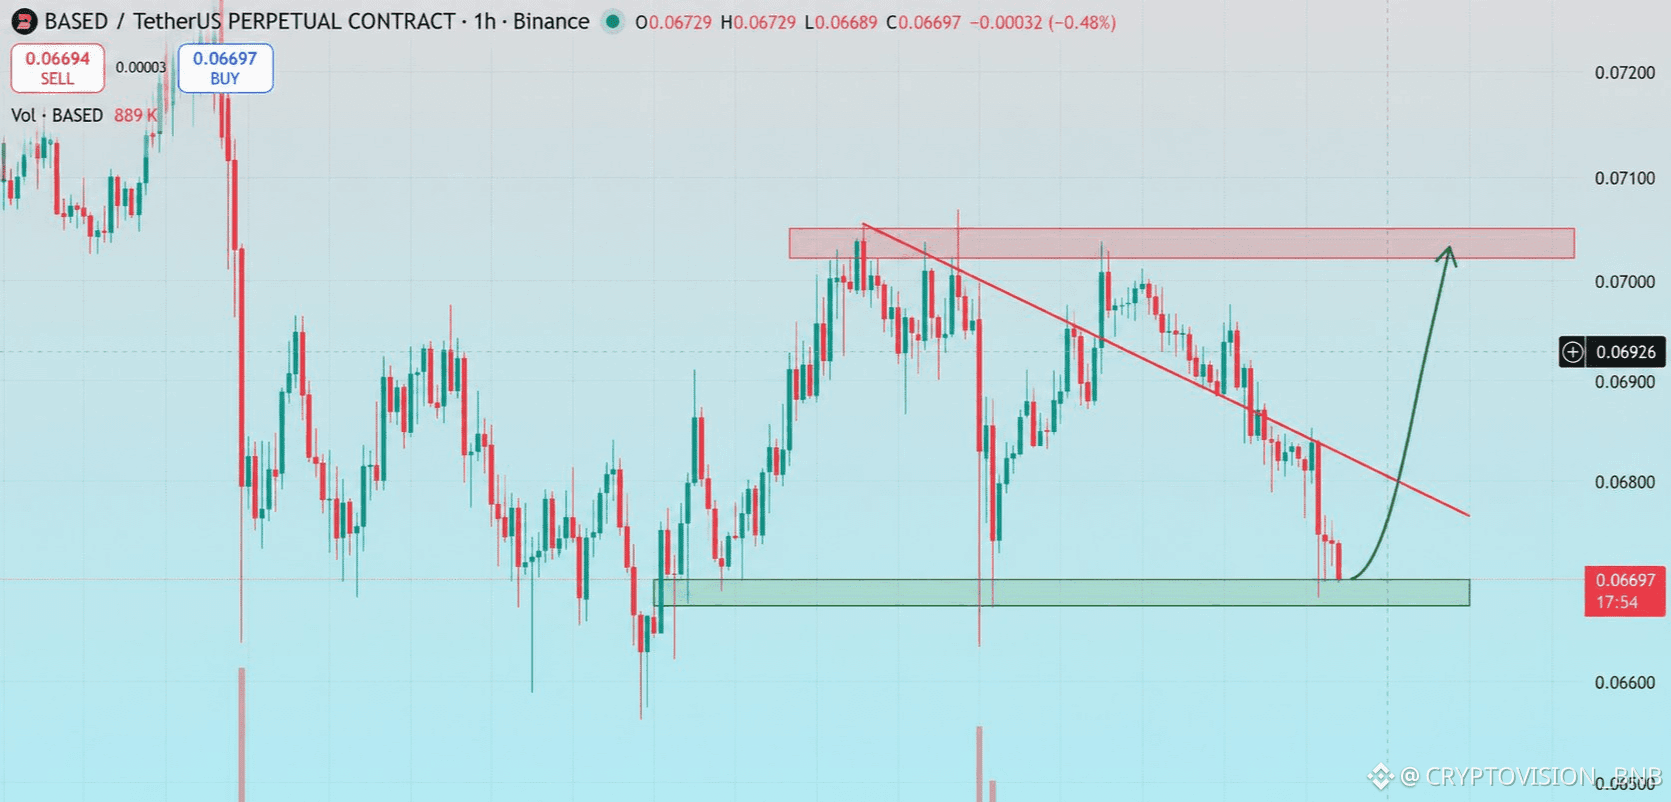
$BASED 👀 Key support
$0.0665–$0.067 is the zone to watch. If it holds and the trend recovers, it could target $0.070–$0.0705.
Slightly bullish bias.
Long $BASED 👇
$0.0665–$0.067 is the zone to watch. If it holds and the trend recovers, it could target $0.070–$0.0705.
Slightly bullish bias.
Long $BASED 👇
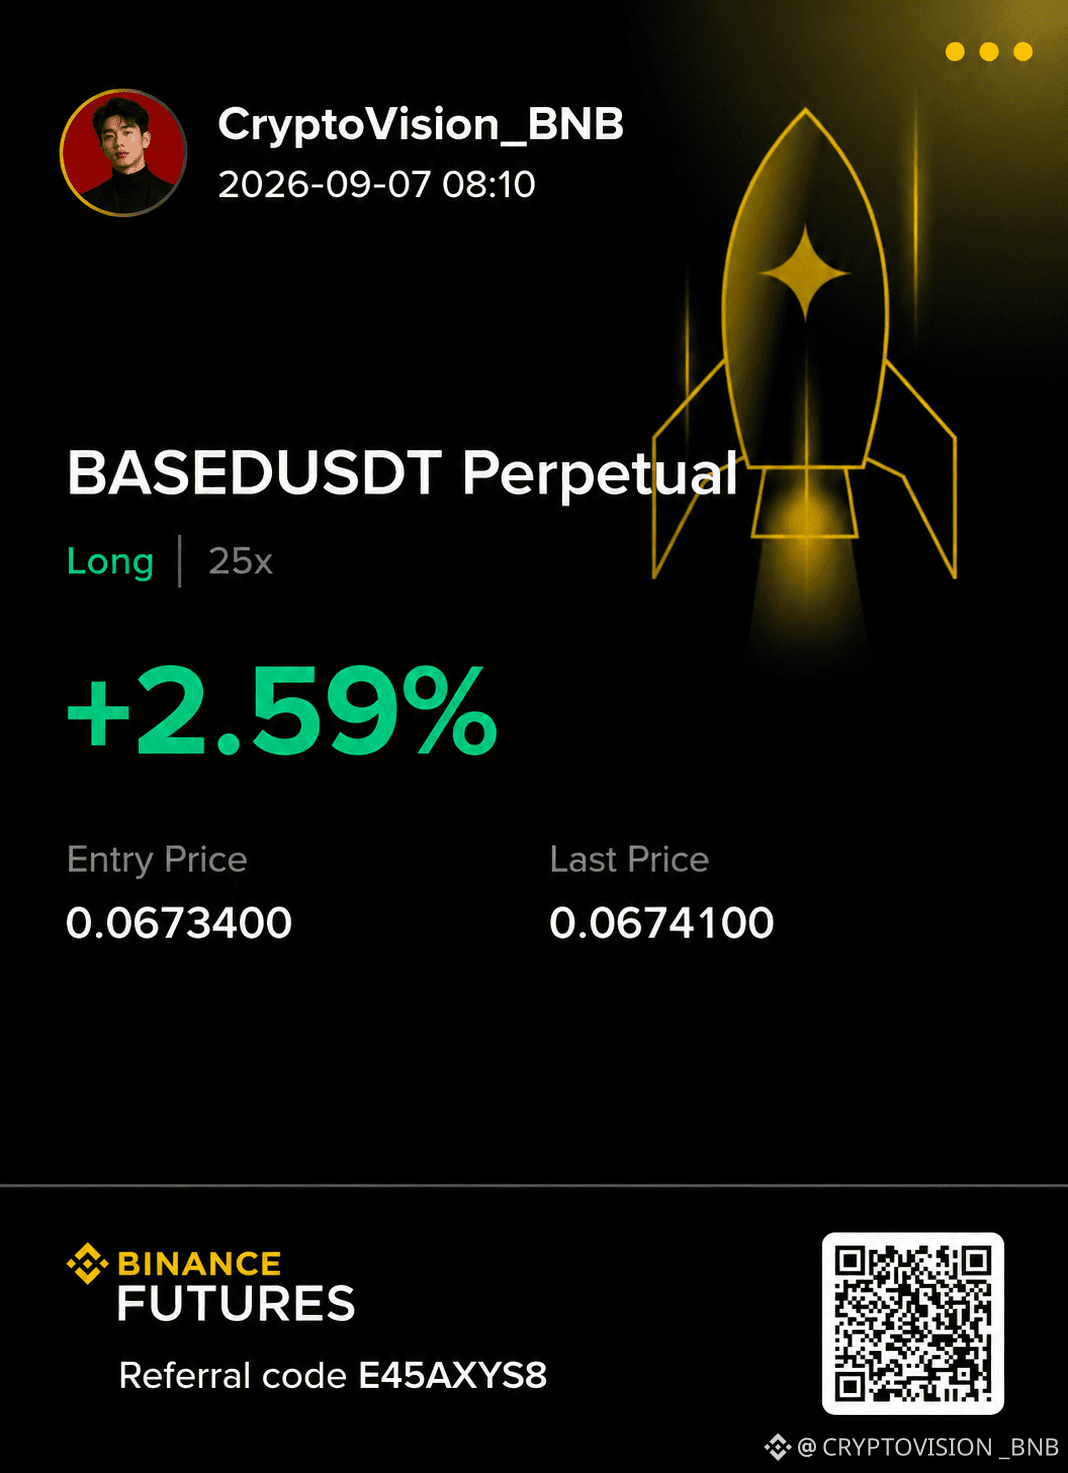
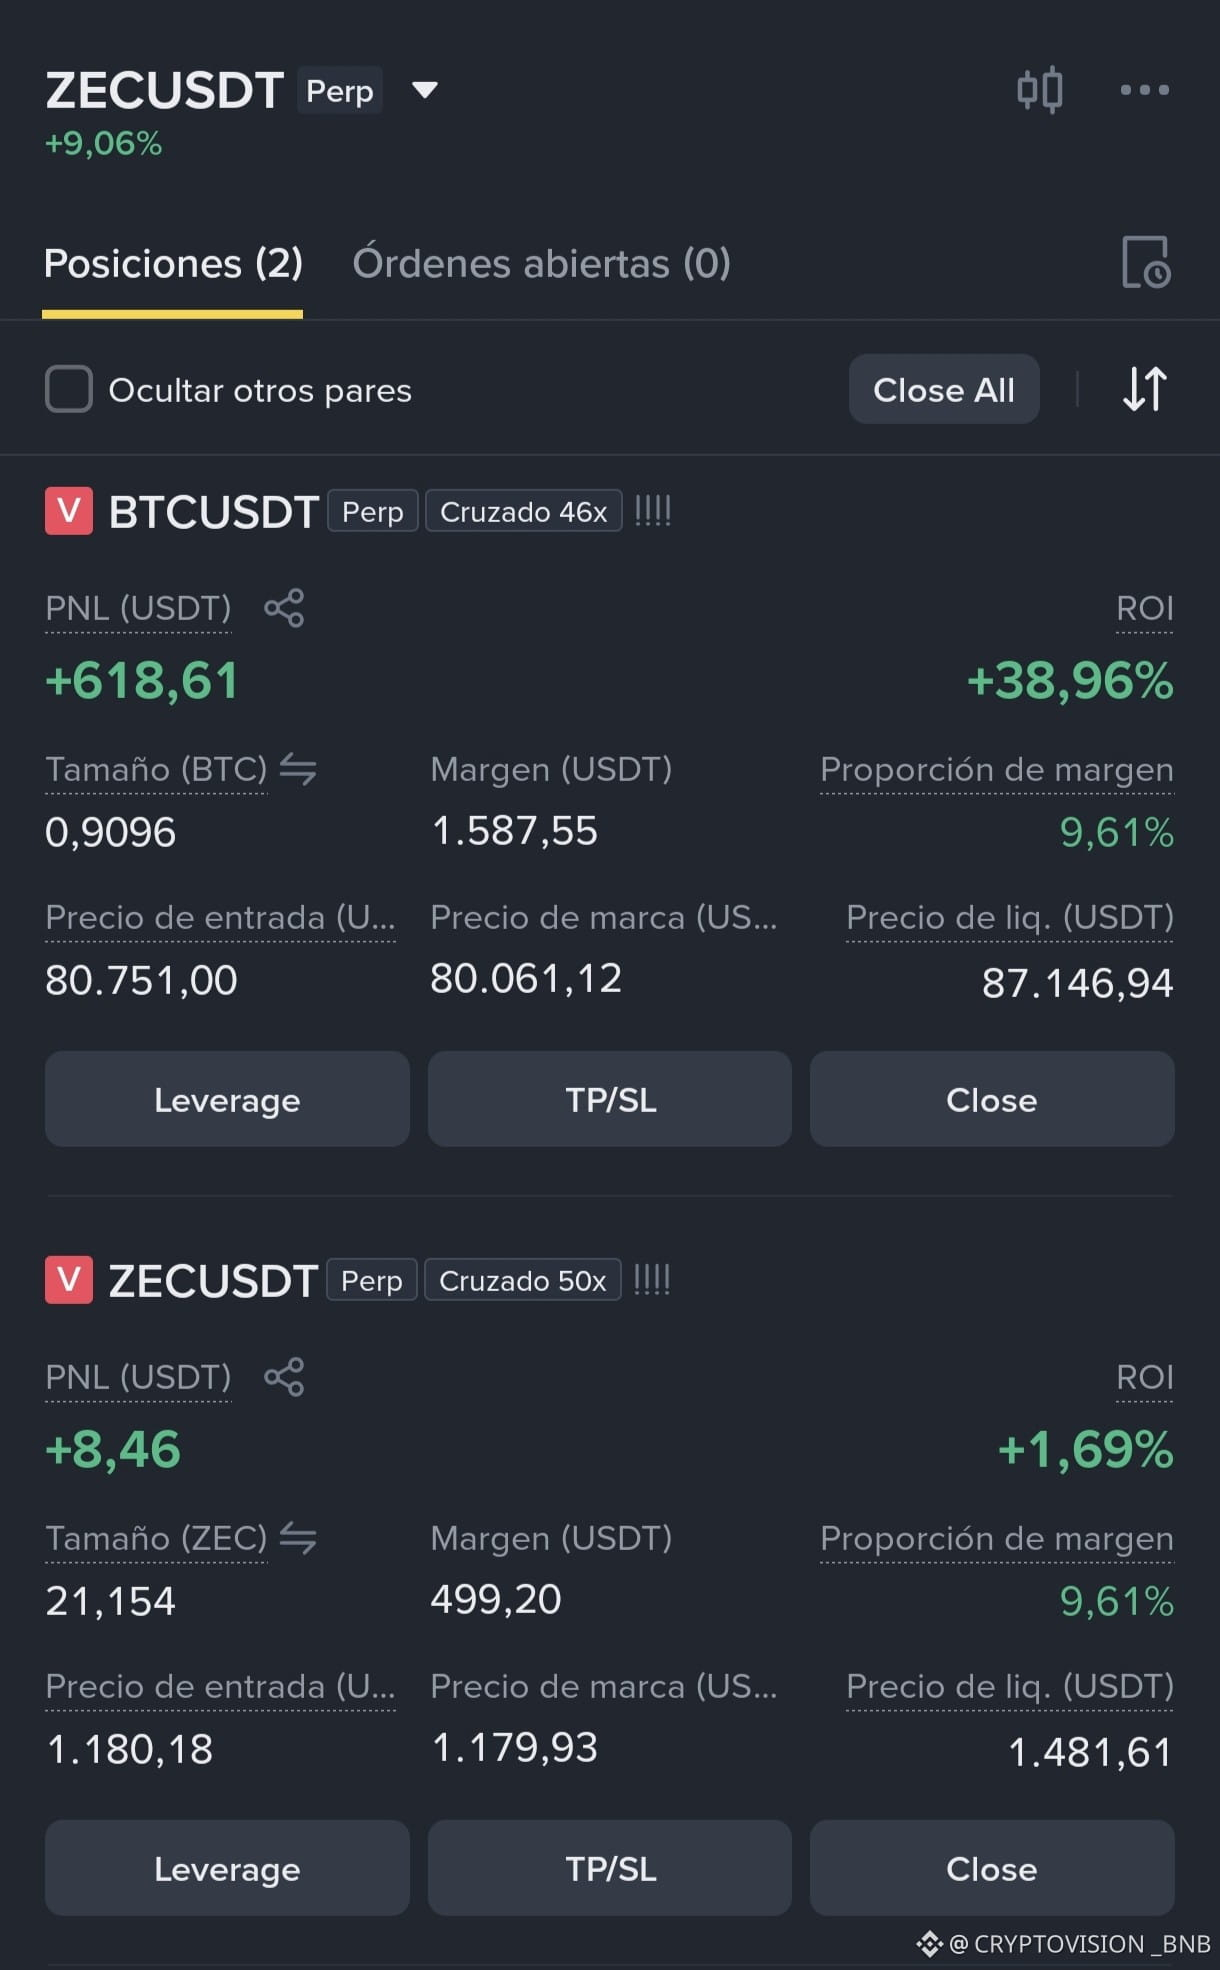
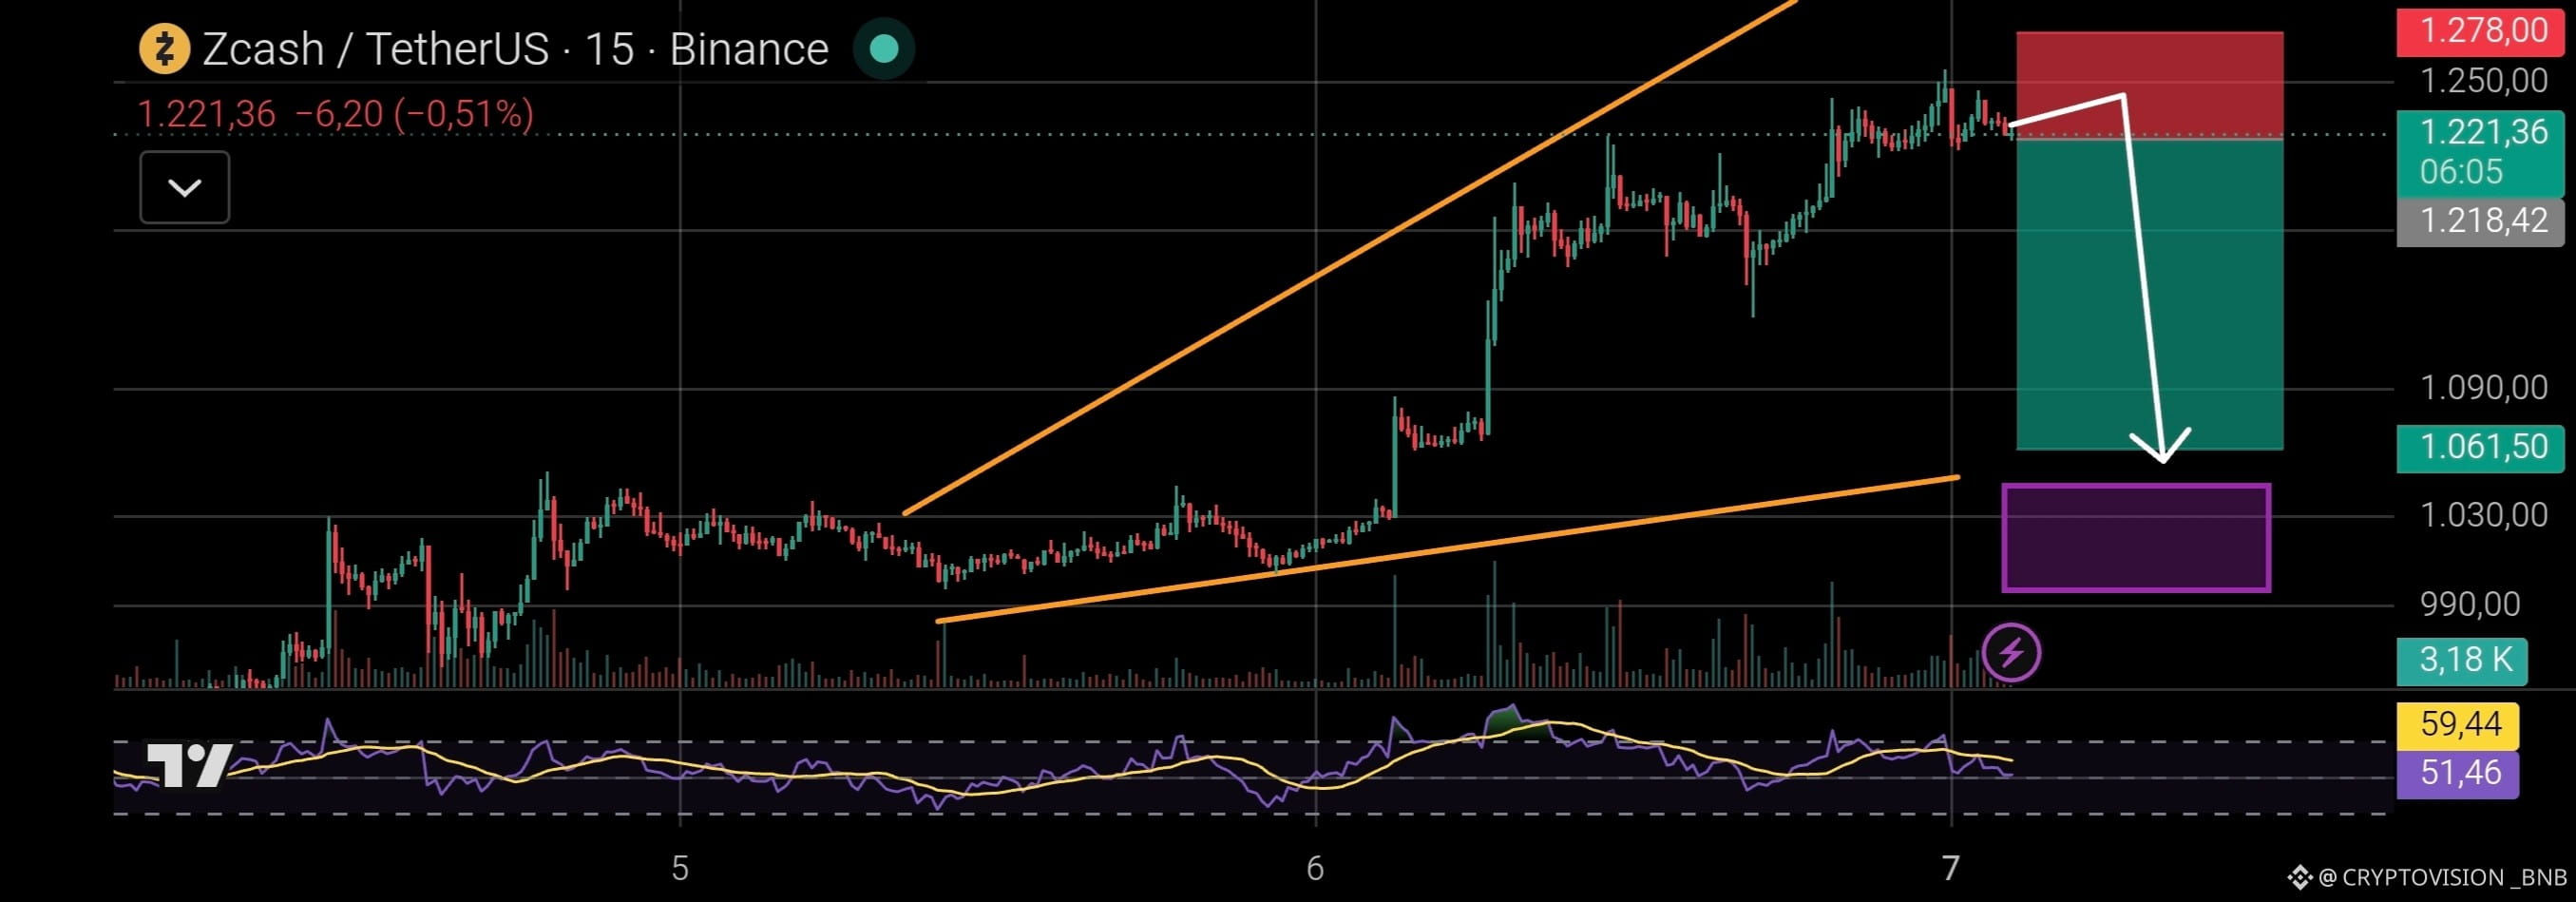
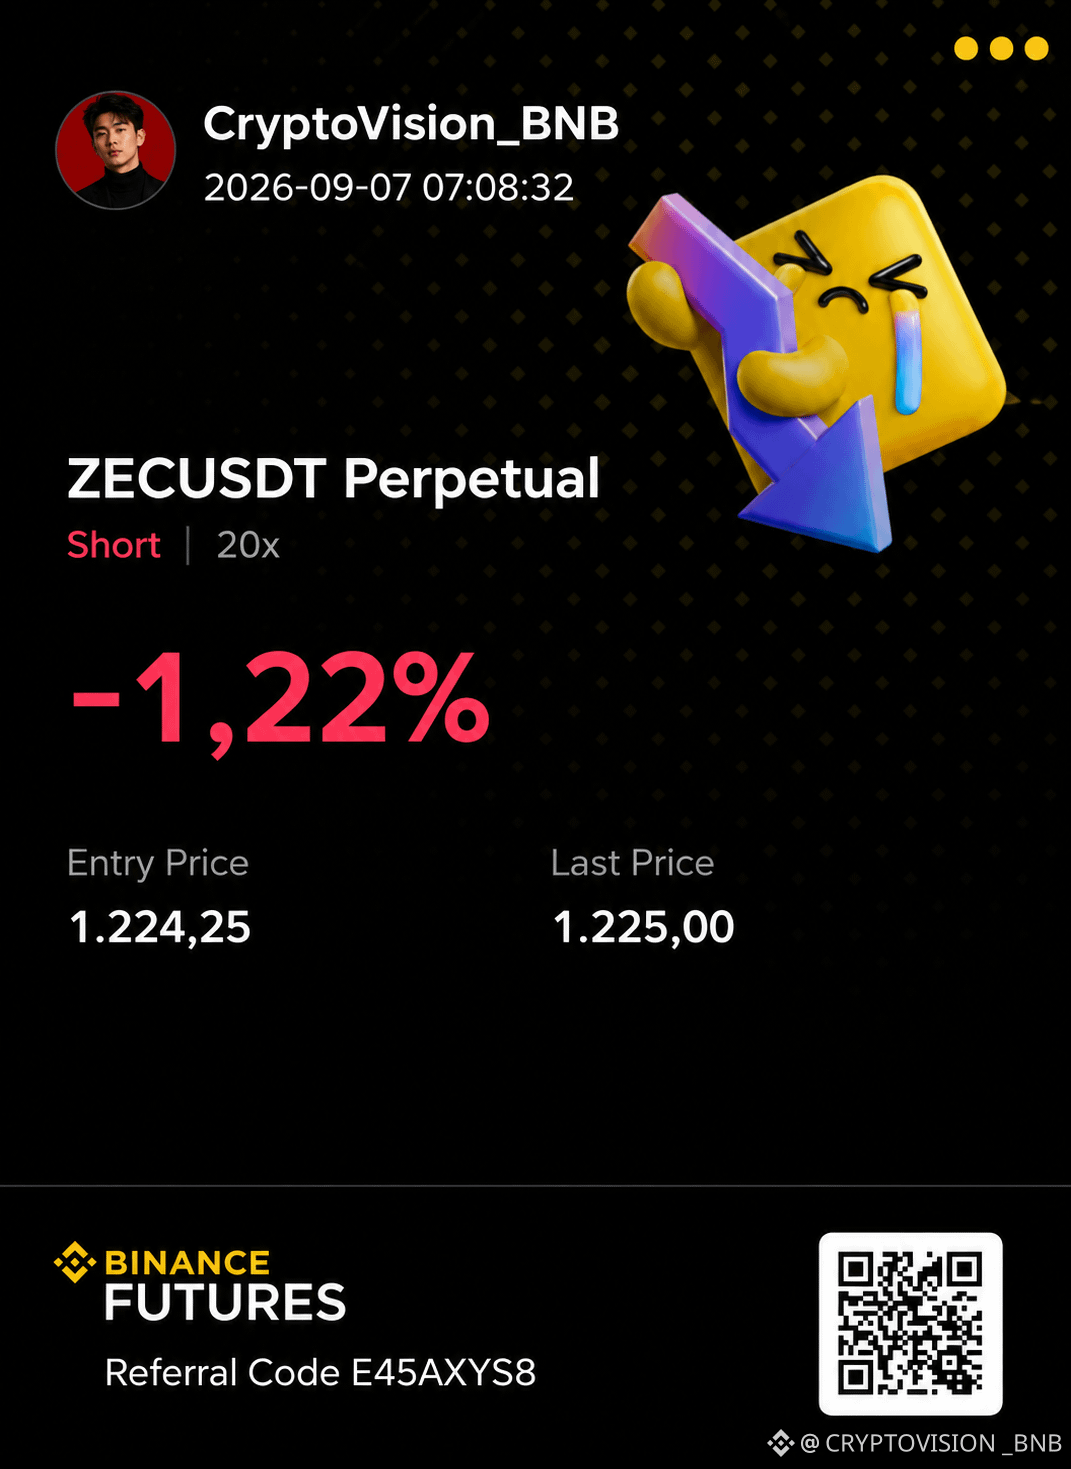
$BTC $ZEC 🤑
I have taken partial profits on both positions.
The rest remains open: reduced risk and letting the gains run.
New signal soon. Stay tuned.
$BTC
I have taken partial profits on both positions.
The rest remains open: reduced risk and letting the gains run.
New signal soon. Stay tuned.
$BTC
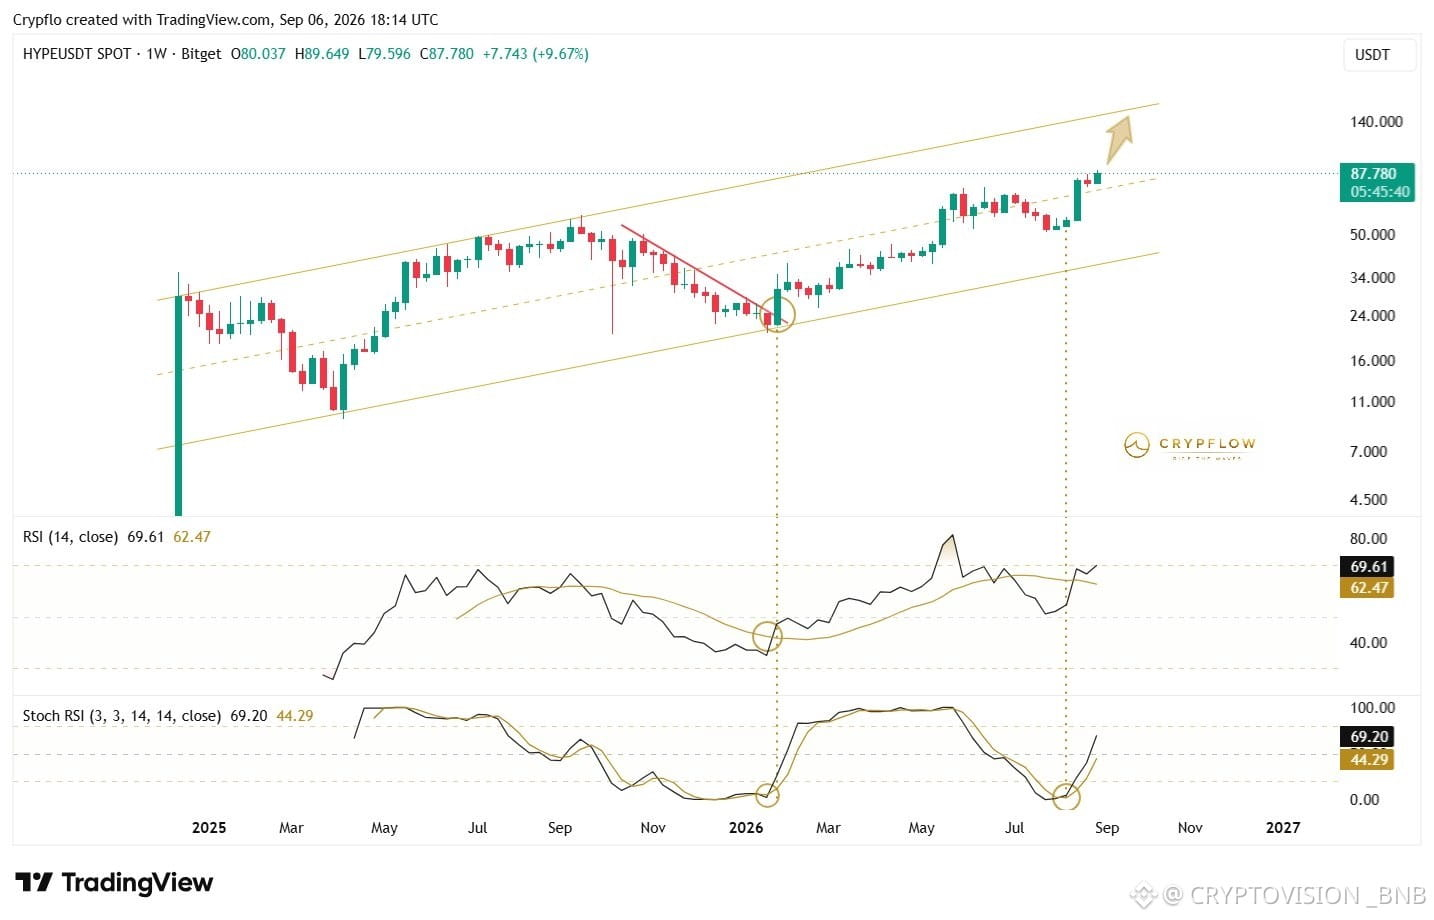
$HYPE (1W) – One of the cleanest charts in the cryptocurrency world.
HYPE continues to respect this ascending channel flawlessly.
→ RSI has reclaimed its MA
→ Weekly Stoch RSI has crossed to the upside
→ Price is moving toward price discovery
As long as this structure holds, the next main target is clear.
$150–$160.
That would take HYPE back to the top of its channel.
Sometimes you don’t need to overcomplicate a chart.
Just follow the trend.
$HYPE
HYPE continues to respect this ascending channel flawlessly.
→ RSI has reclaimed its MA
→ Weekly Stoch RSI has crossed to the upside
→ Price is moving toward price discovery
As long as this structure holds, the next main target is clear.
$150–$160.
That would take HYPE back to the top of its channel.
Sometimes you don’t need to overcomplicate a chart.
Just follow the trend.
$HYPE
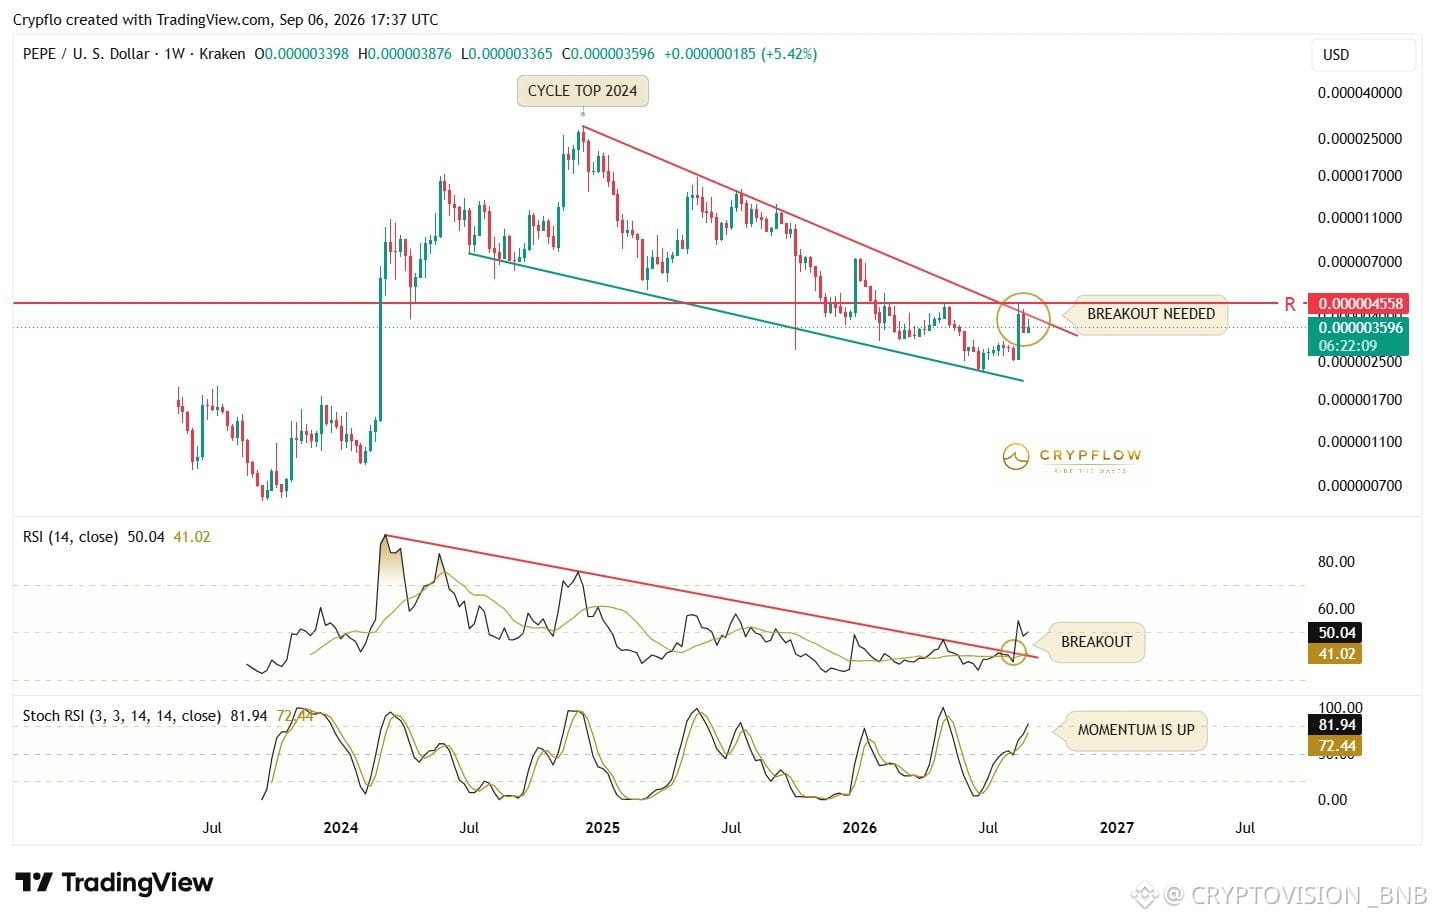
$PEPE (1W) – Momentum has broken, but price has not yet.
PEPE is approaching an important breakout.
The weekly RSI has already broken its downtrend and reclaimed its MA.
The Stoch RSI is entering the high-momentum zone.
But price has not confirmed it yet.
It is now running into the downtrend from the 2024 cycle high and is being held back.
Two things I would want to see for confirmation:
→ Break the price downtrend
→ Reclaim the key weekly resistance
Momentum is ready. Now price needs to follow.
$PEPE
PEPE is approaching an important breakout.
The weekly RSI has already broken its downtrend and reclaimed its MA.
The Stoch RSI is entering the high-momentum zone.
But price has not confirmed it yet.
It is now running into the downtrend from the 2024 cycle high and is being held back.
Two things I would want to see for confirmation:
→ Break the price downtrend
→ Reclaim the key weekly resistance
Momentum is ready. Now price needs to follow.
$PEPE

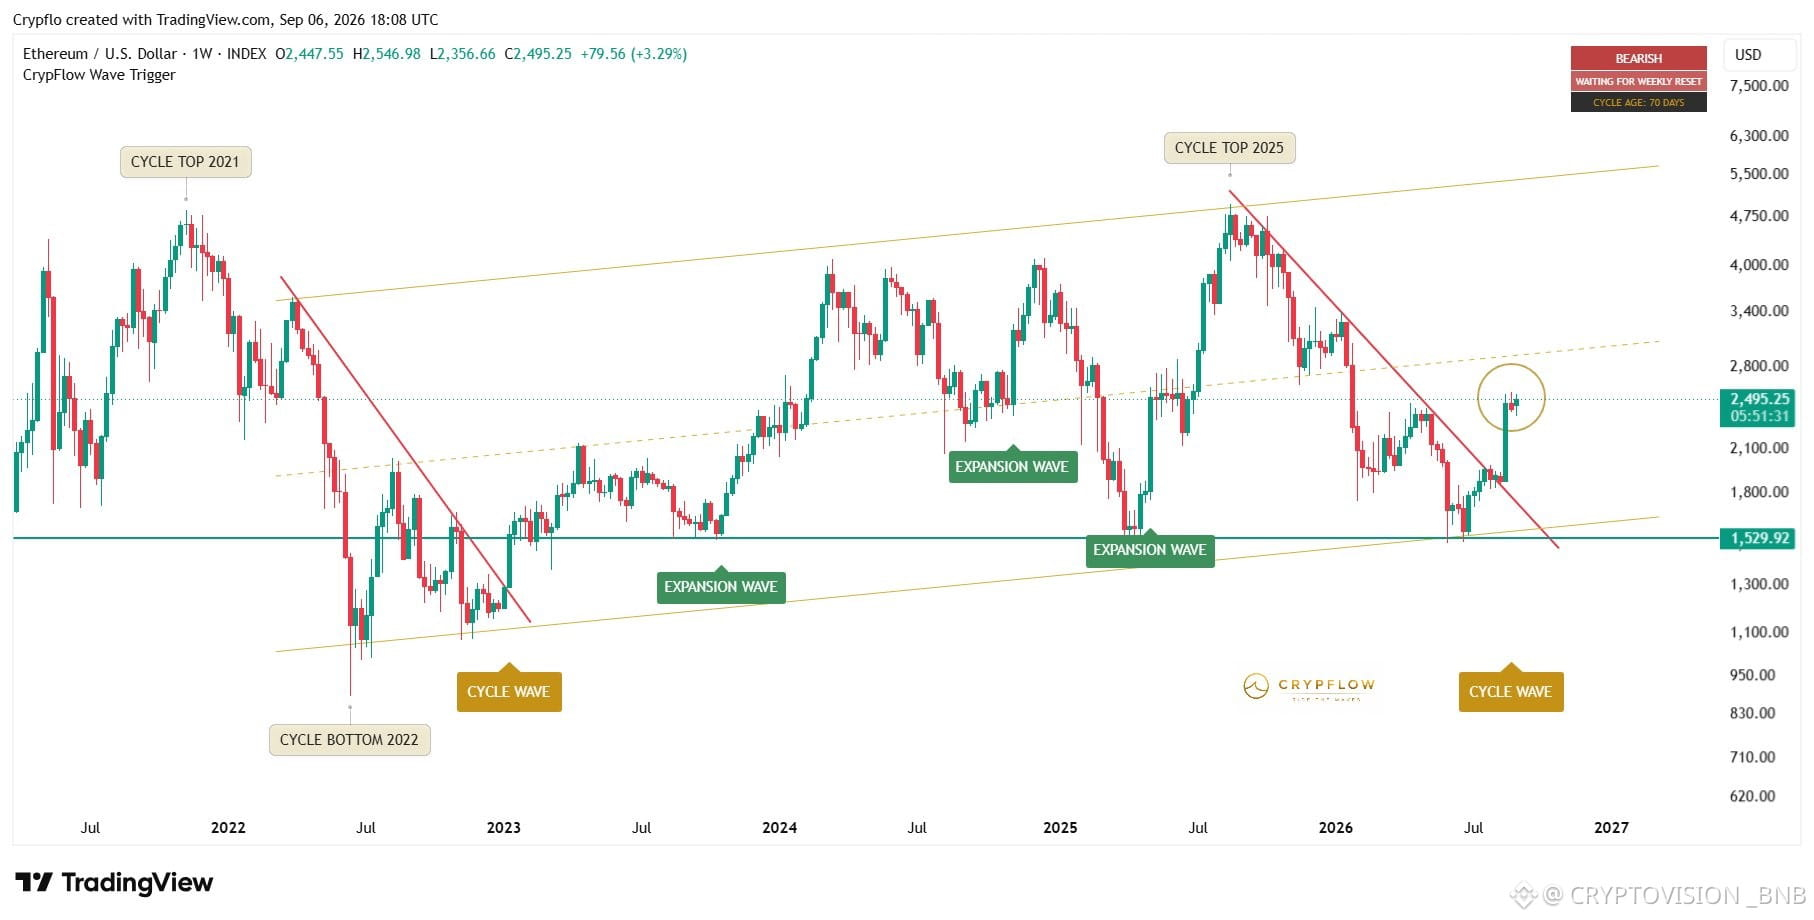
$ETH (1W) – The Cycle Wave has just been activated. 👀
The CrypFlow Wave Indicator has just recorded a Cycle Wave in Ethereum.
The last one appeared near the bottom of the 2022 cycle.
Since then, every wave activation signal has been an Expansion Wave.
Until now.
The Cycle Wave has returned.
And it was activated just after ETH bounced from the bottom of its multi-year channel and broke its bearish price trend.
Now we are waiting for the weekly reset to confirm the next expansion.
A new cycle wave is forming.
$ETH
The CrypFlow Wave Indicator has just recorded a Cycle Wave in Ethereum.
The last one appeared near the bottom of the 2022 cycle.
Since then, every wave activation signal has been an Expansion Wave.
Until now.
The Cycle Wave has returned.
And it was activated just after ETH bounced from the bottom of its multi-year channel and broke its bearish price trend.
Now we are waiting for the weekly reset to confirm the next expansion.
A new cycle wave is forming.
$ETH
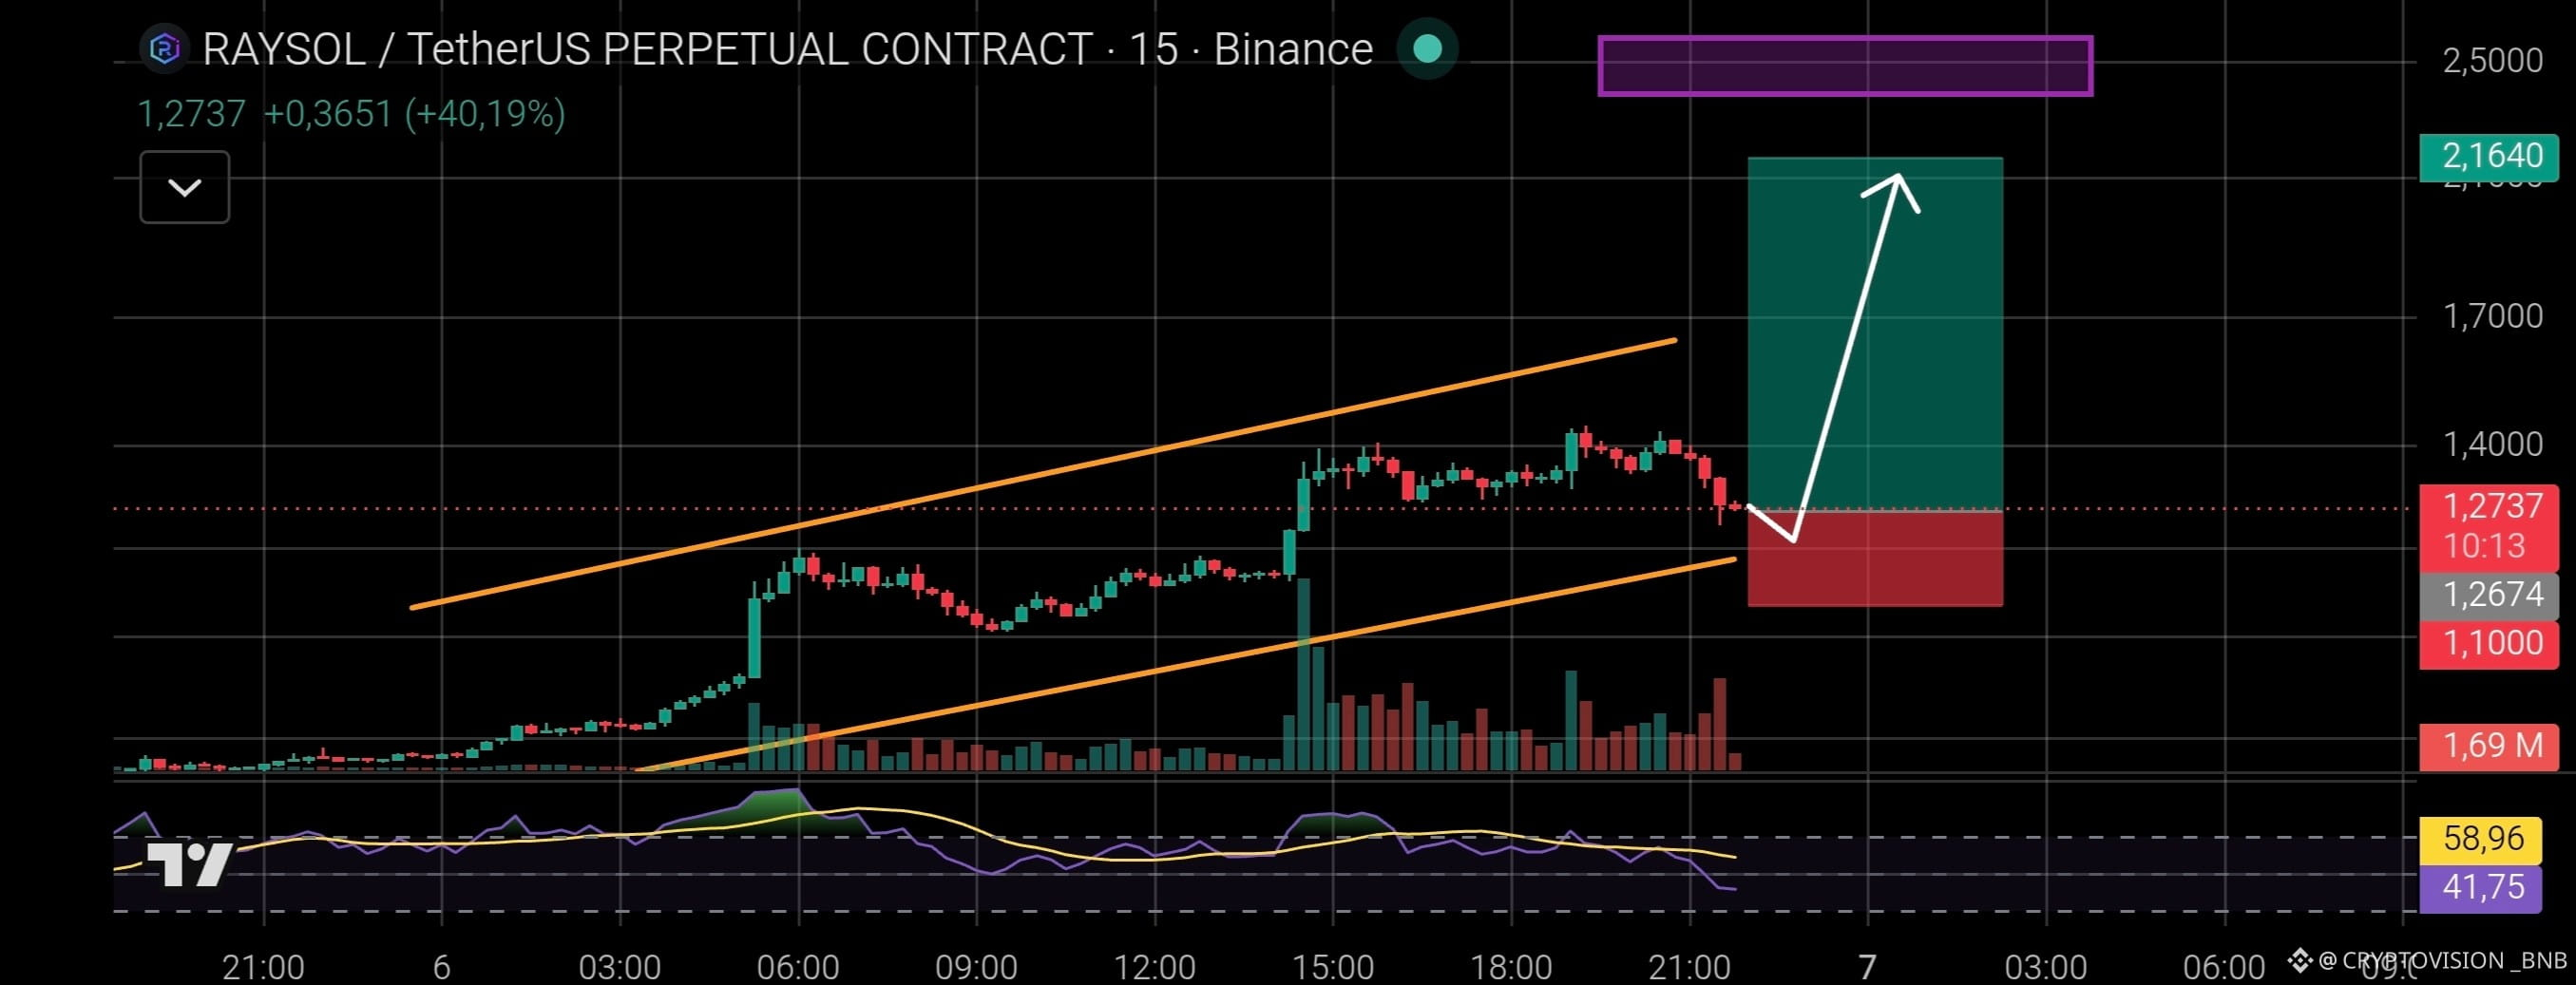
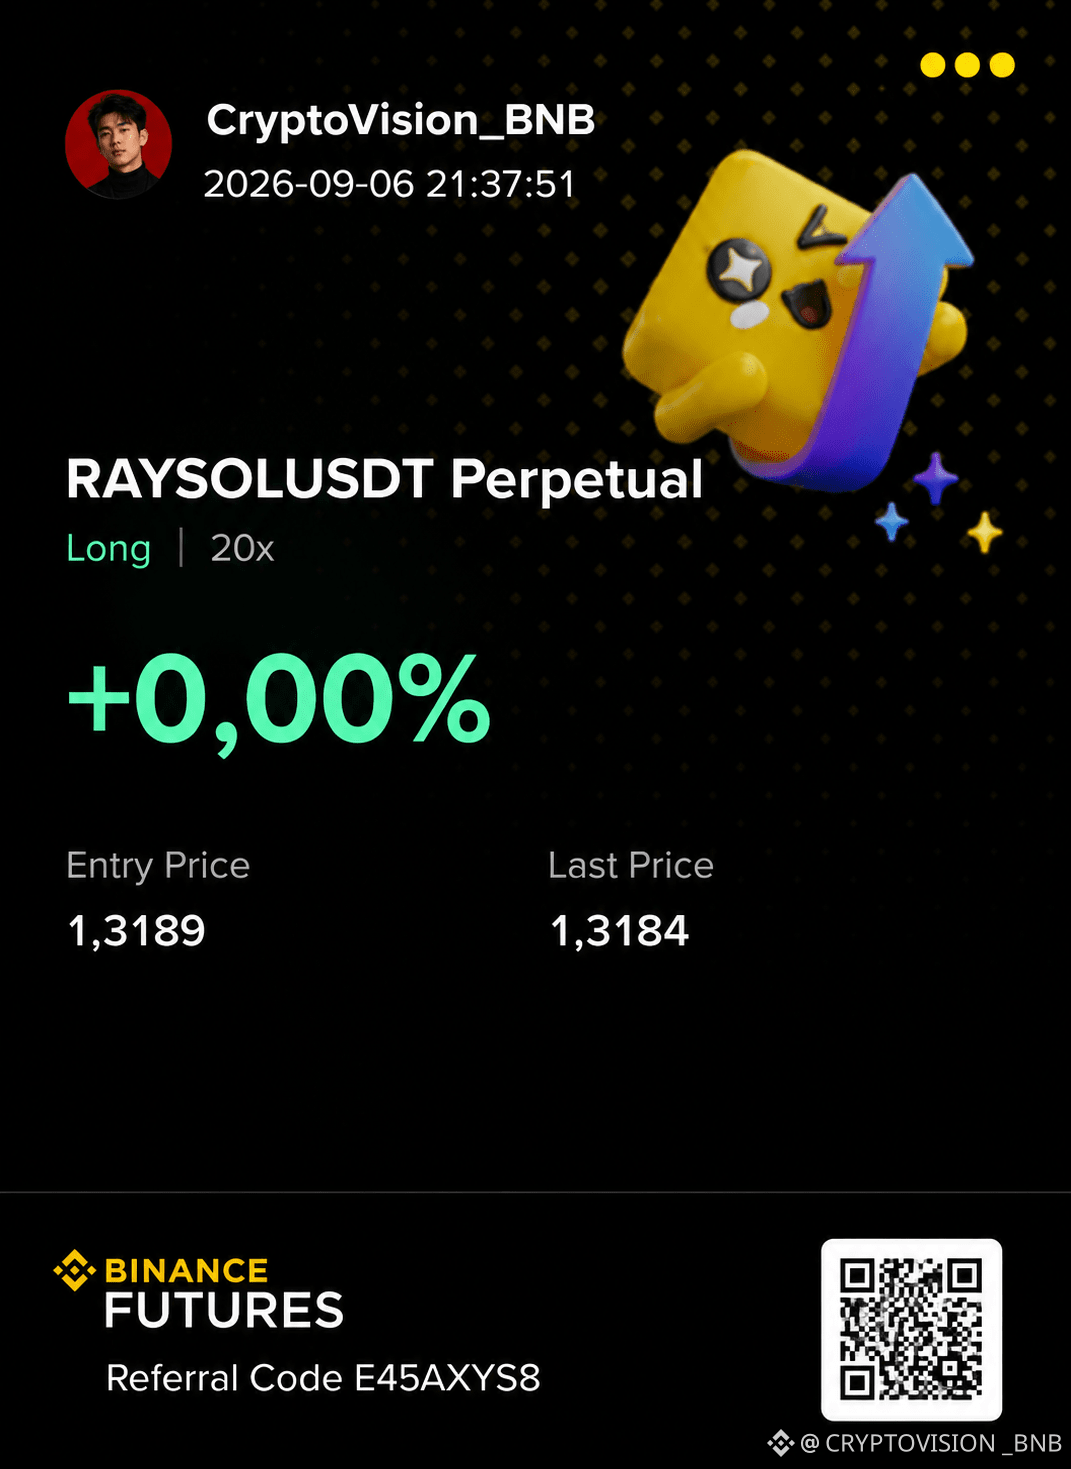
$RAYSOL 👀 Something doesn't add up
Large sell walls, but the price still shows strength. It could be a trap for sellers.
SL: $1.10
TP: $1.60
Long $RAYSOL 👇
Large sell walls, but the price still shows strength. It could be a trap for sellers.
SL: $1.10
TP: $1.60
Long $RAYSOL 👇
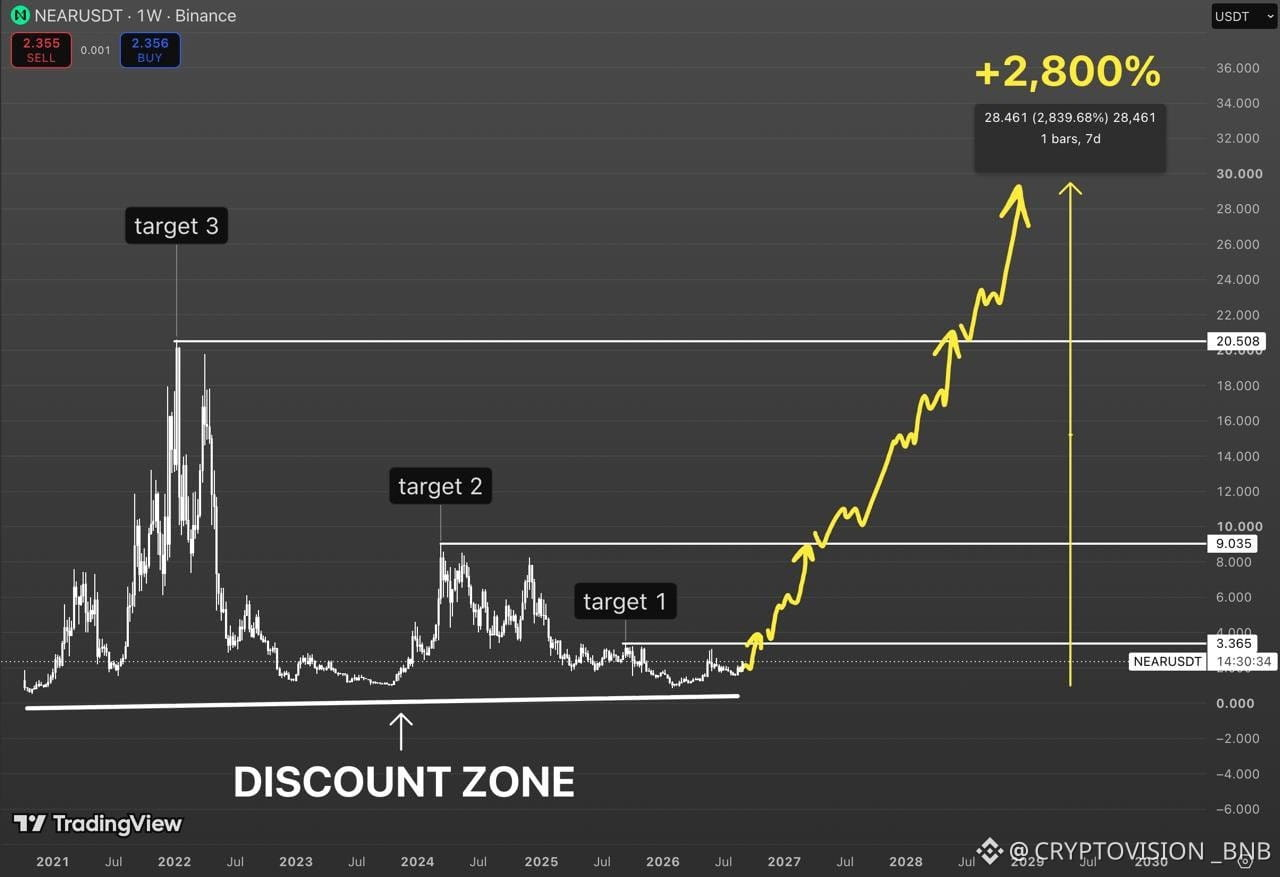
$NEAR a $2.35 looks almost absurd when you zoom out.
This thing traded above $20 before.
Now it has spent years compressing near the bottom
and somehow people need a breakout to get interested again.
Not me.
The roadmap I’m following is $3.36 → $9 → $20.50.
And if $NEAR really enters another full expansion cycle
I think $28–30 is completely on the table.
That’s roughly +2,800% from the bottom.
The market has a funny habit:
it gives you years to buy something cheap…
then makes you feel like you had no time at all.
$NEAR
This thing traded above $20 before.
Now it has spent years compressing near the bottom
and somehow people need a breakout to get interested again.
Not me.
The roadmap I’m following is $3.36 → $9 → $20.50.
And if $NEAR really enters another full expansion cycle
I think $28–30 is completely on the table.
That’s roughly +2,800% from the bottom.
The market has a funny habit:
it gives you years to buy something cheap…
then makes you feel like you had no time at all.
$NEAR
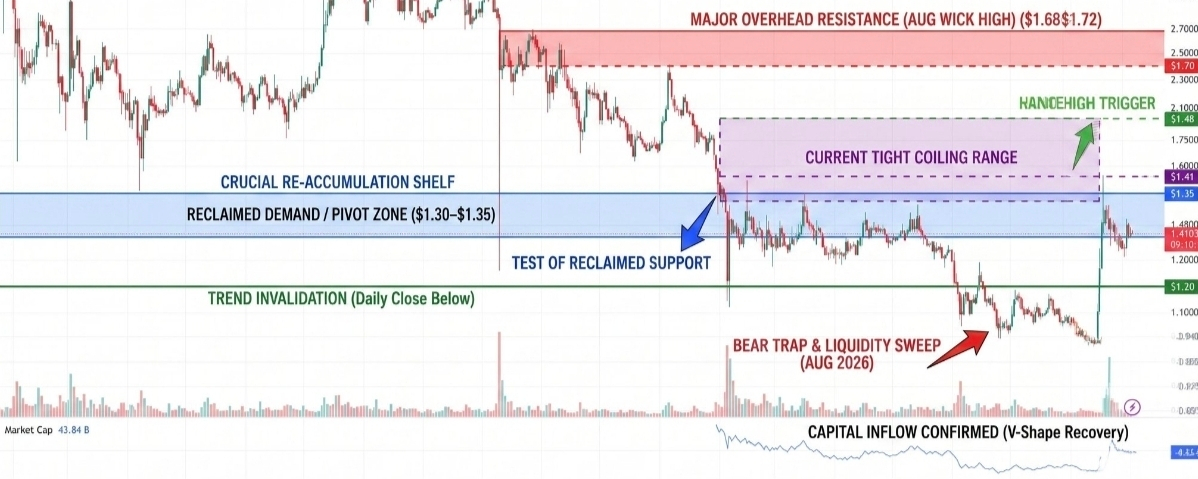
$TAO
I accumulated all of this in 2025, I warned you about those purchases.
In time you will see why I did it ✍️🧙♂️
$TAO
I accumulated all of this in 2025, I warned you about those purchases.
In time you will see why I did it ✍️🧙♂️
$TAO
$ETH
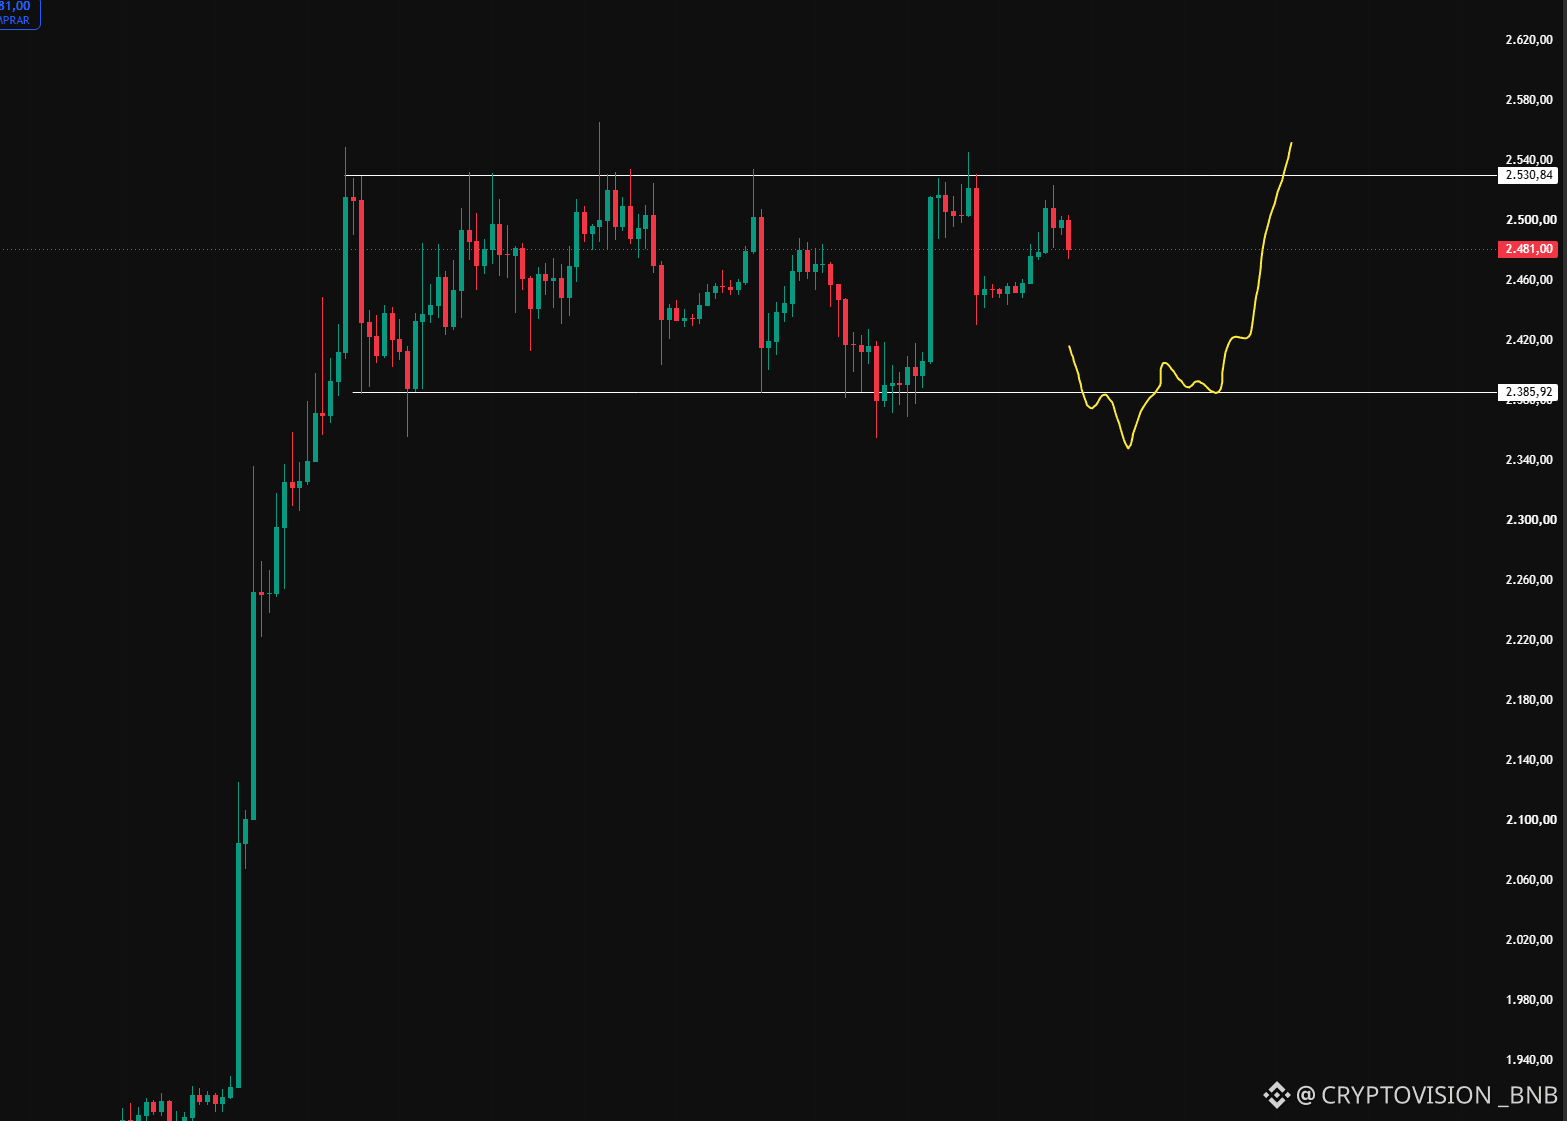
My only chance is in the lower part of the lateral range 🫡
Zone between $2,350 - $2,385
As long as it deviates, recover the lateral range and close candles.
$ETH
My only chance is in the lower part of the lateral range 🫡
Zone between $2,350 - $2,385
As long as it deviates, recover the lateral range and close candles.
$ETH
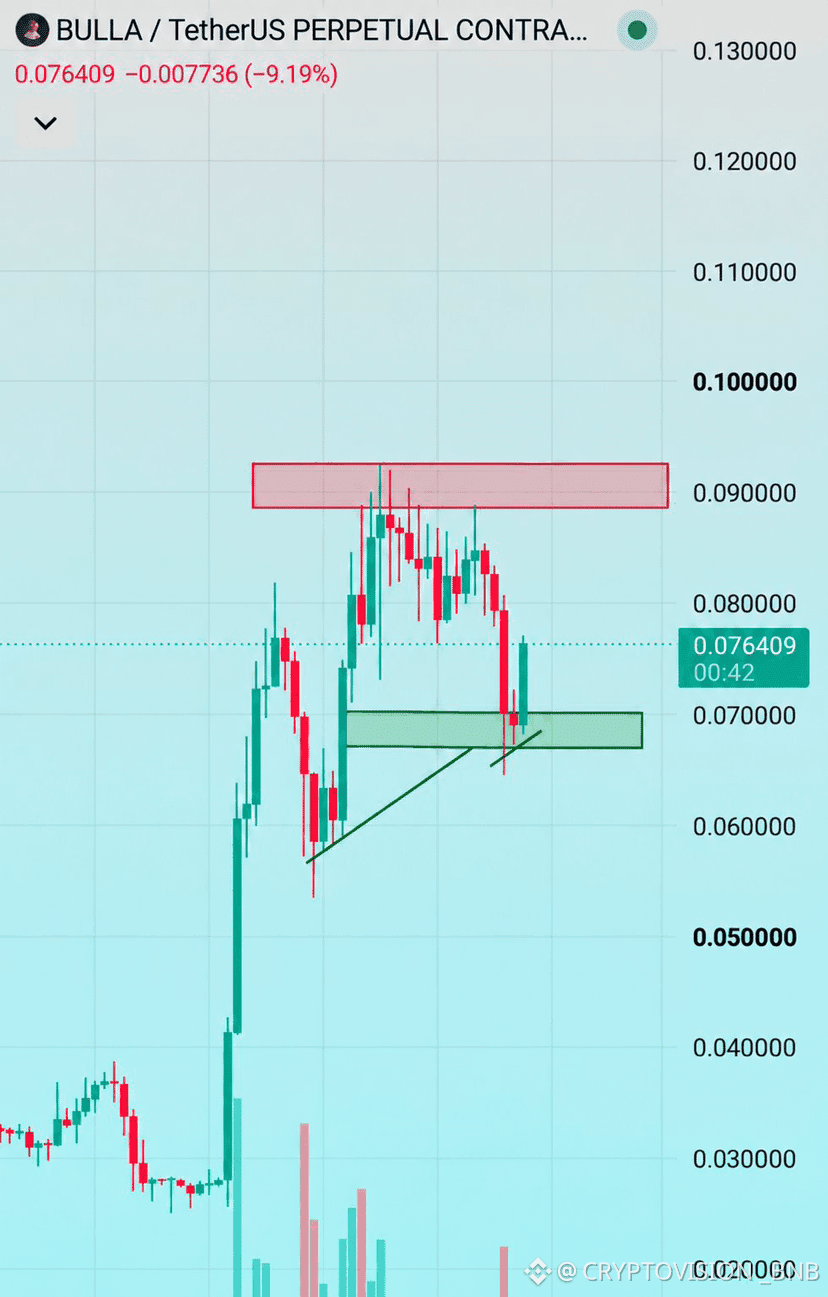
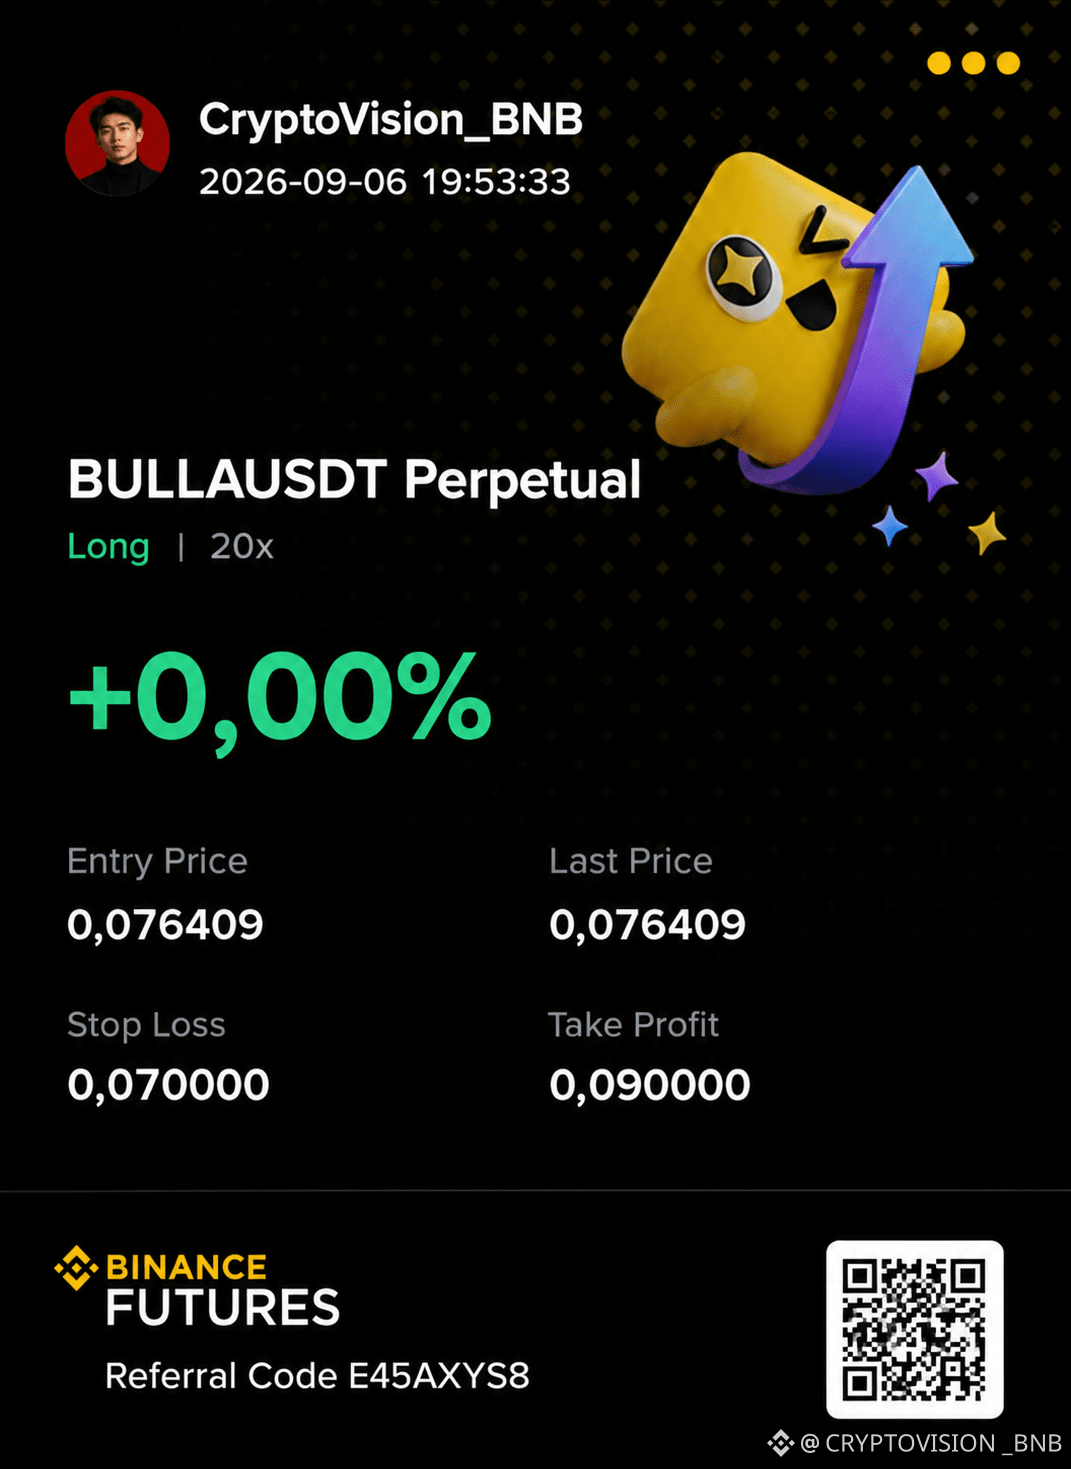
$BULLA 👀 Stay strong
SL: $0.070
TP: $0.090
The support at $0.068–$0.070 remains key. As long as it holds, I maintain a bullish bias.
Long $BULLA 👇
SL: $0.070
TP: $0.090
The support at $0.068–$0.070 remains key. As long as it holds, I maintain a bullish bias.
Long $BULLA 👇
#Bitcoin : Buy BTC in the next 85 days 🚨
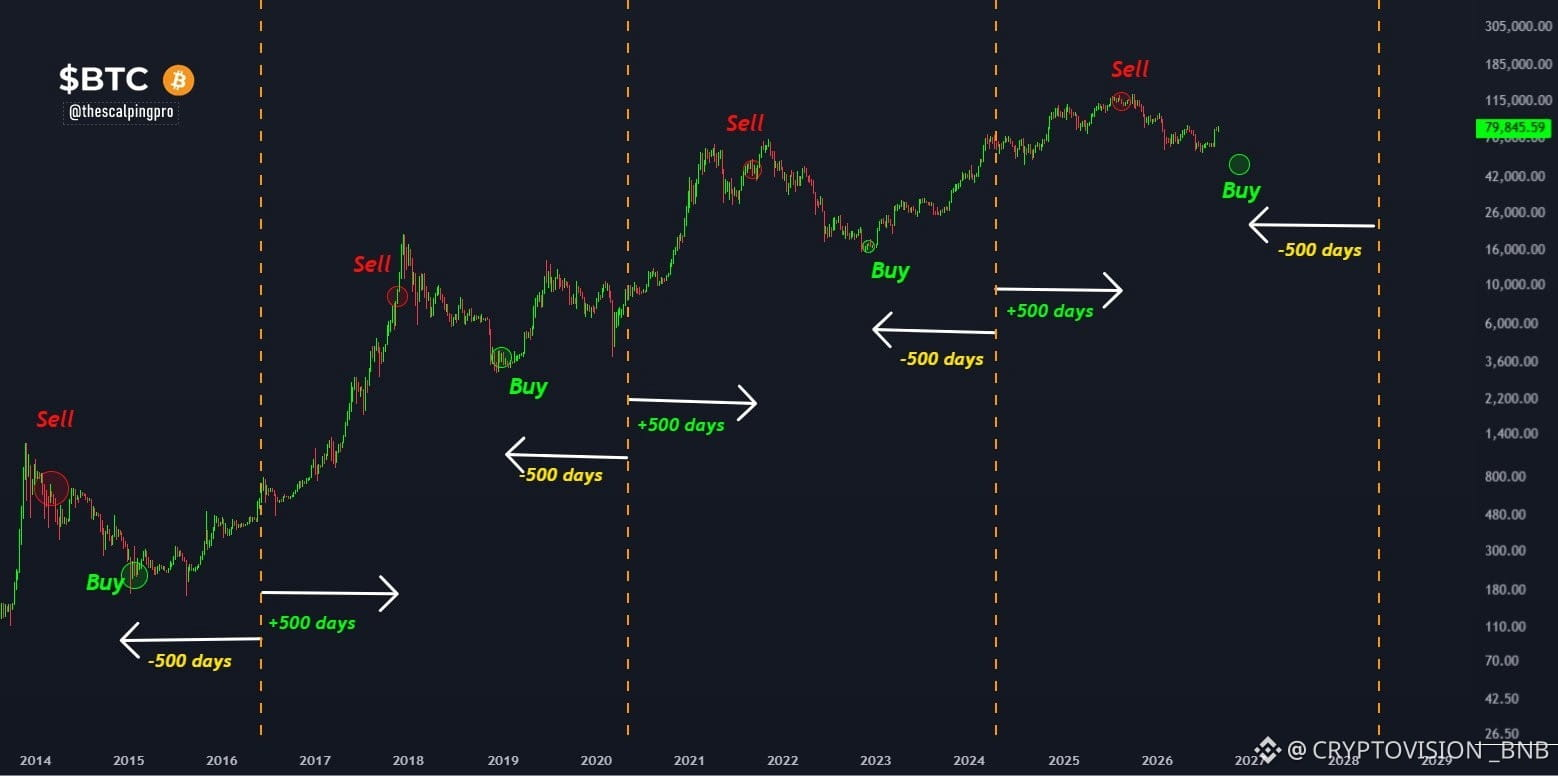
According to the 500-Day Bitcoin Strategy:
1) Buy Bitcoin 500 days before the halving
2) Hold and don’t get shaken out
3) Sell 500 days after the halving
4) Repeat
This strategy has worked remarkably well in previous cycles.
The next Bitcoin halving is only ~585 days away.
That means, according to this strategy, we have approximately 85 days left to accumulate BTC.
85 days from today = November 30.
The best time to buy Bitcoin and crypto is coming. Don’t miss it
$BTC
According to the 500-Day Bitcoin Strategy:
1) Buy Bitcoin 500 days before the halving
2) Hold and don’t get shaken out
3) Sell 500 days after the halving
4) Repeat
This strategy has worked remarkably well in previous cycles.
The next Bitcoin halving is only ~585 days away.
That means, according to this strategy, we have approximately 85 days left to accumulate BTC.
85 days from today = November 30.
The best time to buy Bitcoin and crypto is coming. Don’t miss it
$BTC
$1–$10 IS THE DISTRACTION. THE REAL GAME STARTS AT $1,000.
People laugh when they hear $1,000 XRP.
Fine.
Because they’re still thinking of XRP as a retail trade.
At $1–$10, it’s simple:
People buy.
People sell.
Traders fight over every candle.
But $1,000–$10,000 XRP is a completely different thesis.
It’s no longer retail pricing.
That’s infrastructure pricing.
That’s what happens if XRP stops being something people speculate on…
…and becomes something institutions actually need to move serious amounts of value.
The biggest mistake is looking at XRP’s future through today’s use case.
If the role changes, the valuation framework changes with it.
I’m watching that transition a lot more closely than another $2 to $3 move.
Because if XRP ever crosses that line, retail will realize what happened after the repricing has already begun.
$XRP
People laugh when they hear $1,000 XRP.
Fine.
Because they’re still thinking of XRP as a retail trade.
At $1–$10, it’s simple:
People buy.
People sell.
Traders fight over every candle.
But $1,000–$10,000 XRP is a completely different thesis.
It’s no longer retail pricing.
That’s infrastructure pricing.
That’s what happens if XRP stops being something people speculate on…
…and becomes something institutions actually need to move serious amounts of value.
The biggest mistake is looking at XRP’s future through today’s use case.
If the role changes, the valuation framework changes with it.
I’m watching that transition a lot more closely than another $2 to $3 move.
Because if XRP ever crosses that line, retail will realize what happened after the repricing has already begun.
$XRP
Log in to explore more content