
CryptoLoverArtist
859 Posts

CryptoLoverArtist
Report
Block User
I have been in crypto since 2016, on Binance since 2021. I love cryptocurrencies. I'm also an artist and a designer. Trading is my first love! BTC is Love
Open Trade

BNB Holder
Occasional Trader
8.6 Years
619 Following
700 Followers
1.1K+ Liked
Posts
Portfolio
All
Quotes
Videos
#BinancePick
2nd day
so far made 150 points , i think i got all my prediction right
What about you guys??
#BinancePick
2nd day
so far made 150 points , i think i got all my prediction right
What about you guys??
2nd day
so far made 150 points , i think i got all my prediction right
What about you guys??

How do you read a token unlock schedule? It is simpler than it looks.
Most new tokens lock team and investor allocations for a set period, often a year. The first big release is called a cliff, and after it tokens usually release gradually, month by month. That gradual part is called linear vesting.
An unlock does not mean those tokens get sold. What matters is the size of the release compared with the coins already circulating, and how much trading volume can absorb it.
A real example is coming up on Nov 24, when Monad's first team unlock releases more than 16 billion tokens, worth roughly $260 million. Big unlocks are worth checking before you buy, not after. #Crypto
How do you read a token unlock schedule? It is simpler than it looks.
Most new tokens lock team and investor allocations for a set period, often a year. The first big release is called a cliff, and after it tokens usually release gradually, month by month. That gradual part is called linear vesting.
An unlock does not mean those tokens get sold. What matters is the size of the release compared with the coins already circulating, and how much trading volume can absorb it.
A real example is coming up on Nov 24, when Monad's first team unlock releases more than 16 billion tokens, worth roughly $260 million. Big unlocks are worth checking before you buy, not after. #Crypto
Most new tokens lock team and investor allocations for a set period, often a year. The first big release is called a cliff, and after it tokens usually release gradually, month by month. That gradual part is called linear vesting.
An unlock does not mean those tokens get sold. What matters is the size of the release compared with the coins already circulating, and how much trading volume can absorb it.
A real example is coming up on Nov 24, when Monad's first team unlock releases more than 16 billion tokens, worth roughly $260 million. Big unlocks are worth checking before you buy, not after. #Crypto
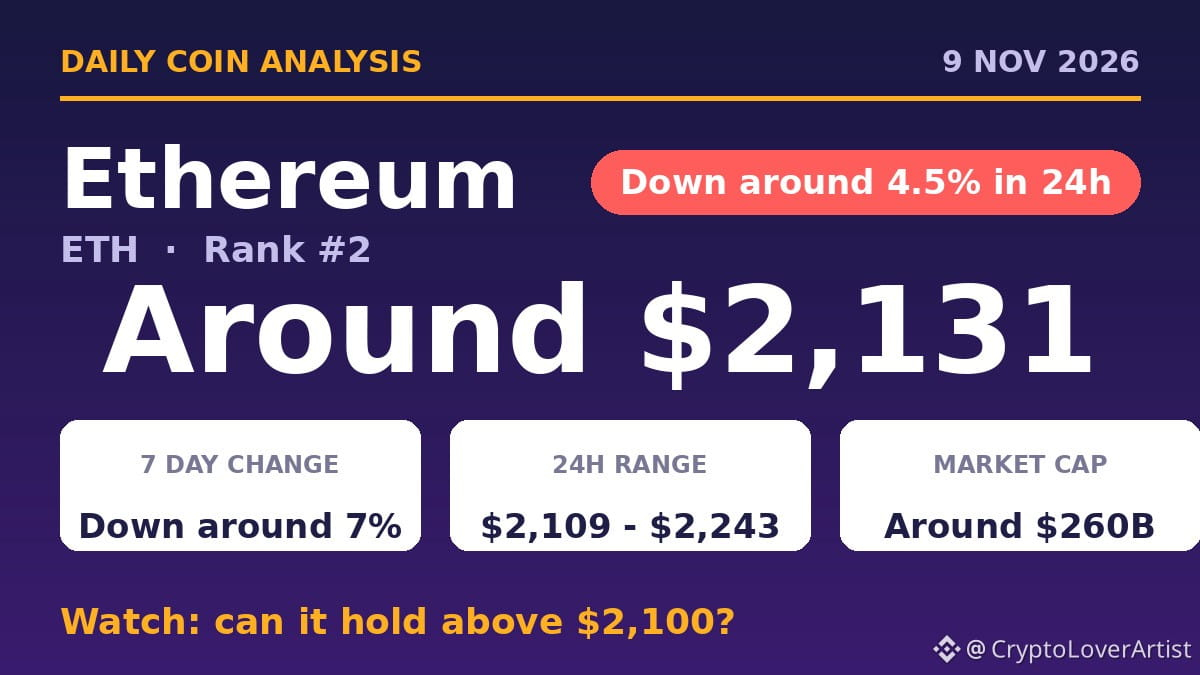
Ethereum is leading the majors lower today.
It is trading around $2,131, down around 4.5% in the last 24 hours and down around 7% over the past 7 days.
Its 24 hour range is around $2,109 to $2,243, with a market cap around $260 billion and rank 2.
A sharp late Sunday sell-off took it to its lowest since August 19, as traders price in a harder road for US crypto rules after the midterms.
Watch whether it holds above $2,100, with $2,230 the level to reclaim and more swings possible.
$ETH #markets
Ethereum is leading the majors lower today.
It is trading around $2,131, down around 4.5% in the last 24 hours and down around 7% over the past 7 days.
Its 24 hour range is around $2,109 to $2,243, with a market cap around $260 billion and rank 2.
A sharp late Sunday sell-off took it to its lowest since August 19, as traders price in a harder road for US crypto rules after the midterms.
Watch whether it holds above $2,100, with $2,230 the level to reclaim and more swings possible.
$ETH #markets
It is trading around $2,131, down around 4.5% in the last 24 hours and down around 7% over the past 7 days.
Its 24 hour range is around $2,109 to $2,243, with a market cap around $260 billion and rank 2.
A sharp late Sunday sell-off took it to its lowest since August 19, as traders price in a harder road for US crypto rules after the midterms.
Watch whether it holds above $2,100, with $2,230 the level to reclaim and more swings possible.
$ETH #markets
1
1

Article
Bitcoin at $75K: The Bear Market Has Already Happened — Now Comes the Real TestEveryone is asking the same question this morning: is a Bitcoin bear market coming?
Here is the uncomfortable answer nobody wants to hear. It is not coming. It already came.
Monday, 9 November 2026 — Outlook
$BTC made its all-time high of $126,080 on 6 October 2025. By 30 June 2026 it had fallen to $58,559 — a peak-to-trough collapse of 53.1% in 267 days. It recovered to around $85,000 in September, and this morning it trades near $75,700, still 40% below its all-time high, after one of the ugliest weeks of the year.
So the debate worth having is not whether a bear market is inevitable. The debate is whether the bear market that already happened is finished — or whether it has one final leg left in it.
Why the short term still looks dark
Let us be honest about the evidence in front of us. This is not fear, uncertainty and doubt. These are numbers.
First, the institutional bid has reversed. US spot Bitcoin ETFs lost about $1.28 billion between 2 and 6 November, their weakest week since June. One day alone, 6 November, saw $411.9 million walk out the door. The funds are now net negative for 2026 as a whole. The same ETF demand that carried Bitcoin to $126,000 is, right now, a source of selling pressure.
Second, the macro backdrop has turned hostile. October's jobs report came in at 165,000 new jobs against expectations of roughly 65,000. Within hours, markets were pricing a 77–80% chance of a Federal Reserve rate *hike* in December. Read that again. Not a cut delayed — a hike. Bitcoin has never built a sustainable rally while the Fed was tightening into it, and the next tests come fast: October CPI on Tuesday 10 November, producer prices on 13 November, and the Fed decision itself on 8–9 December.
Third, the chart is damaged. Bitcoin sits below its 20-day moving average ($79,340) and its 50-day moving average ($81,876). Daily RSI is near 39 — weak, but not yet at the washed-out levels that usually mark a final capitulation. More than $1.2 billion in leveraged positions were liquidated in a single 24-hour stretch last week, most of them longs. Bulls are still trying to catch this knife, and the market is still punishing them for it.
That is the bearish case, and in the short term, it is the correct case.
The $75,000 line is not random
Pay close attention to where the price is sitting, because this level is crowded with meaning.
Bitcoin is holding, for a fifth straight day, a tight cluster made up of the 50-week moving average ($75,562), the short-term holder cost basis ($75,820) and the average acquisition price of the largest corporate holder ($75,451). In plain English: a huge amount of Bitcoin changed hands, or was last bought, right here. Holders defend their cost basis. That is why $75,000 keeps holding.
Below it sits the real line in the sand: the 200-day moving average at $73,183. Bitcoin is only about 3.5% above it.
The scenario map from here is simple:
- Hold $75K and reclaim $78K–$82K: the recovery conversation starts, with the 50-day average at $81,876 as the trend-reclaim level and $85,000–$87,500 as the supply wall above it.
- Lose $73K on a weekly close: the door opens to $69,000, then $65,000 — a decline of roughly 14% from here that several prominent analysts are already publicly flagging.
- Lose $67,643, the 200-week moving average: this stops being a correction and starts being a structural break. The June low at $58,559 becomes the target.
What history says — and where it argues with itself
Bitcoin's full bear markets were brutal: minus 84.7% in 2013–15, minus 84.2% in 2017–18, and minus 77.6% in 2021–22. They took 410, 363 and 376 days respectively to go from peak to bottom — an average of about 384 days.
Now apply that history to today, and it gives you two opposite answers.
The timing argument says the bottom should already be in. We are 399 days past the October 2025 peak. That is longer than the average bear market took to bottom. In both 2018 and 2022, by day 399 the worst was already over. Cycle analysts who projected a low in late October 2026, based on exactly this 384-day average, are — so far — roughly on schedule.
The depth argument says it cannot be over. Every previous bear market fell at least 77%. This one has fallen 53%. If Bitcoin repeated even the mildest historical pattern, the price would be somewhere between $29,000 and $44,000, not $75,000.
Both arguments cannot be fully right. The bridge between them is the trend nobody can ignore: Bitcoin's bear markets keep getting shallower — 94%, 87%, 84%, 78%, and now 53%. Each cycle, the asset is larger, more liquid, and held by longer-horizon buyers. A 53% bear market for a multi-trillion-dollar asset may simply be what a modern Bitcoin bear market looks like. Or the shallowness means the final flush has not happened yet. Honest analysis holds both possibilities open — and prices them.
The quiet evidence that this is not 2022
While the price action screams fear, the on-chain and sentiment data are telling a calmer story.
The Fear and Greed Index sits at 25–28 — extreme fear — but the futures market shows low leverage, which means this fear is psychological, not forced selling. The MVRV ratio is 1.41 and the MVRV Z-score is 0.70–0.78, deep in what has historically been accumulation territory, not euphoria. The Mayer Multiple is 1.04, almost exactly neutral. The average holder is sitting on a modest profit, not a life-changing one, and there is no sign of the mass profit-taking that marks real cycle tops.
Spot trading activity, meanwhile, has stayed above its August trough — participation has not collapsed the way it did in the dead months of previous winters. And while ETF holders sold last week, long-horizon buyers kept buying: corporate treasuries added more than 15,000 BTC in October alone, and at least one central bank publicly announced a new allocation to Bitcoin funds last week.
Fear at the top looks like greed's mirror image. Fear at these levels, with these on-chain readings, has historically been closer to opportunity than to the end of the world. That is a statement about zones, not timing — extreme fear can always get more extreme before it turns.
What the forecasters are saying
The big institutional targets are still bullish — but read the fine print, because every one of them is conditional on ETF flows returning:
- One major bank holds a $100,000 target for the end of 2026 — a target it has already cut twice, from $300,000 — and openly flags $50,000 as its downside scenario.
- Another major research house targets $125,000 by the end of 2026 and $150,000 by mid-2027**, arguing institutional adoption has stretched the old four-year cycle into a longer one.
- A third bank raised its 12-month target to $113,000 in October, assuming about $5 billion of fresh fund inflows over the coming year.
Against that, the cycle specialists are cautious: one widely followed macro analyst warns that if technology stocks retest their summer lows, Bitcoin will too, with $58,000 in his deeper scenario. Fidelity's global macro director spent most of 2026 calling it a consolidation year, then flipped in September to calling a double bottom near $58,000–$60,000 with a $100,000 target — a thesis that lives or dies on whether that June low holds.
Translation: the bulls need flows. The bears need one support break. Right now, the bears have momentum and the bulls have a level.
My probability-weighted outlook
For the next two to six weeks, into the December Fed decision:
- Base case — 50% — $68,000 to $80,000. A grinding, sideways-to-down market. $75K is defended and lost and defended again. ETF outflows slow but do not reverse, and every rally into $80,000–$82,000 gets sold until the Fed is out of the way.
- Bear case — 30% — $58,000 to $65,000. A hot CPI print locks in the December hike, the weekly close breaks $73,000, and Bitcoin retests the June low — possibly printing a marginal new low near $58,000 before it finds real bids. This is the scenario the "dark clouds" crowd is positioned for, and it is a live one.
- Bull case — (low chance, 20%) — $82,000 to $85,000 and above. A soft CPI print kills the hike pricing, ETF flows flip positive for several straight sessions, and Bitcoin reclaims its 50-day average. That combination would turn this entire move into a bear trap.
For the medium term — the next three to six months — my honest assessment is this: the probability of a new low below $57,800 is roughly 25–30%. The probability of at least one visit to the $65,000–$69,000 zone is closer to 45–50%. The probability of Bitcoin trading back above $100,000 by mid-2027 is around 35–40%, and it depends almost entirely on two variables: ETF flows and the Fed.
The bottom line for this morning
Short term: bearish, and there is no point pretending otherwise. The trend is down, the flows are out, and the central bank is threatening to hike. Trade this market as guilty until proven innocent.
But calling a brand-new, full-scale crypto winter from here is bad maths. A 53% drawdown and 399 days of bear market have already happened. Bitcoin is sitting exactly on the cost basis of its most committed holders, sentiment is at extreme fear, on-chain valuation is in the accumulation zone, and the historical clock says bottoms form around now — not that they are guaranteed to.
The level that decides everything this week is $73,000 on a weekly close. Above it, this is a deep correction inside a longer cycle. Below it, and below $67,600 after that, the conversation changes completely.
Watch the CPI print on Tuesday. Watch whether ETF flows stop bleeding. And watch $75,000 — because as long as it holds, the bears have a forecast. The moment it breaks, they have a trend.
This article is market commentary for information only and is not financial advice. Probabilities are the author's estimates based on data available on 8–9 November 2026 and will change as new data arrives.
What do you think?
#bitcoin outlook
Bitcoin at $75K: The Bear Market Has Already Happened — Now Comes the Real Test
Everyone is asking the same question this morning: is a Bitcoin bear market coming?
Here is the uncomfortable answer nobody wants to hear. It is not coming. It already came.
Monday, 9 November 2026 — Outlook
$BTC made its all-time high of $126,080 on 6 October 2025. By 30 June 2026 it had fallen to $58,559 — a peak-to-trough collapse of 53.1% in 267 days. It recovered to around $85,000 in September, and this morning it trades near $75,700, still 40% below its all-time high, after one of the ugliest weeks of the year.
So the debate worth having is not whether a bear market is inevitable. The debate is whether the bear market that already happened is finished — or whether it has one final leg left in it.
Why the short term still looks dark
Let us be honest about the evidence in front of us. This is not fear, uncertainty and doubt. These are numbers.
First, the institutional bid has reversed. US spot Bitcoin ETFs lost about $1.28 billion between 2 and 6 November, their weakest week since June. One day alone, 6 November, saw $411.9 million walk out the door. The funds are now net negative for 2026 as a whole. The same ETF demand that carried Bitcoin to $126,000 is, right now, a source of selling pressure.
Second, the macro backdrop has turned hostile. October's jobs report came in at 165,000 new jobs against expectations of roughly 65,000. Within hours, markets were pricing a 77–80% chance of a Federal Reserve rate *hike* in December. Read that again. Not a cut delayed — a hike. Bitcoin has never built a sustainable rally while the Fed was tightening into it, and the next tests come fast: October CPI on Tuesday 10 November, producer prices on 13 November, and the Fed decision itself on 8–9 December.
Third, the chart is damaged. Bitcoin sits below its 20-day moving average ($79,340) and its 50-day moving average ($81,876). Daily RSI is near 39 — weak, but not yet at the washed-out levels that usually mark a final capitulation. More than $1.2 billion in leveraged positions were liquidated in a single 24-hour stretch last week, most of them longs. Bulls are still trying to catch this knife, and the market is still punishing them for it.
That is the bearish case, and in the short term, it is the correct case.
The $75,000 line is not random
Pay close attention to where the price is sitting, because this level is crowded with meaning.
Bitcoin is holding, for a fifth straight day, a tight cluster made up of the 50-week moving average ($75,562), the short-term holder cost basis ($75,820) and the average acquisition price of the largest corporate holder ($75,451). In plain English: a huge amount of Bitcoin changed hands, or was last bought, right here. Holders defend their cost basis. That is why $75,000 keeps holding.
Below it sits the real line in the sand: the 200-day moving average at $73,183. Bitcoin is only about 3.5% above it.
The scenario map from here is simple:
- Hold $75K and reclaim $78K–$82K: the recovery conversation starts, with the 50-day average at $81,876 as the trend-reclaim level and $85,000–$87,500 as the supply wall above it.
- Lose $73K on a weekly close: the door opens to $69,000, then $65,000 — a decline of roughly 14% from here that several prominent analysts are already publicly flagging.
- Lose $67,643, the 200-week moving average: this stops being a correction and starts being a structural break. The June low at $58,559 becomes the target.
What history says — and where it argues with itself
Bitcoin's full bear markets were brutal: minus 84.7% in 2013–15, minus 84.2% in 2017–18, and minus 77.6% in 2021–22. They took 410, 363 and 376 days respectively to go from peak to bottom — an average of about 384 days.
Now apply that history to today, and it gives you two opposite answers.
The timing argument says the bottom should already be in. We are 399 days past the October 2025 peak. That is longer than the average bear market took to bottom. In both 2018 and 2022, by day 399 the worst was already over. Cycle analysts who projected a low in late October 2026, based on exactly this 384-day average, are — so far — roughly on schedule.
The depth argument says it cannot be over. Every previous bear market fell at least 77%. This one has fallen 53%. If Bitcoin repeated even the mildest historical pattern, the price would be somewhere between $29,000 and $44,000, not $75,000.
Both arguments cannot be fully right. The bridge between them is the trend nobody can ignore: Bitcoin's bear markets keep getting shallower — 94%, 87%, 84%, 78%, and now 53%. Each cycle, the asset is larger, more liquid, and held by longer-horizon buyers. A 53% bear market for a multi-trillion-dollar asset may simply be what a modern Bitcoin bear market looks like. Or the shallowness means the final flush has not happened yet. Honest analysis holds both possibilities open — and prices them.
The quiet evidence that this is not 2022
While the price action screams fear, the on-chain and sentiment data are telling a calmer story.
The Fear and Greed Index sits at 25–28 — extreme fear — but the futures market shows low leverage, which means this fear is psychological, not forced selling. The MVRV ratio is 1.41 and the MVRV Z-score is 0.70–0.78, deep in what has historically been accumulation territory, not euphoria. The Mayer Multiple is 1.04, almost exactly neutral. The average holder is sitting on a modest profit, not a life-changing one, and there is no sign of the mass profit-taking that marks real cycle tops.
Spot trading activity, meanwhile, has stayed above its August trough — participation has not collapsed the way it did in the dead months of previous winters. And while ETF holders sold last week, long-horizon buyers kept buying: corporate treasuries added more than 15,000 BTC in October alone, and at least one central bank publicly announced a new allocation to Bitcoin funds last week.
Fear at the top looks like greed's mirror image. Fear at these levels, with these on-chain readings, has historically been closer to opportunity than to the end of the world. That is a statement about zones, not timing — extreme fear can always get more extreme before it turns.
What the forecasters are saying
The big institutional targets are still bullish — but read the fine print, because every one of them is conditional on ETF flows returning:
- One major bank holds a $100,000 target for the end of 2026 — a target it has already cut twice, from $300,000 — and openly flags $50,000 as its downside scenario.
- Another major research house targets $125,000 by the end of 2026 and $150,000 by mid-2027**, arguing institutional adoption has stretched the old four-year cycle into a longer one.
- A third bank raised its 12-month target to $113,000 in October, assuming about $5 billion of fresh fund inflows over the coming year.
Against that, the cycle specialists are cautious: one widely followed macro analyst warns that if technology stocks retest their summer lows, Bitcoin will too, with $58,000 in his deeper scenario. Fidelity's global macro director spent most of 2026 calling it a consolidation year, then flipped in September to calling a double bottom near $58,000–$60,000 with a $100,000 target — a thesis that lives or dies on whether that June low holds.
Translation: the bulls need flows. The bears need one support break. Right now, the bears have momentum and the bulls have a level.
My probability-weighted outlook
For the next two to six weeks, into the December Fed decision:
- Base case — 50% — $68,000 to $80,000. A grinding, sideways-to-down market. $75K is defended and lost and defended again. ETF outflows slow but do not reverse, and every rally into $80,000–$82,000 gets sold until the Fed is out of the way.
- Bear case — 30% — $58,000 to $65,000. A hot CPI print locks in the December hike, the weekly close breaks $73,000, and Bitcoin retests the June low — possibly printing a marginal new low near $58,000 before it finds real bids. This is the scenario the "dark clouds" crowd is positioned for, and it is a live one.
- Bull case — (low chance, 20%) — $82,000 to $85,000 and above. A soft CPI print kills the hike pricing, ETF flows flip positive for several straight sessions, and Bitcoin reclaims its 50-day average. That combination would turn this entire move into a bear trap.
For the medium term — the next three to six months — my honest assessment is this: the probability of a new low below $57,800 is roughly 25–30%. The probability of at least one visit to the $65,000–$69,000 zone is closer to 45–50%. The probability of Bitcoin trading back above $100,000 by mid-2027 is around 35–40%, and it depends almost entirely on two variables: ETF flows and the Fed.
The bottom line for this morning
Short term: bearish, and there is no point pretending otherwise. The trend is down, the flows are out, and the central bank is threatening to hike. Trade this market as guilty until proven innocent.
But calling a brand-new, full-scale crypto winter from here is bad maths. A 53% drawdown and 399 days of bear market have already happened. Bitcoin is sitting exactly on the cost basis of its most committed holders, sentiment is at extreme fear, on-chain valuation is in the accumulation zone, and the historical clock says bottoms form around now — not that they are guaranteed to.
The level that decides everything this week is $73,000 on a weekly close. Above it, this is a deep correction inside a longer cycle. Below it, and below $67,600 after that, the conversation changes completely.
Watch the CPI print on Tuesday. Watch whether ETF flows stop bleeding. And watch $75,000 — because as long as it holds, the bears have a forecast. The moment it breaks, they have a trend.
This article is market commentary for information only and is not financial advice. Probabilities are the author's estimates based on data available on 8–9 November 2026 and will change as new data arrives.
What do you think?
#bitcoin outlook
Here is the uncomfortable answer nobody wants to hear. It is not coming. It already came.
Monday, 9 November 2026 — Outlook
$BTC made its all-time high of $126,080 on 6 October 2025. By 30 June 2026 it had fallen to $58,559 — a peak-to-trough collapse of 53.1% in 267 days. It recovered to around $85,000 in September, and this morning it trades near $75,700, still 40% below its all-time high, after one of the ugliest weeks of the year.
So the debate worth having is not whether a bear market is inevitable. The debate is whether the bear market that already happened is finished — or whether it has one final leg left in it.
Why the short term still looks dark
Let us be honest about the evidence in front of us. This is not fear, uncertainty and doubt. These are numbers.
First, the institutional bid has reversed. US spot Bitcoin ETFs lost about $1.28 billion between 2 and 6 November, their weakest week since June. One day alone, 6 November, saw $411.9 million walk out the door. The funds are now net negative for 2026 as a whole. The same ETF demand that carried Bitcoin to $126,000 is, right now, a source of selling pressure.
Second, the macro backdrop has turned hostile. October's jobs report came in at 165,000 new jobs against expectations of roughly 65,000. Within hours, markets were pricing a 77–80% chance of a Federal Reserve rate *hike* in December. Read that again. Not a cut delayed — a hike. Bitcoin has never built a sustainable rally while the Fed was tightening into it, and the next tests come fast: October CPI on Tuesday 10 November, producer prices on 13 November, and the Fed decision itself on 8–9 December.
Third, the chart is damaged. Bitcoin sits below its 20-day moving average ($79,340) and its 50-day moving average ($81,876). Daily RSI is near 39 — weak, but not yet at the washed-out levels that usually mark a final capitulation. More than $1.2 billion in leveraged positions were liquidated in a single 24-hour stretch last week, most of them longs. Bulls are still trying to catch this knife, and the market is still punishing them for it.
That is the bearish case, and in the short term, it is the correct case.
The $75,000 line is not random
Pay close attention to where the price is sitting, because this level is crowded with meaning.
Bitcoin is holding, for a fifth straight day, a tight cluster made up of the 50-week moving average ($75,562), the short-term holder cost basis ($75,820) and the average acquisition price of the largest corporate holder ($75,451). In plain English: a huge amount of Bitcoin changed hands, or was last bought, right here. Holders defend their cost basis. That is why $75,000 keeps holding.
Below it sits the real line in the sand: the 200-day moving average at $73,183. Bitcoin is only about 3.5% above it.
The scenario map from here is simple:
- Hold $75K and reclaim $78K–$82K: the recovery conversation starts, with the 50-day average at $81,876 as the trend-reclaim level and $85,000–$87,500 as the supply wall above it.
- Lose $73K on a weekly close: the door opens to $69,000, then $65,000 — a decline of roughly 14% from here that several prominent analysts are already publicly flagging.
- Lose $67,643, the 200-week moving average: this stops being a correction and starts being a structural break. The June low at $58,559 becomes the target.
What history says — and where it argues with itself
Bitcoin's full bear markets were brutal: minus 84.7% in 2013–15, minus 84.2% in 2017–18, and minus 77.6% in 2021–22. They took 410, 363 and 376 days respectively to go from peak to bottom — an average of about 384 days.
Now apply that history to today, and it gives you two opposite answers.
The timing argument says the bottom should already be in. We are 399 days past the October 2025 peak. That is longer than the average bear market took to bottom. In both 2018 and 2022, by day 399 the worst was already over. Cycle analysts who projected a low in late October 2026, based on exactly this 384-day average, are — so far — roughly on schedule.
The depth argument says it cannot be over. Every previous bear market fell at least 77%. This one has fallen 53%. If Bitcoin repeated even the mildest historical pattern, the price would be somewhere between $29,000 and $44,000, not $75,000.
Both arguments cannot be fully right. The bridge between them is the trend nobody can ignore: Bitcoin's bear markets keep getting shallower — 94%, 87%, 84%, 78%, and now 53%. Each cycle, the asset is larger, more liquid, and held by longer-horizon buyers. A 53% bear market for a multi-trillion-dollar asset may simply be what a modern Bitcoin bear market looks like. Or the shallowness means the final flush has not happened yet. Honest analysis holds both possibilities open — and prices them.
The quiet evidence that this is not 2022
While the price action screams fear, the on-chain and sentiment data are telling a calmer story.
The Fear and Greed Index sits at 25–28 — extreme fear — but the futures market shows low leverage, which means this fear is psychological, not forced selling. The MVRV ratio is 1.41 and the MVRV Z-score is 0.70–0.78, deep in what has historically been accumulation territory, not euphoria. The Mayer Multiple is 1.04, almost exactly neutral. The average holder is sitting on a modest profit, not a life-changing one, and there is no sign of the mass profit-taking that marks real cycle tops.
Spot trading activity, meanwhile, has stayed above its August trough — participation has not collapsed the way it did in the dead months of previous winters. And while ETF holders sold last week, long-horizon buyers kept buying: corporate treasuries added more than 15,000 BTC in October alone, and at least one central bank publicly announced a new allocation to Bitcoin funds last week.
Fear at the top looks like greed's mirror image. Fear at these levels, with these on-chain readings, has historically been closer to opportunity than to the end of the world. That is a statement about zones, not timing — extreme fear can always get more extreme before it turns.
What the forecasters are saying
The big institutional targets are still bullish — but read the fine print, because every one of them is conditional on ETF flows returning:
- One major bank holds a $100,000 target for the end of 2026 — a target it has already cut twice, from $300,000 — and openly flags $50,000 as its downside scenario.
- Another major research house targets $125,000 by the end of 2026 and $150,000 by mid-2027**, arguing institutional adoption has stretched the old four-year cycle into a longer one.
- A third bank raised its 12-month target to $113,000 in October, assuming about $5 billion of fresh fund inflows over the coming year.
Against that, the cycle specialists are cautious: one widely followed macro analyst warns that if technology stocks retest their summer lows, Bitcoin will too, with $58,000 in his deeper scenario. Fidelity's global macro director spent most of 2026 calling it a consolidation year, then flipped in September to calling a double bottom near $58,000–$60,000 with a $100,000 target — a thesis that lives or dies on whether that June low holds.
Translation: the bulls need flows. The bears need one support break. Right now, the bears have momentum and the bulls have a level.
My probability-weighted outlook
For the next two to six weeks, into the December Fed decision:
- Base case — 50% — $68,000 to $80,000. A grinding, sideways-to-down market. $75K is defended and lost and defended again. ETF outflows slow but do not reverse, and every rally into $80,000–$82,000 gets sold until the Fed is out of the way.
- Bear case — 30% — $58,000 to $65,000. A hot CPI print locks in the December hike, the weekly close breaks $73,000, and Bitcoin retests the June low — possibly printing a marginal new low near $58,000 before it finds real bids. This is the scenario the "dark clouds" crowd is positioned for, and it is a live one.
- Bull case — (low chance, 20%) — $82,000 to $85,000 and above. A soft CPI print kills the hike pricing, ETF flows flip positive for several straight sessions, and Bitcoin reclaims its 50-day average. That combination would turn this entire move into a bear trap.
For the medium term — the next three to six months — my honest assessment is this: the probability of a new low below $57,800 is roughly 25–30%. The probability of at least one visit to the $65,000–$69,000 zone is closer to 45–50%. The probability of Bitcoin trading back above $100,000 by mid-2027 is around 35–40%, and it depends almost entirely on two variables: ETF flows and the Fed.
The bottom line for this morning
Short term: bearish, and there is no point pretending otherwise. The trend is down, the flows are out, and the central bank is threatening to hike. Trade this market as guilty until proven innocent.
But calling a brand-new, full-scale crypto winter from here is bad maths. A 53% drawdown and 399 days of bear market have already happened. Bitcoin is sitting exactly on the cost basis of its most committed holders, sentiment is at extreme fear, on-chain valuation is in the accumulation zone, and the historical clock says bottoms form around now — not that they are guaranteed to.
The level that decides everything this week is $73,000 on a weekly close. Above it, this is a deep correction inside a longer cycle. Below it, and below $67,600 after that, the conversation changes completely.
Watch the CPI print on Tuesday. Watch whether ETF flows stop bleeding. And watch $75,000 — because as long as it holds, the bears have a forecast. The moment it breaks, they have a trend.
This article is market commentary for information only and is not financial advice. Probabilities are the author's estimates based on data available on 8–9 November 2026 and will change as new data arrives.
What do you think?
#bitcoin outlook
3
3
Bitcoin is stuck near $76,000 after a rough week. Spot bitcoin ETFs saw about $1.28 billion in outflows last week, and the fear and greed index sits at 28, firmly in fear. Ethereum is holding near $2,240 while most altcoins fell harder than bitcoin.
So here is a question for the weekend: which coin do you expect to outperform this month, bitcoin or ethereum, and why? I am curious whether people are leaning toward bitcoin's safety or ethereum's upside here. #Crypto $BTC
Bitcoin is stuck near $76,000 after a rough week. Spot bitcoin ETFs saw about $1.28 billion in outflows last week, and the fear and greed index sits at 28, firmly in fear. Ethereum is holding near $2,240 while most altcoins fell harder than bitcoin.
So here is a question for the weekend: which coin do you expect to outperform this month, bitcoin or ethereum, and why? I am curious whether people are leaning toward bitcoin's safety or ethereum's upside here. #Crypto $BTC
So here is a question for the weekend: which coin do you expect to outperform this month, bitcoin or ethereum, and why? I am curious whether people are leaning toward bitcoin's safety or ethereum's upside here. #Crypto $BTC
1
1

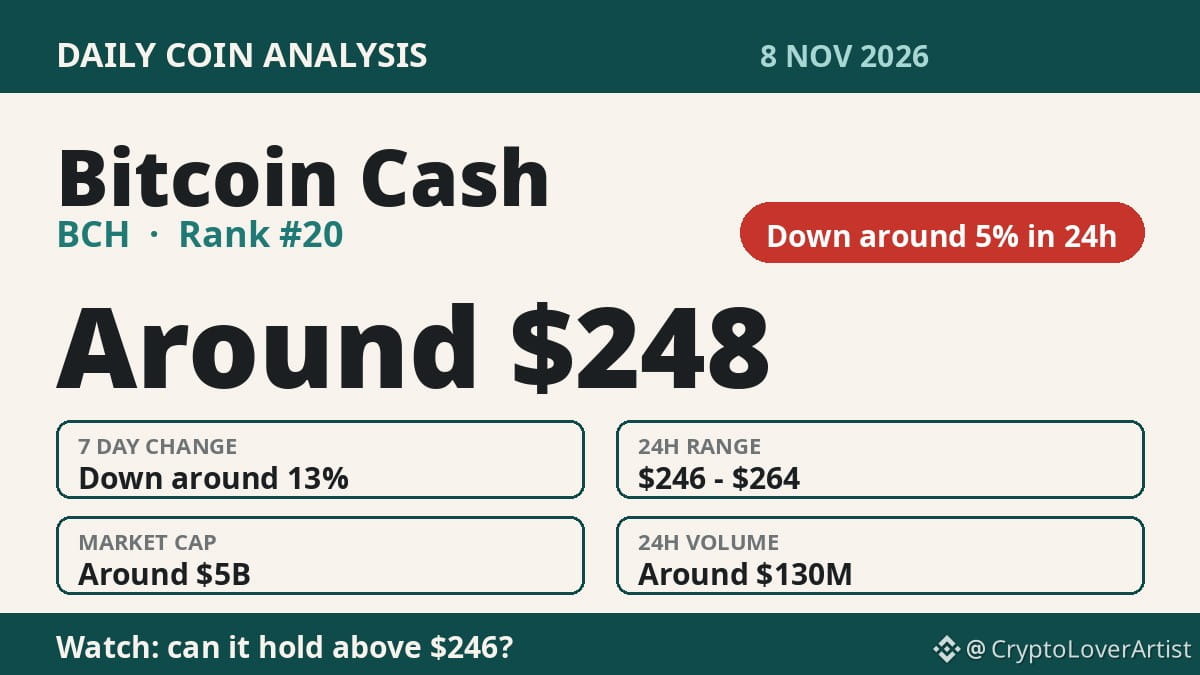
Bitcoin Cash is leading the top 20 lower today.
It is trading around $248, down around 5% in the last 24 hours and down around 13% over the past 7 days.
Its 24 hour range is around $246 to $264, with a market cap around $5 billion and rank 20.
The slide follows a wider risk-off session, with most of the top 20 in the red and market fear running high.
Watch whether it holds above $246, with $264 the level to reclaim and more swings possible.
$BCH #payments
Bitcoin Cash is leading the top 20 lower today.
It is trading around $248, down around 5% in the last 24 hours and down around 13% over the past 7 days.
Its 24 hour range is around $246 to $264, with a market cap around $5 billion and rank 20.
The slide follows a wider risk-off session, with most of the top 20 in the red and market fear running high.
Watch whether it holds above $246, with $264 the level to reclaim and more swings possible.
$BCH #payments
It is trading around $248, down around 5% in the last 24 hours and down around 13% over the past 7 days.
Its 24 hour range is around $246 to $264, with a market cap around $5 billion and rank 20.
The slide follows a wider risk-off session, with most of the top 20 in the red and market fear running high.
Watch whether it holds above $246, with $264 the level to reclaim and more swings possible.
$BCH #payments
1
1
Ever wondered what a funding rate is? It is the payment that keeps perpetual futures tied to the spot price.
Perpetual contracts never expire, so there is no expiry date to pull their price back to spot. Instead, traders pay each other, usually every eight hours.
When the rate is positive, longs pay shorts. When it is negative, shorts pay longs. The payment goes between traders, not to the exchange.
A high positive rate often means the crowd is heavily long, so it is worth checking before opening a leveraged position. #Crypto
Ever wondered what a funding rate is? It is the payment that keeps perpetual futures tied to the spot price.
Perpetual contracts never expire, so there is no expiry date to pull their price back to spot. Instead, traders pay each other, usually every eight hours.
When the rate is positive, longs pay shorts. When it is negative, shorts pay longs. The payment goes between traders, not to the exchange.
A high positive rate often means the crowd is heavily long, so it is worth checking before opening a leveraged position. #Crypto
Perpetual contracts never expire, so there is no expiry date to pull their price back to spot. Instead, traders pay each other, usually every eight hours.
When the rate is positive, longs pay shorts. When it is negative, shorts pay longs. The payment goes between traders, not to the exchange.
A high positive rate often means the crowd is heavily long, so it is worth checking before opening a leveraged position. #Crypto
1
1
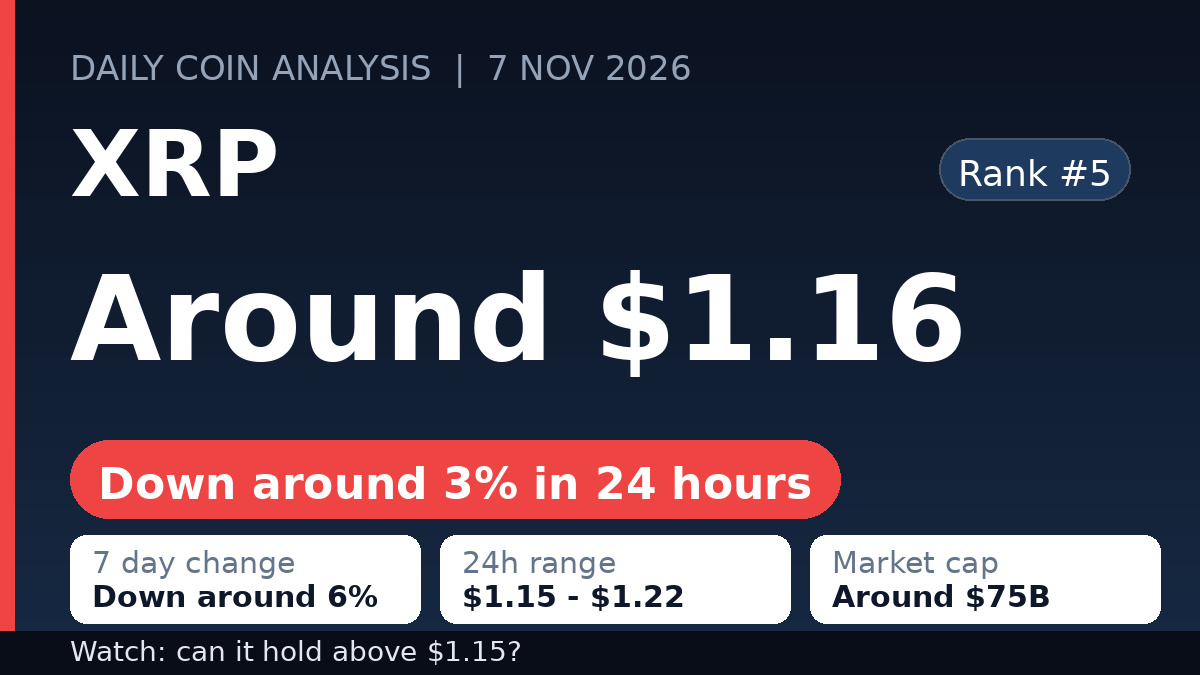
XRP is leading the top 20 lower today.
It is trading around $1.16, down around 3% in the last 24 hours and down around 6% over the past 7 days.
Its 24 hour range is around $1.15 to $1.22, with a market cap around $75 billion and rank 5.
The slide follows a wider risk-off session, with leveraged long positions forced out as US tech stocks sold off.
Watch whether it holds above $1.15, with $1.25 the level to reclaim and more swings possible.
$XRP #altcoins
XRP is leading the top 20 lower today.
It is trading around $1.16, down around 3% in the last 24 hours and down around 6% over the past 7 days.
Its 24 hour range is around $1.15 to $1.22, with a market cap around $75 billion and rank 5.
The slide follows a wider risk-off session, with leveraged long positions forced out as US tech stocks sold off.
Watch whether it holds above $1.15, with $1.25 the level to reclaim and more swings possible.
$XRP #altcoins
It is trading around $1.16, down around 3% in the last 24 hours and down around 6% over the past 7 days.
Its 24 hour range is around $1.15 to $1.22, with a market cap around $75 billion and rank 5.
The slide follows a wider risk-off session, with leveraged long positions forced out as US tech stocks sold off.
Watch whether it holds above $1.15, with $1.25 the level to reclaim and more swings possible.
$XRP #altcoins
1
1
·
--
Bullish
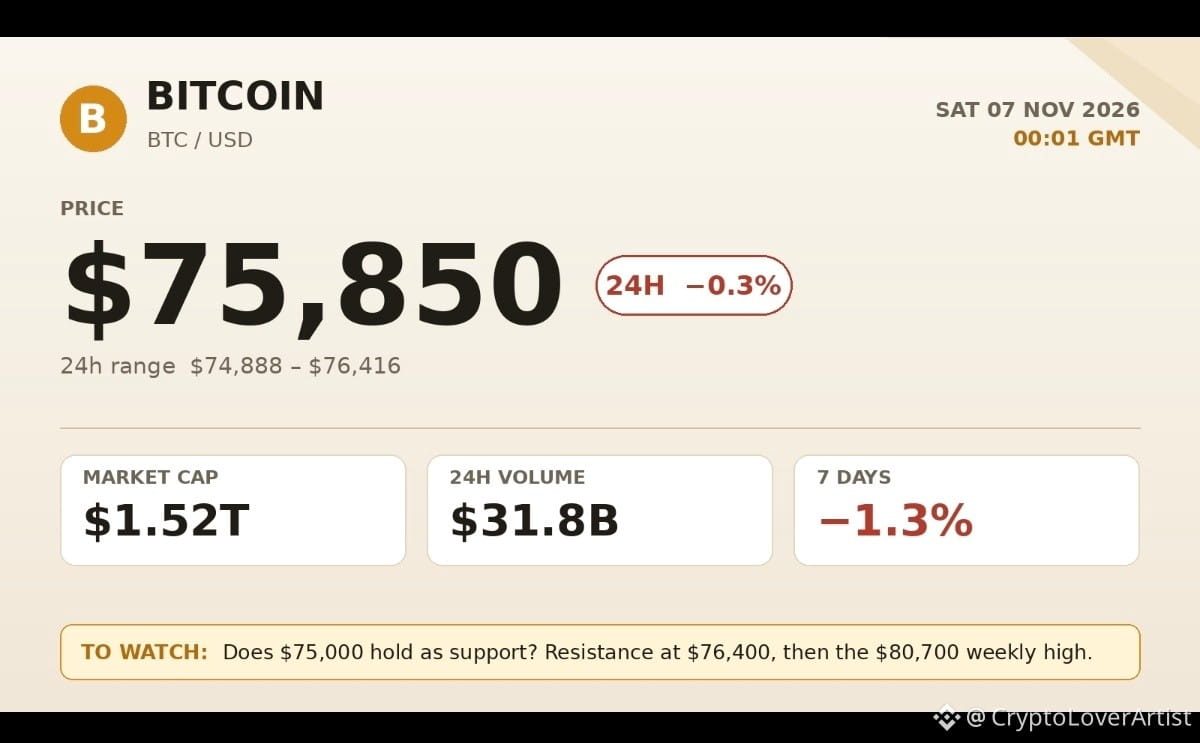
Bitcoin is trading around $75,850, little changed over the last 24 hours (down about 0.3%), after moving between about $74,900 and $76,400.
$BTC
{spot}(BTCUSDT)
The post-midterm bounce is gone — Thursday's 5.5% slide in US tech stocks spilled into crypto, with over $1.27 billion in leveraged positions liquidated in a day, mostly bullish bets.
US spot bitcoin funds saw $430 million in net outflows on Thursday, led by Fidelity at about $200 million, and bitcoin briefly slipped below $75,000 on Friday — its first time under that level since August — after a stronger-than-expected US jobs report.
To watch: whether $75,000 holds as support, and whether the fund outflows ease — BlackRock's fund has now seen five straight sessions of outflows.
Bitcoin is trading around $75,850, little changed over the last 24 hours (down about 0.3%), after moving between about $74,900 and $76,400.
$BTC
The post-midterm bounce is gone — Thursday's 5.5% slide in US tech stocks spilled into crypto, with over $1.27 billion in leveraged positions liquidated in a day, mostly bullish bets.
US spot bitcoin funds saw $430 million in net outflows on Thursday, led by Fidelity at about $200 million, and bitcoin briefly slipped below $75,000 on Friday — its first time under that level since August — after a stronger-than-expected US jobs report.
To watch: whether $75,000 holds as support, and whether the fund outflows ease — BlackRock's fund has now seen five straight sessions of outflows.
$BTC
The post-midterm bounce is gone — Thursday's 5.5% slide in US tech stocks spilled into crypto, with over $1.27 billion in leveraged positions liquidated in a day, mostly bullish bets.
US spot bitcoin funds saw $430 million in net outflows on Thursday, led by Fidelity at about $200 million, and bitcoin briefly slipped below $75,000 on Friday — its first time under that level since August — after a stronger-than-expected US jobs report.
To watch: whether $75,000 holds as support, and whether the fund outflows ease — BlackRock's fund has now seen five straight sessions of outflows.
Bitcoin gave back the whole rebound in one day. After climbing above $80,000, it slipped back toward $76,000 as a sharp selloff in US tech stocks spilled into crypto, with over $1.2 billion in leveraged positions liquidated in 24 hours, most of them longs.
My take: yesterday's bounce was relief, not a turn, and this confirms it. The market is still trading on stock-market mood, not its own story, so watch whether $75,000 holds before reading anything into the next bounce. #Bitcoin $BTC
Bitcoin gave back the whole rebound in one day. After climbing above $80,000, it slipped back toward $76,000 as a sharp selloff in US tech stocks spilled into crypto, with over $1.2 billion in leveraged positions liquidated in 24 hours, most of them longs.
My take: yesterday's bounce was relief, not a turn, and this confirms it. The market is still trading on stock-market mood, not its own story, so watch whether $75,000 holds before reading anything into the next bounce. #Bitcoin $BTC
My take: yesterday's bounce was relief, not a turn, and this confirms it. The market is still trading on stock-market mood, not its own story, so watch whether $75,000 holds before reading anything into the next bounce. #Bitcoin $BTC
1
1
1
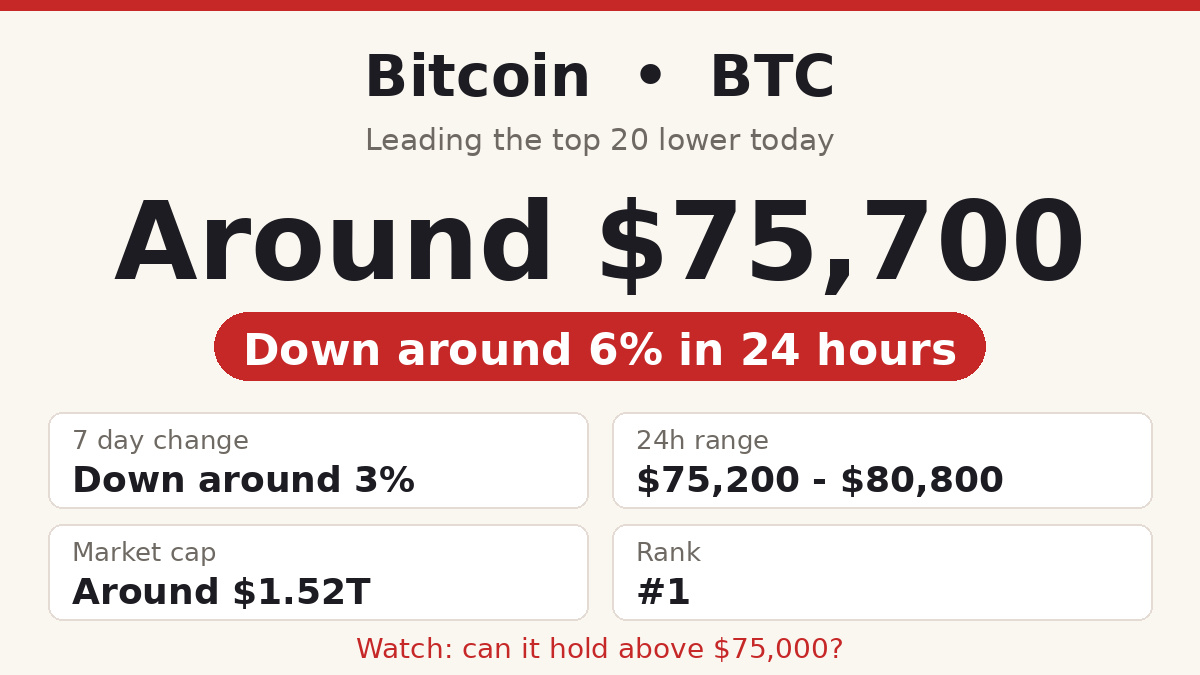
Bitcoin is dragging the top 20 lower today.
It is trading around $75,700, down around 6% in the last 24 hours and down around 3% over the past 7 days.
Its 24 hour range is around $75,200 to $80,800, with a market cap around $1.52 trillion and rank 1.
A sharp selloff in US tech stocks spilled into crypto, with over $1 billion in leveraged positions liquidated in 24 hours.
Watch whether it holds above $75,000, with US jobs data due today and more volatility possible.
$BTC #markets
Bitcoin is dragging the top 20 lower today.
It is trading around $75,700, down around 6% in the last 24 hours and down around 3% over the past 7 days.
Its 24 hour range is around $75,200 to $80,800, with a market cap around $1.52 trillion and rank 1.
A sharp selloff in US tech stocks spilled into crypto, with over $1 billion in leveraged positions liquidated in 24 hours.
Watch whether it holds above $75,000, with US jobs data due today and more volatility possible.
$BTC #markets
It is trading around $75,700, down around 6% in the last 24 hours and down around 3% over the past 7 days.
Its 24 hour range is around $75,200 to $80,800, with a market cap around $1.52 trillion and rank 1.
A sharp selloff in US tech stocks spilled into crypto, with over $1 billion in leveraged positions liquidated in 24 hours.
Watch whether it holds above $75,000, with US jobs data due today and more volatility possible.
$BTC #markets
1
1
Bitcoin is back above $80,000 after a sharp round trip. It dipped toward $75,700 as early midterm results came in, then recovered within a day as stocks rallied and oil fell.
The bounce was powered by short covering, with around $450 million in crypto shorts liquidated in 24 hours, while spot bitcoin ETFs took in about $75 million after three days of outflows.
My take: this looks like relief, not a fresh trend yet. Futures open interest barely moved and spot demand still looks soft, so holding above $80,000 matters more than the bounce itself.
#Bitcoin $BTC
Bitcoin is back above $80,000 after a sharp round trip. It dipped toward $75,700 as early midterm results came in, then recovered within a day as stocks rallied and oil fell.
The bounce was powered by short covering, with around $450 million in crypto shorts liquidated in 24 hours, while spot bitcoin ETFs took in about $75 million after three days of outflows.
My take: this looks like relief, not a fresh trend yet. Futures open interest barely moved and spot demand still looks soft, so holding above $80,000 matters more than the bounce itself.
#Bitcoin $BTC
The bounce was powered by short covering, with around $450 million in crypto shorts liquidated in 24 hours, while spot bitcoin ETFs took in about $75 million after three days of outflows.
My take: this looks like relief, not a fresh trend yet. Futures open interest barely moved and spot demand still looks soft, so holding above $80,000 matters more than the bounce itself.
#Bitcoin $BTC
1
1
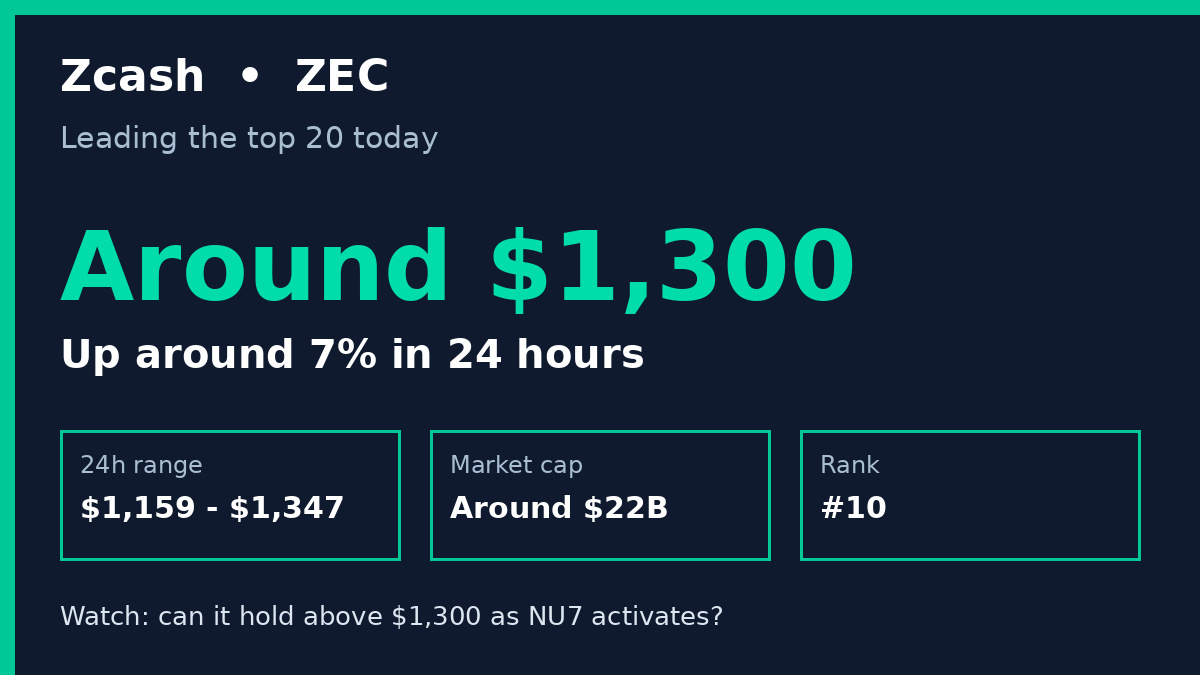
Zcash is leading the top 20 today.
It is trading around $1,300, up around 7% in the last 24 hours and down around 1% over the past 7 days.
Its 24 hour range is around $1,159 to $1,347, with a market cap around $22 billion and rank 10.
Traders are positioning ahead of the NU7 network upgrade due around today, which cuts target block times from 75 seconds to 25 seconds.
Watch whether it holds above $1,300 as the upgrade activates, with pullbacks still possible.
$ZEC #privacy
Zcash is leading the top 20 today.
It is trading around $1,300, up around 7% in the last 24 hours and down around 1% over the past 7 days.
Its 24 hour range is around $1,159 to $1,347, with a market cap around $22 billion and rank 10.
Traders are positioning ahead of the NU7 network upgrade due around today, which cuts target block times from 75 seconds to 25 seconds.
Watch whether it holds above $1,300 as the upgrade activates, with pullbacks still possible.
$ZEC #privacy
It is trading around $1,300, up around 7% in the last 24 hours and down around 1% over the past 7 days.
Its 24 hour range is around $1,159 to $1,347, with a market cap around $22 billion and rank 10.
Traders are positioning ahead of the NU7 network upgrade due around today, which cuts target block times from 75 seconds to 25 seconds.
Watch whether it holds above $1,300 as the upgrade activates, with pullbacks still possible.
$ZEC #privacy
1
1
1
·
--
Bearish
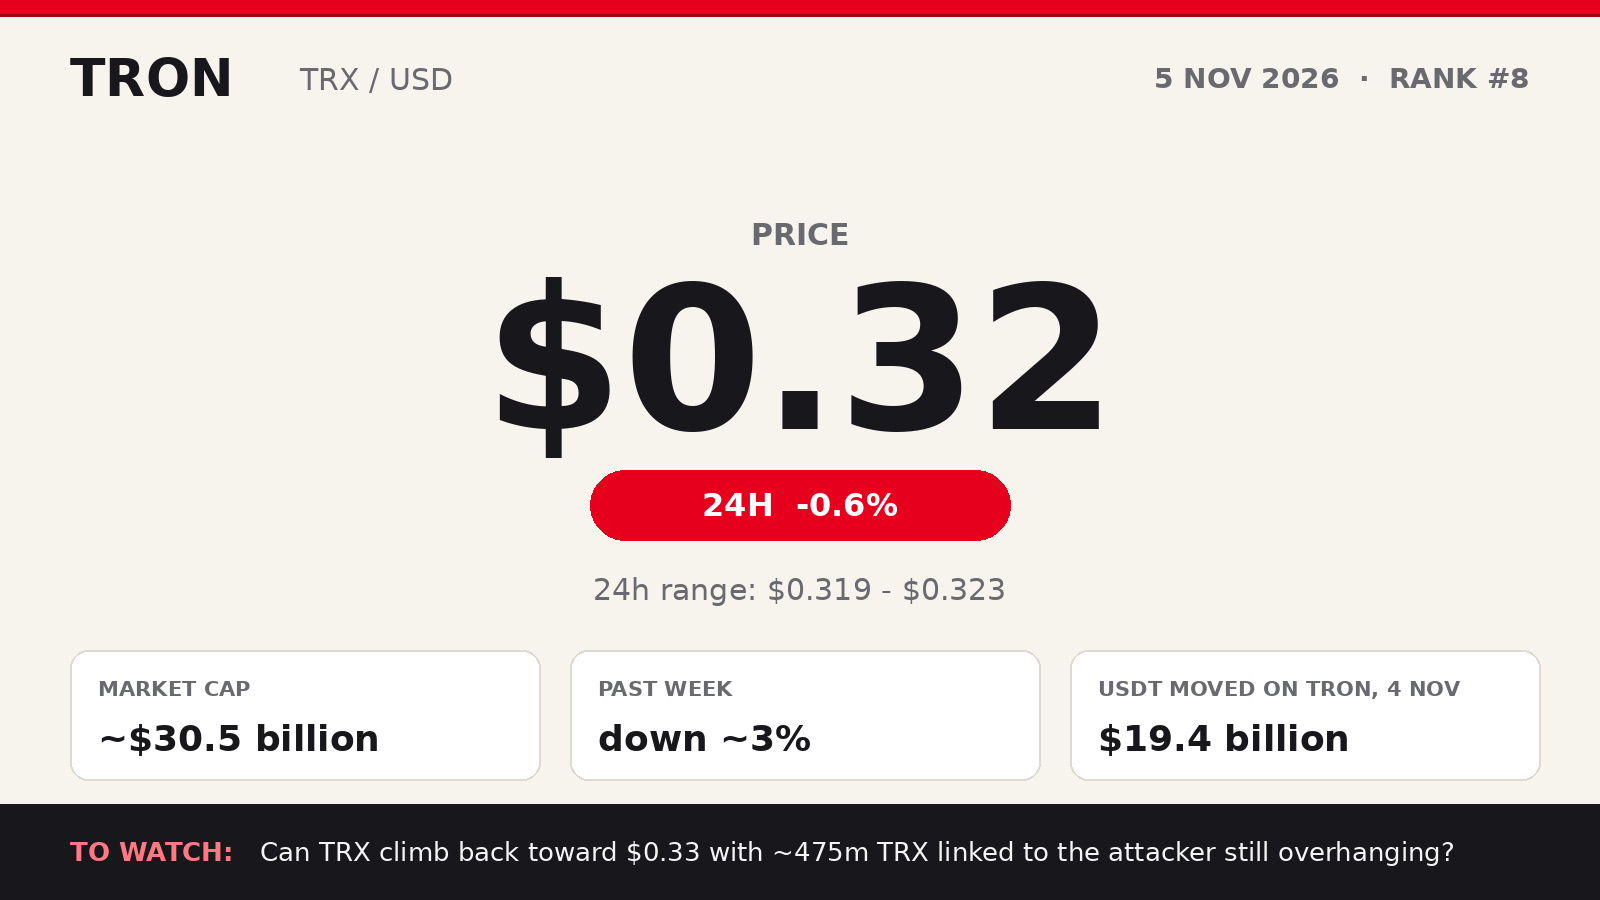
Tron (TRX) is trading around $0.32 this morning, down about 0.6% over the last 24 hours, after holding between about $0.319 and $0.323.
$TRX
{spot}(TRXUSDT)
The network keeps doing the heavy lifting on stablecoins: about $19.4 billion in USDT moved on Tron in a single day on 4 November, and its Q3 report put average stablecoin supply at a record $92.25 billion.
Its Proposal 108 upgrade, which optimizes smart-contract storage, went live on 2 November.
Tron still ranks eighth by market value at around $30.5 billion, down roughly 3% over the past week.
To watch: whether TRX can climb back toward $0.33, its level before the 29 October incident, while around 475 million TRX linked to that incident's attacker remains an overhang.
#TronNetwork
Tron (TRX) is trading around $0.32 this morning, down about 0.6% over the last 24 hours, after holding between about $0.319 and $0.323.
$TRX
The network keeps doing the heavy lifting on stablecoins: about $19.4 billion in USDT moved on Tron in a single day on 4 November, and its Q3 report put average stablecoin supply at a record $92.25 billion.
Its Proposal 108 upgrade, which optimizes smart-contract storage, went live on 2 November.
Tron still ranks eighth by market value at around $30.5 billion, down roughly 3% over the past week.
To watch: whether TRX can climb back toward $0.33, its level before the 29 October incident, while around 475 million TRX linked to that incident's attacker remains an overhang.
#TronNetwork
$TRX
The network keeps doing the heavy lifting on stablecoins: about $19.4 billion in USDT moved on Tron in a single day on 4 November, and its Q3 report put average stablecoin supply at a record $92.25 billion.
Its Proposal 108 upgrade, which optimizes smart-contract storage, went live on 2 November.
Tron still ranks eighth by market value at around $30.5 billion, down roughly 3% over the past week.
To watch: whether TRX can climb back toward $0.33, its level before the 29 October incident, while around 475 million TRX linked to that incident's attacker remains an overhang.
#TronNetwork
1
1
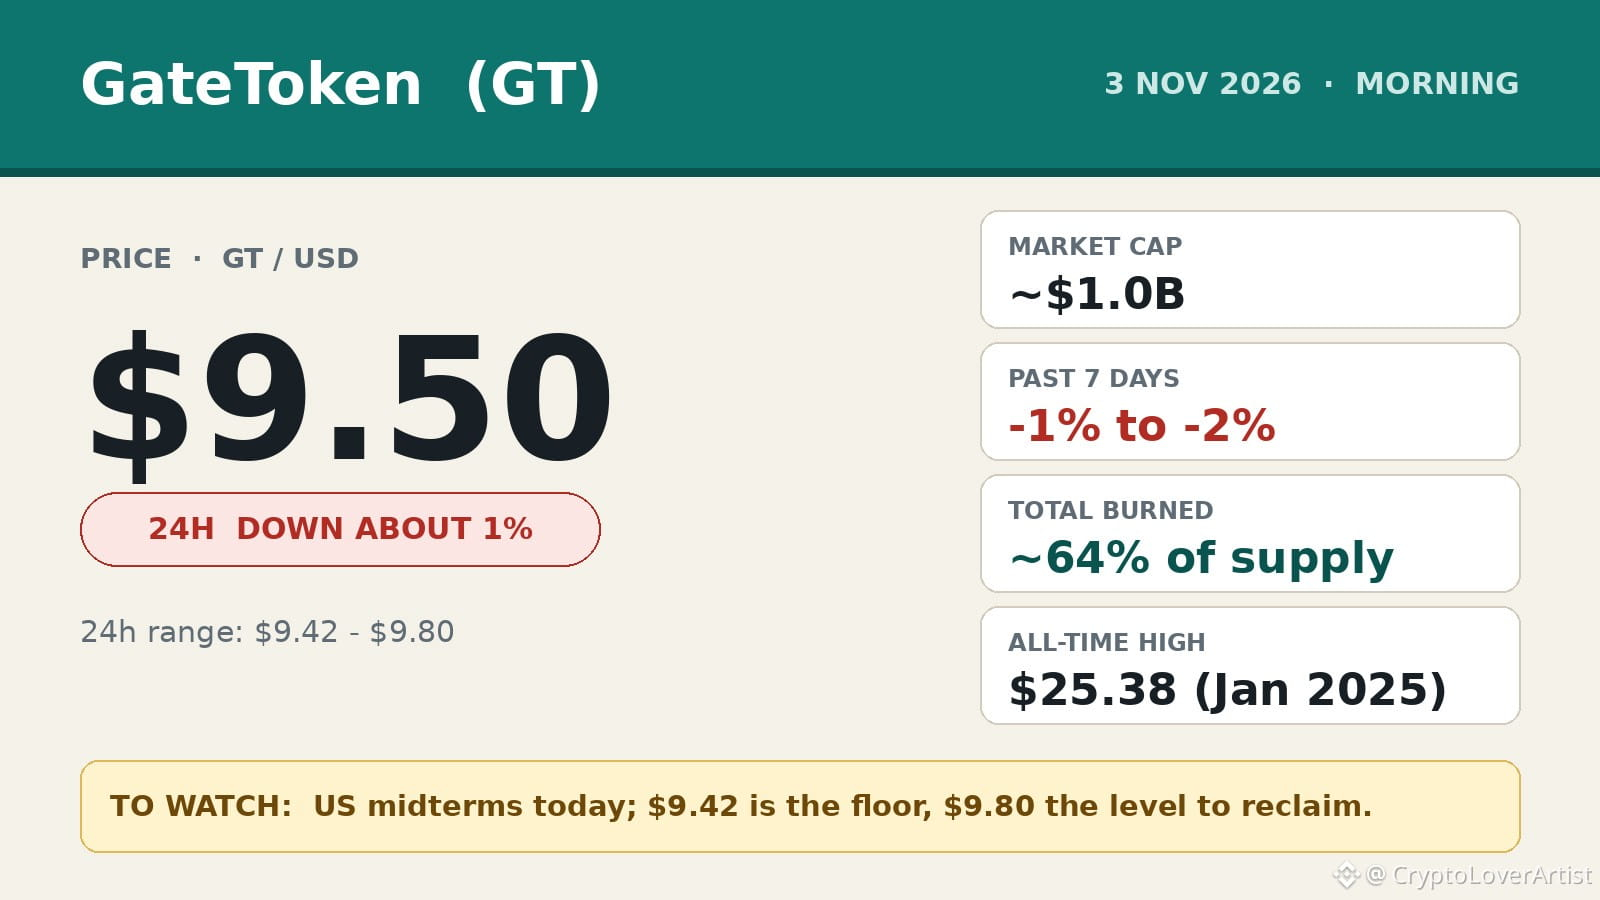
GateToken (GT) is trading around $9.50 this morning, down about 1% over the last 24 hours, after touching a $9.42 low in a cautious market.
There is no fresh GT-specific headline behind the dip: the wider market is still digesting last week's $6.3 billion hack at Binance, whose withdrawals reopened on 2 November with $3.64 billion in net outflows, and GT is easing with that risk-off mood.
GT's market value sits around $1.0 billion, down roughly 1-2% over the past week, and its quarterly burn programme has now removed about 64% of its original 300 million supply, the latest quarterly burn on 5 October destroying about 1.99 million GT.
To watch: today's US midterm elections and whether withdrawal flows settle — $9.42 is the near-term floor to hold, with $9.80 the level to reclaim.
#GT
GateToken (GT) is trading around $9.50 this morning, down about 1% over the last 24 hours, after touching a $9.42 low in a cautious market.
There is no fresh GT-specific headline behind the dip: the wider market is still digesting last week's $6.3 billion hack at Binance, whose withdrawals reopened on 2 November with $3.64 billion in net outflows, and GT is easing with that risk-off mood.
GT's market value sits around $1.0 billion, down roughly 1-2% over the past week, and its quarterly burn programme has now removed about 64% of its original 300 million supply, the latest quarterly burn on 5 October destroying about 1.99 million GT.
To watch: today's US midterm elections and whether withdrawal flows settle — $9.42 is the near-term floor to hold, with $9.80 the level to reclaim.
#GT
There is no fresh GT-specific headline behind the dip: the wider market is still digesting last week's $6.3 billion hack at Binance, whose withdrawals reopened on 2 November with $3.64 billion in net outflows, and GT is easing with that risk-off mood.
GT's market value sits around $1.0 billion, down roughly 1-2% over the past week, and its quarterly burn programme has now removed about 64% of its original 300 million supply, the latest quarterly burn on 5 October destroying about 1.99 million GT.
To watch: today's US midterm elections and whether withdrawal flows settle — $9.42 is the near-term floor to hold, with $9.80 the level to reclaim.
#GT
1
1
·
--
Bullish
Verified
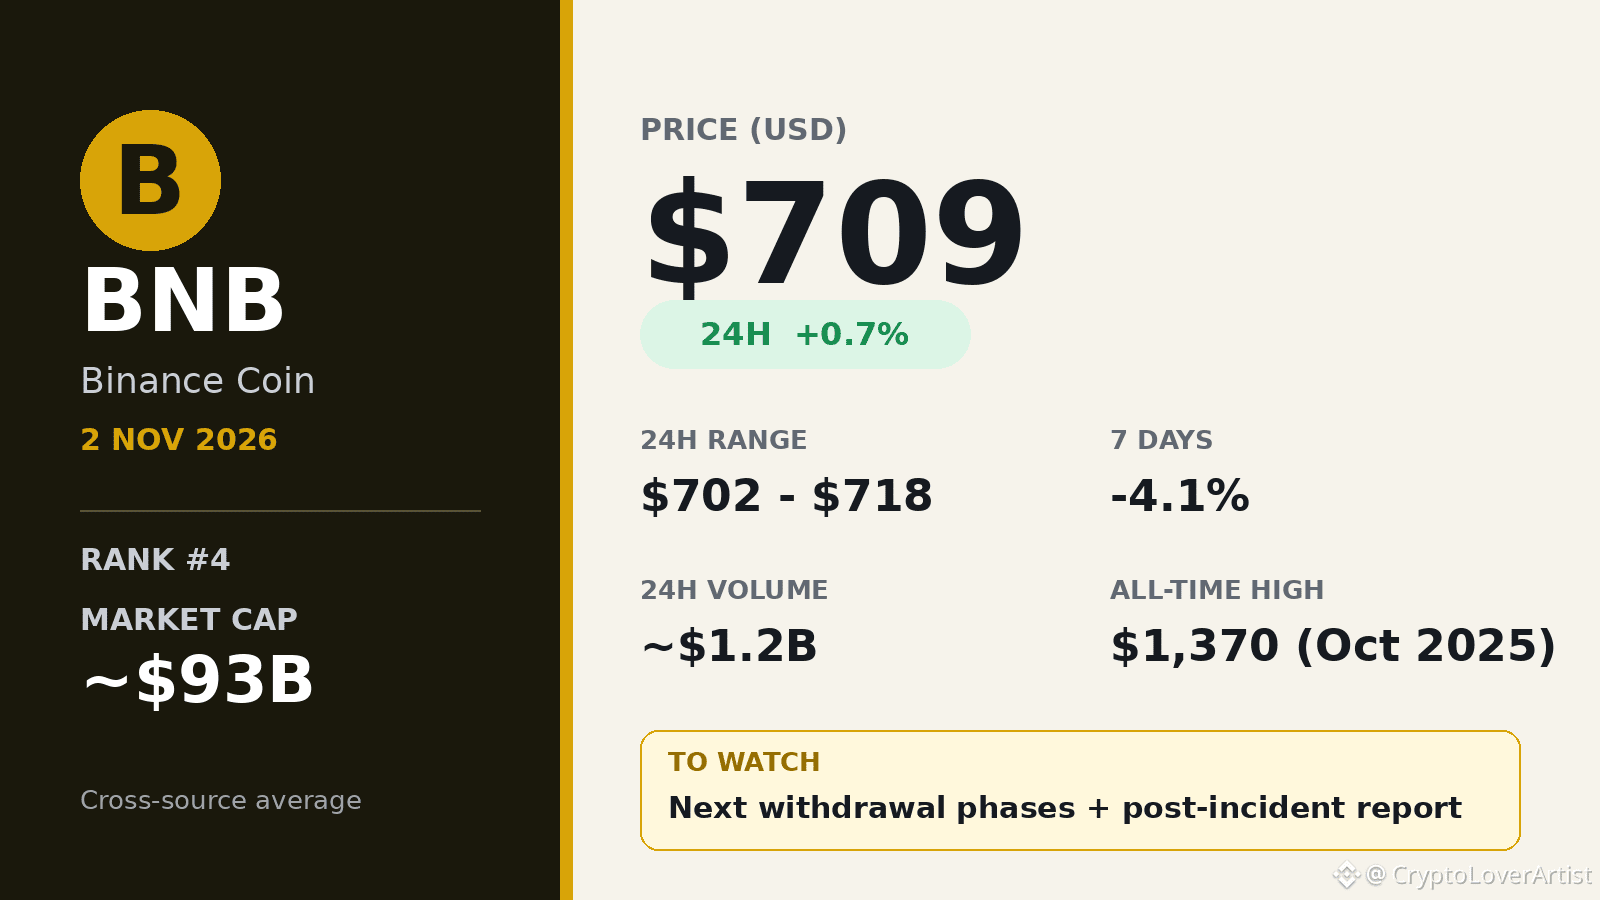
BNB is trading around $709, up about 0.7% in the last 24 hours, holding above $700 after a choppy week.
The move follows the phased reopening of withdrawals on 1 November, after the 29 October security incident, with around 95% of affected assets reported replenished and BNB balances fully backed.
It is still down roughly 4% over the past week and sits well below its October 2025 high near $1,370, so this looks like stabilisation rather than a fresh rally.
One thing to watch: the next phases of the withdrawal reopening and the promised post-incident report, which should show whether confidence fully returns.
Buy the dip !
$BNB
{spot}(BNBUSDT)
BNB is trading around $709, up about 0.7% in the last 24 hours, holding above $700 after a choppy week.
The move follows the phased reopening of withdrawals on 1 November, after the 29 October security incident, with around 95% of affected assets reported replenished and BNB balances fully backed.
It is still down roughly 4% over the past week and sits well below its October 2025 high near $1,370, so this looks like stabilisation rather than a fresh rally.
One thing to watch: the next phases of the withdrawal reopening and the promised post-incident report, which should show whether confidence fully returns.
Buy the dip !
$BNB
The move follows the phased reopening of withdrawals on 1 November, after the 29 October security incident, with around 95% of affected assets reported replenished and BNB balances fully backed.
It is still down roughly 4% over the past week and sits well below its October 2025 high near $1,370, so this looks like stabilisation rather than a fresh rally.
One thing to watch: the next phases of the withdrawal reopening and the promised post-incident report, which should show whether confidence fully returns.
Buy the dip !
$BNB
2
2

·
--
Bullish
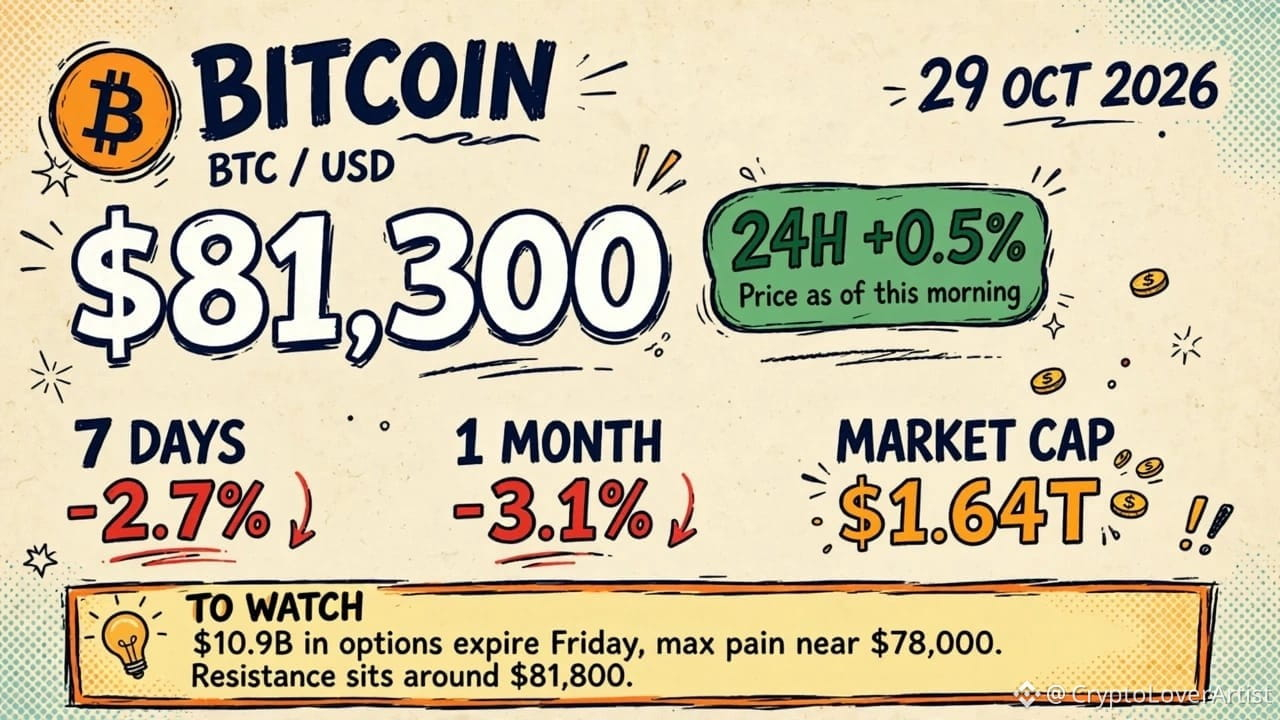
Bitcoin is trading around $81300 this morning, up about 0.5% over the last 24 hours, after closing Wednesday at $81,254.
The bounce came after the Fed held rates on Wednesday, with spot Bitcoin ETFs taking in about $176 million on Tuesday, their second straight day of inflows after about $110 million on Monday. Bitcoin is still down about 2.7% over the week and about 3.1% over the month.
To watch: $10.9 billion in Bitcoin options expire on Friday, with the max pain price near $78,000, about 4% below current levels, and resistance around $81,800.
#bnb $BNB
Bitcoin is trading around $81300 this morning, up about 0.5% over the last 24 hours, after closing Wednesday at $81,254.
The bounce came after the Fed held rates on Wednesday, with spot Bitcoin ETFs taking in about $176 million on Tuesday, their second straight day of inflows after about $110 million on Monday. Bitcoin is still down about 2.7% over the week and about 3.1% over the month.
To watch: $10.9 billion in Bitcoin options expire on Friday, with the max pain price near $78,000, about 4% below current levels, and resistance around $81,800.
#bnb $BNB
The bounce came after the Fed held rates on Wednesday, with spot Bitcoin ETFs taking in about $176 million on Tuesday, their second straight day of inflows after about $110 million on Monday. Bitcoin is still down about 2.7% over the week and about 3.1% over the month.
To watch: $10.9 billion in Bitcoin options expire on Friday, with the max pain price near $78,000, about 4% below current levels, and resistance around $81,800.
#bnb $BNB
1
1
1
Log in to explore more content
Join global crypto users on Binance Square
⚡️ Get latest and useful information about crypto.
💬 Trusted by the world’s largest crypto exchange.
👍 Discover real insights from verified creators.
Email / Phone number
Trending Topics
NvidiaInvestigatesAfterHuang’sAffairApology
217,438 views
1,755 Discussing
Nvidia Board Opens Probe Into Whether Huang Was Target of Foreign Intelligence Effort
Binance News
·21 Likes
·55.2k views
CPITestsDecemberRateOutlook
667,386 views
2,836 Discussing
AnthropicRejectsIPODelayValuationinQuestion
42,326 views
428 Discussing