
CRYPTO ACADEMY 711
114 Posts

CRYPTO ACADEMY 711
Report
Block User
Crypto Analyst | BTC & Altcoin Analysis | Daily Market Updates | Candlestick Charts | Learn and Grow | Follow for Crypto Insights
Open Trade
17 Days
2 Following
6 Followers
9 Liked
Posts
Portfolio
·
--
Bearish
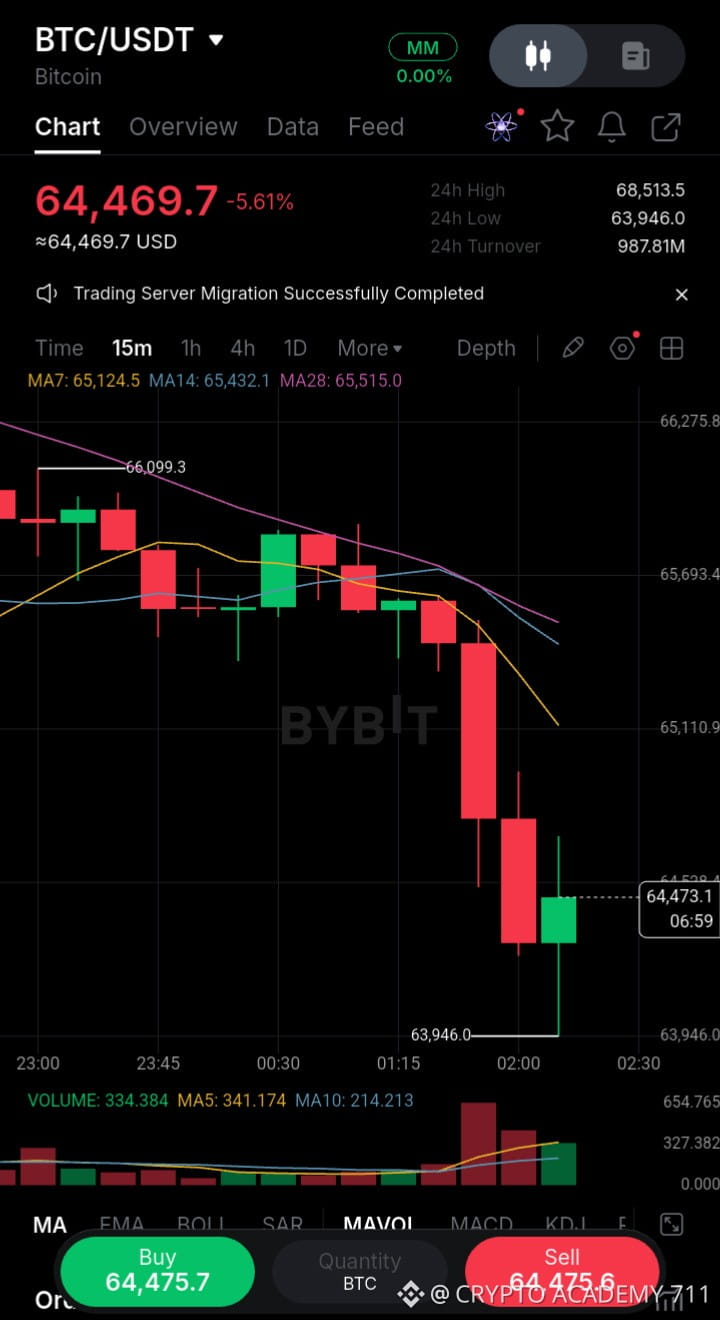
BITCOIN ALLERT 🚨
$BTC drops below $64,500
{spot}(BTCUSDT)
BITCOIN ALLERT 🚨
$BTC drops below $64,500
$BTC drops below $64,500
93
·
--
Bearish
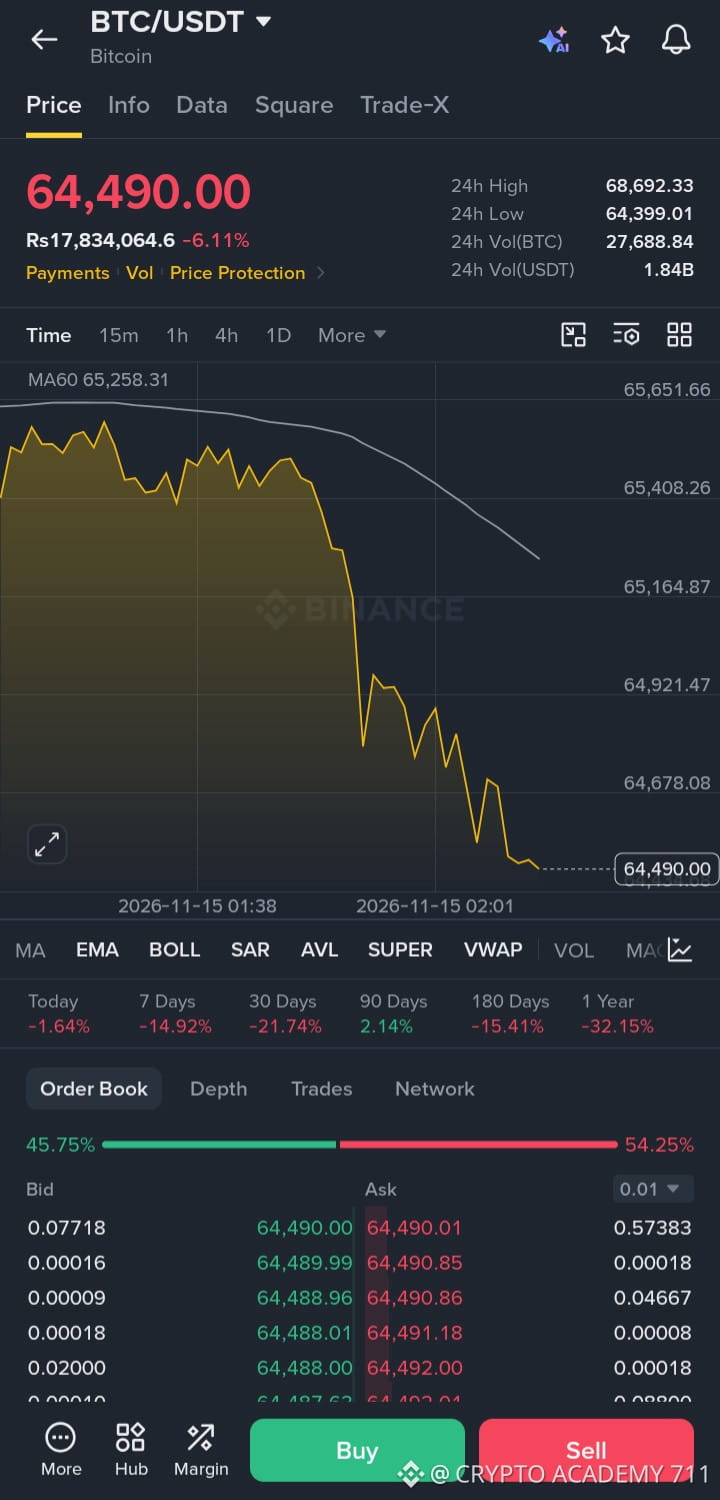
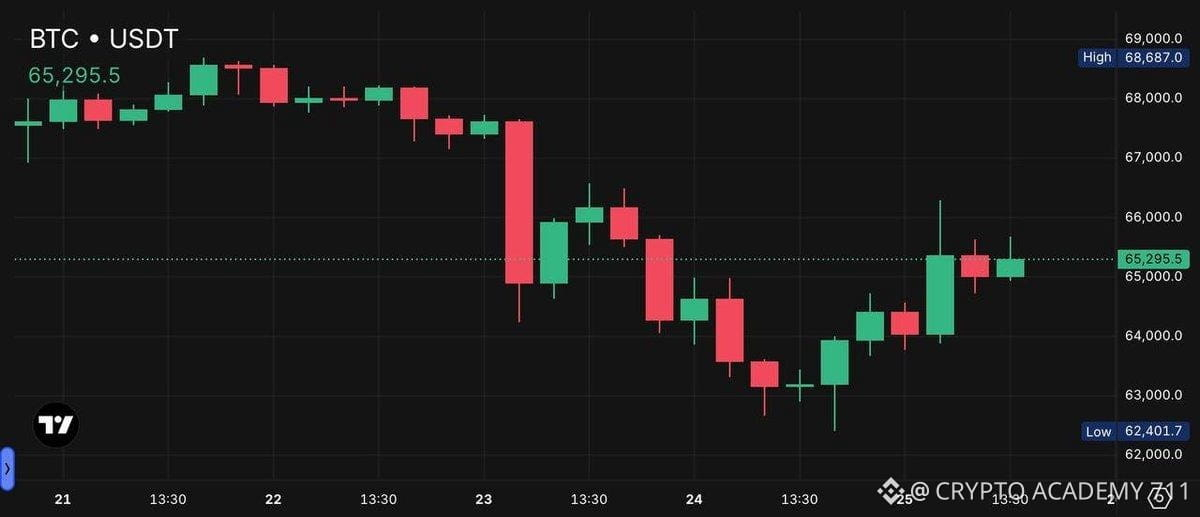
$BTC ₿ BTC MARKET UPDATE | 15 NOVEMBER 2026
💰 Current BTC Price: $64,458.18 📉 24H Change: -6.13%
Bitcoin is experiencing strong selling pressure, with the market showing significant weakness.
🔴 Resistance: $67,861 🟢 Support: $65,360 🎯 Next Support: $64,864
Market Outlook: Bearish
⚠️ Bitcoin needs to recover key resistance levels to show signs of strength. Watch support closely and manage your risk.
{spot}(BTCUSDT)
#BTC #Bitcoin #CryptoAnalysis #BinanceSquare
$BTC ₿ BTC MARKET UPDATE | 15 NOVEMBER 2026
💰 Current BTC Price: $64,458.18 📉 24H Change: -6.13%
Bitcoin is experiencing strong selling pressure, with the market showing significant weakness.
🔴 Resistance: $67,861 🟢 Support: $65,360 🎯 Next Support: $64,864
Market Outlook: Bearish
⚠️ Bitcoin needs to recover key resistance levels to show signs of strength. Watch support closely and manage your risk.
#BTC #Bitcoin #CryptoAnalysis #BinanceSquare
💰 Current BTC Price: $64,458.18 📉 24H Change: -6.13%
Bitcoin is experiencing strong selling pressure, with the market showing significant weakness.
🔴 Resistance: $67,861 🟢 Support: $65,360 🎯 Next Support: $64,864
Market Outlook: Bearish
⚠️ Bitcoin needs to recover key resistance levels to show signs of strength. Watch support closely and manage your risk.
#BTC #Bitcoin #CryptoAnalysis #BinanceSquare
4
·
--
Bearish
127
·
--
Bearish
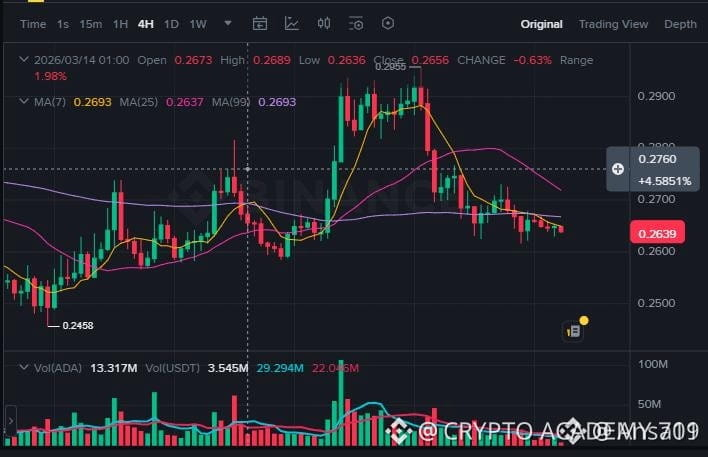
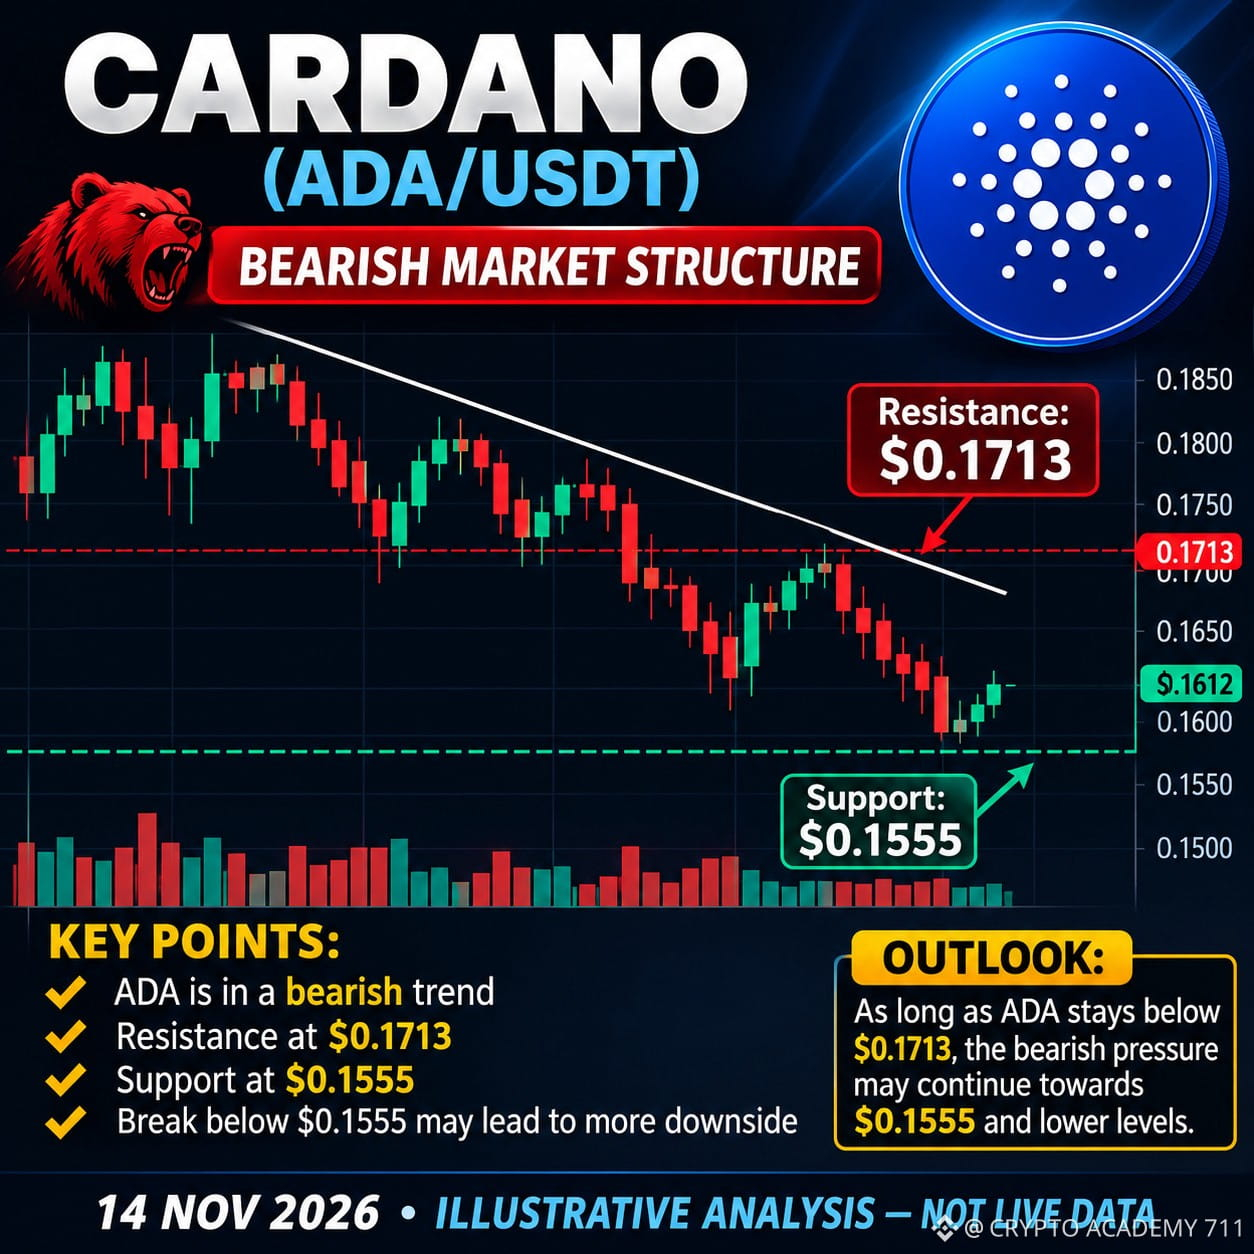
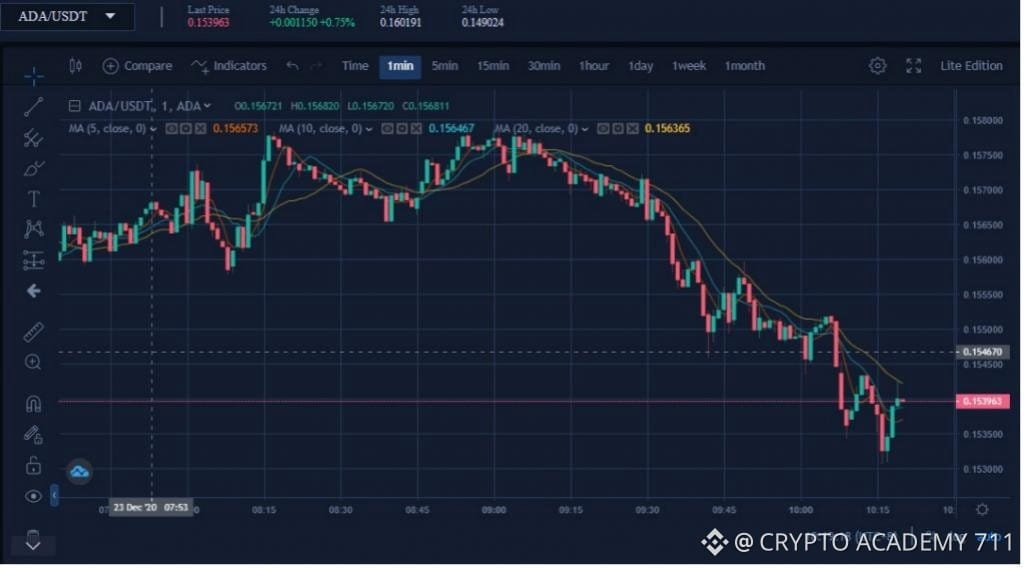
$ADA CARDANO (ADA) MARKET ANALYSIS | NOVEMBER 14, 2026
🔴 Market Sentiment: BEARISH
ADA is currently trading around $0.1612, facing significant selling pressure.
Key Technical Levels:
🟢 Support 1: $0.1555
🟢 Support 2: $0.1486
🔴 Resistance 1: $0.1713
🔴 Resistance 2: $0.1785
Technical Outlook:
• RSI (14): 25.3 — Oversold territory.
• Daily trend: Bearish.
• 4H trend: Bearish.
• Sellers remain in control.
• A breakdown below $0.1555 could trigger further downside.
Bullish Scenario 🟢
A strong recovery above $0.1713 could open the door toward $0.1785.
Bearish Scenario 🔴
If ADA fails to hold $0.1555, further downside pressure may develop.
My View: ADA remains bearish until buyers reclaim the $0.1713 resistance with strong volume. Oversold conditions could trigger a temporary bounce, so watch price action carefully.
⚠️ Trade with proper risk management. This is technical analysis, not financial advice.
{spot}(ADAUSDT)
#ADA #Cardano #CryptoAnalysis #BinanceSquare #Trading
$ADA CARDANO (ADA) MARKET ANALYSIS | NOVEMBER 14, 2026
🔴 Market Sentiment: BEARISH
ADA is currently trading around $0.1612, facing significant selling pressure.
Key Technical Levels:
🟢 Support 1: $0.1555
🟢 Support 2: $0.1486
🔴 Resistance 1: $0.1713
🔴 Resistance 2: $0.1785
Technical Outlook:
• RSI (14): 25.3 — Oversold territory.
• Daily trend: Bearish.
• 4H trend: Bearish.
• Sellers remain in control.
• A breakdown below $0.1555 could trigger further downside.
Bullish Scenario 🟢
A strong recovery above $0.1713 could open the door toward $0.1785.
Bearish Scenario 🔴
If ADA fails to hold $0.1555, further downside pressure may develop.
My View: ADA remains bearish until buyers reclaim the $0.1713 resistance with strong volume. Oversold conditions could trigger a temporary bounce, so watch price action carefully.
⚠️ Trade with proper risk management. This is technical analysis, not financial advice.
#ADA #Cardano #CryptoAnalysis #BinanceSquare #Trading
🔴 Market Sentiment: BEARISH
ADA is currently trading around $0.1612, facing significant selling pressure.
Key Technical Levels:
🟢 Support 1: $0.1555
🟢 Support 2: $0.1486
🔴 Resistance 1: $0.1713
🔴 Resistance 2: $0.1785
Technical Outlook:
• RSI (14): 25.3 — Oversold territory.
• Daily trend: Bearish.
• 4H trend: Bearish.
• Sellers remain in control.
• A breakdown below $0.1555 could trigger further downside.
Bullish Scenario 🟢
A strong recovery above $0.1713 could open the door toward $0.1785.
Bearish Scenario 🔴
If ADA fails to hold $0.1555, further downside pressure may develop.
My View: ADA remains bearish until buyers reclaim the $0.1713 resistance with strong volume. Oversold conditions could trigger a temporary bounce, so watch price action carefully.
⚠️ Trade with proper risk management. This is technical analysis, not financial advice.
#ADA #Cardano #CryptoAnalysis #BinanceSquare #Trading
89
·
--
Bearish
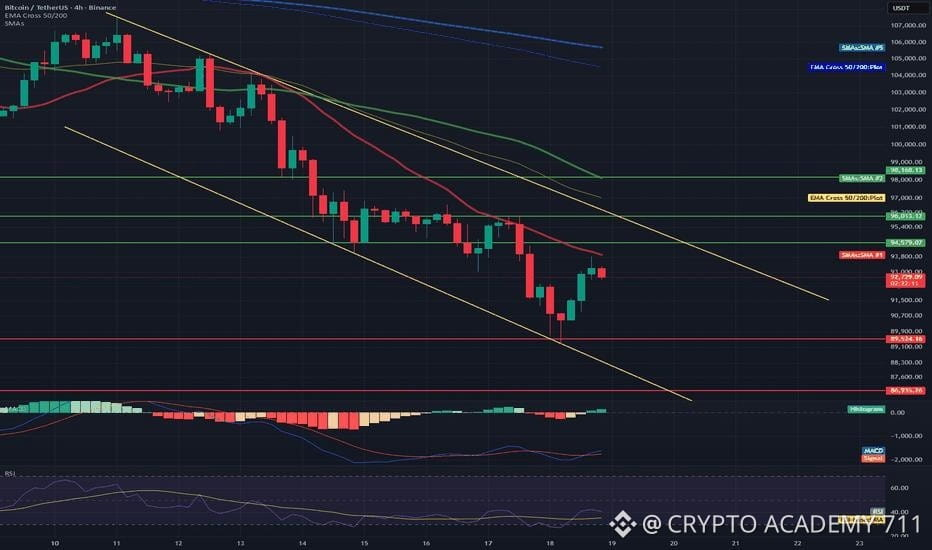
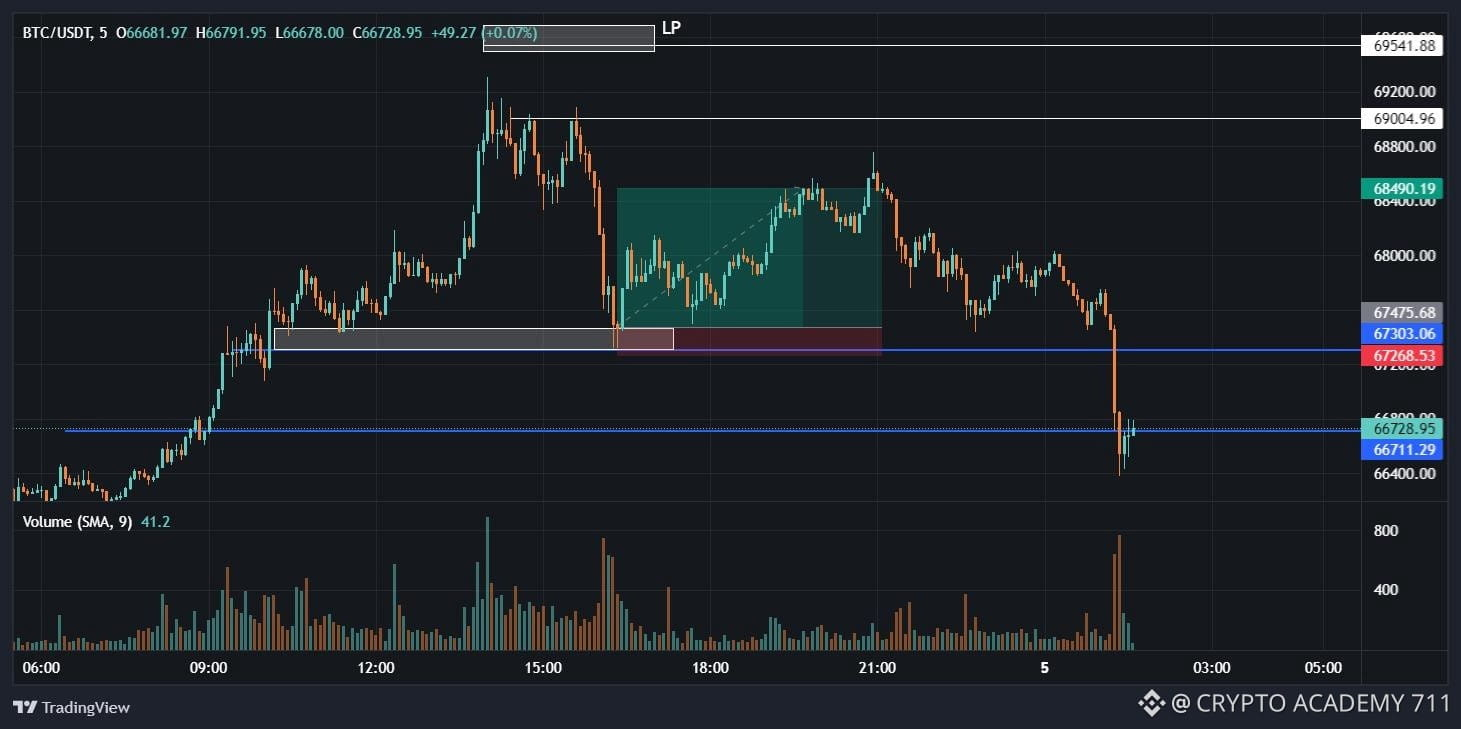
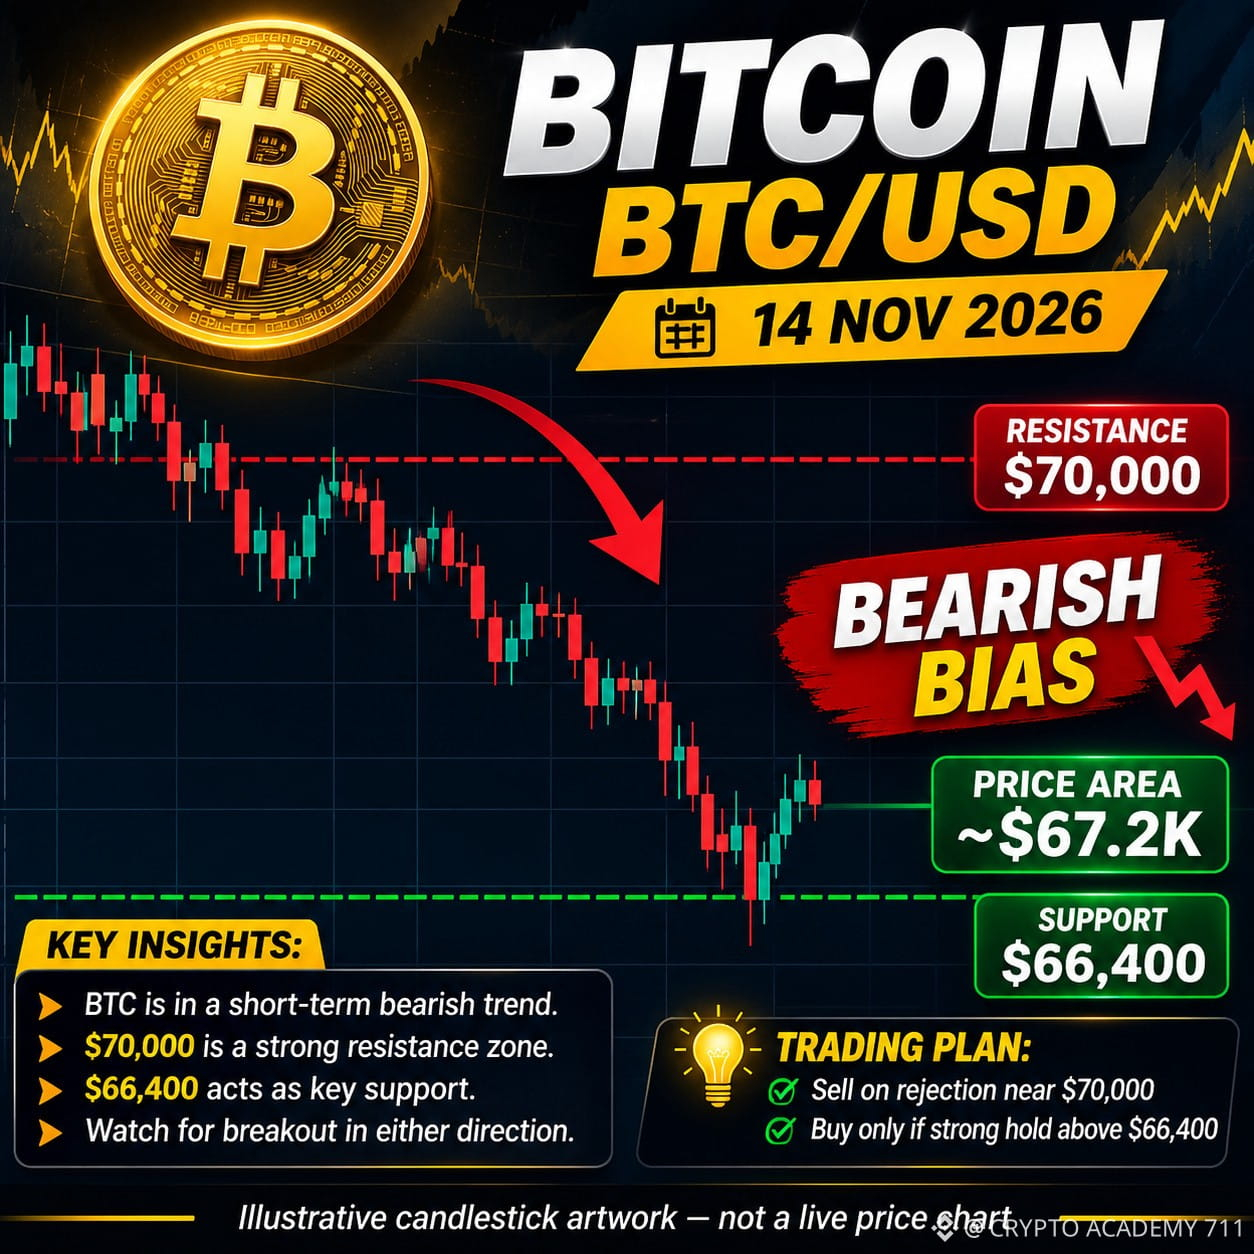
$BTC BITCOIN (BTC) MARKET UPDATE | NOVEMBER 14, 2026
Bitcoin is facing strong selling pressure, trading around $67,234, following a significant market correction.
📉 Market Overview: BTC remains under bearish pressure, with sellers controlling the short-term trend. Market sentiment is weak, and investors are watching important support levels.
🔴 Key Resistance Levels: • $70,000 • $73,958 • $75,500
🟢 Key Support Levels: • $66,397 • $62,000 • $60,000
📊 Technical Outlook: • Short-term trend: Bearish • Market momentum: Weak • A recovery above $70,000 could improve sentiment. • A breakdown below $66,397 could increase downside pressure.
🎯 Trading Strategy: Watch for a possible rejection near $70,000. A confirmed breakout above resistance could signal recovery. Avoid entering trades without confirmation.
⚠️ My Outlook: BTC remains bearish until buyers reclaim important resistance levels.
What do you think? Will Bitcoin recover above $70K or fall toward $60K?
{spot}(BTCUSDT)
#Bitcoin #BTC #CryptoAnalysis #BTCUSDT #BinanceSquare
$BTC BITCOIN (BTC) MARKET UPDATE | NOVEMBER 14, 2026
Bitcoin is facing strong selling pressure, trading around $67,234, following a significant market correction.
📉 Market Overview: BTC remains under bearish pressure, with sellers controlling the short-term trend. Market sentiment is weak, and investors are watching important support levels.
🔴 Key Resistance Levels: • $70,000 • $73,958 • $75,500
🟢 Key Support Levels: • $66,397 • $62,000 • $60,000
📊 Technical Outlook: • Short-term trend: Bearish • Market momentum: Weak • A recovery above $70,000 could improve sentiment. • A breakdown below $66,397 could increase downside pressure.
🎯 Trading Strategy: Watch for a possible rejection near $70,000. A confirmed breakout above resistance could signal recovery. Avoid entering trades without confirmation.
⚠️ My Outlook: BTC remains bearish until buyers reclaim important resistance levels.
What do you think? Will Bitcoin recover above $70K or fall toward $60K?
#Bitcoin #BTC #CryptoAnalysis #BTCUSDT #BinanceSquare
Bitcoin is facing strong selling pressure, trading around $67,234, following a significant market correction.
📉 Market Overview: BTC remains under bearish pressure, with sellers controlling the short-term trend. Market sentiment is weak, and investors are watching important support levels.
🔴 Key Resistance Levels: • $70,000 • $73,958 • $75,500
🟢 Key Support Levels: • $66,397 • $62,000 • $60,000
📊 Technical Outlook: • Short-term trend: Bearish • Market momentum: Weak • A recovery above $70,000 could improve sentiment. • A breakdown below $66,397 could increase downside pressure.
🎯 Trading Strategy: Watch for a possible rejection near $70,000. A confirmed breakout above resistance could signal recovery. Avoid entering trades without confirmation.
⚠️ My Outlook: BTC remains bearish until buyers reclaim important resistance levels.
What do you think? Will Bitcoin recover above $70K or fall toward $60K?
#Bitcoin #BTC #CryptoAnalysis #BTCUSDT #BinanceSquare
35
·
--
Bearish
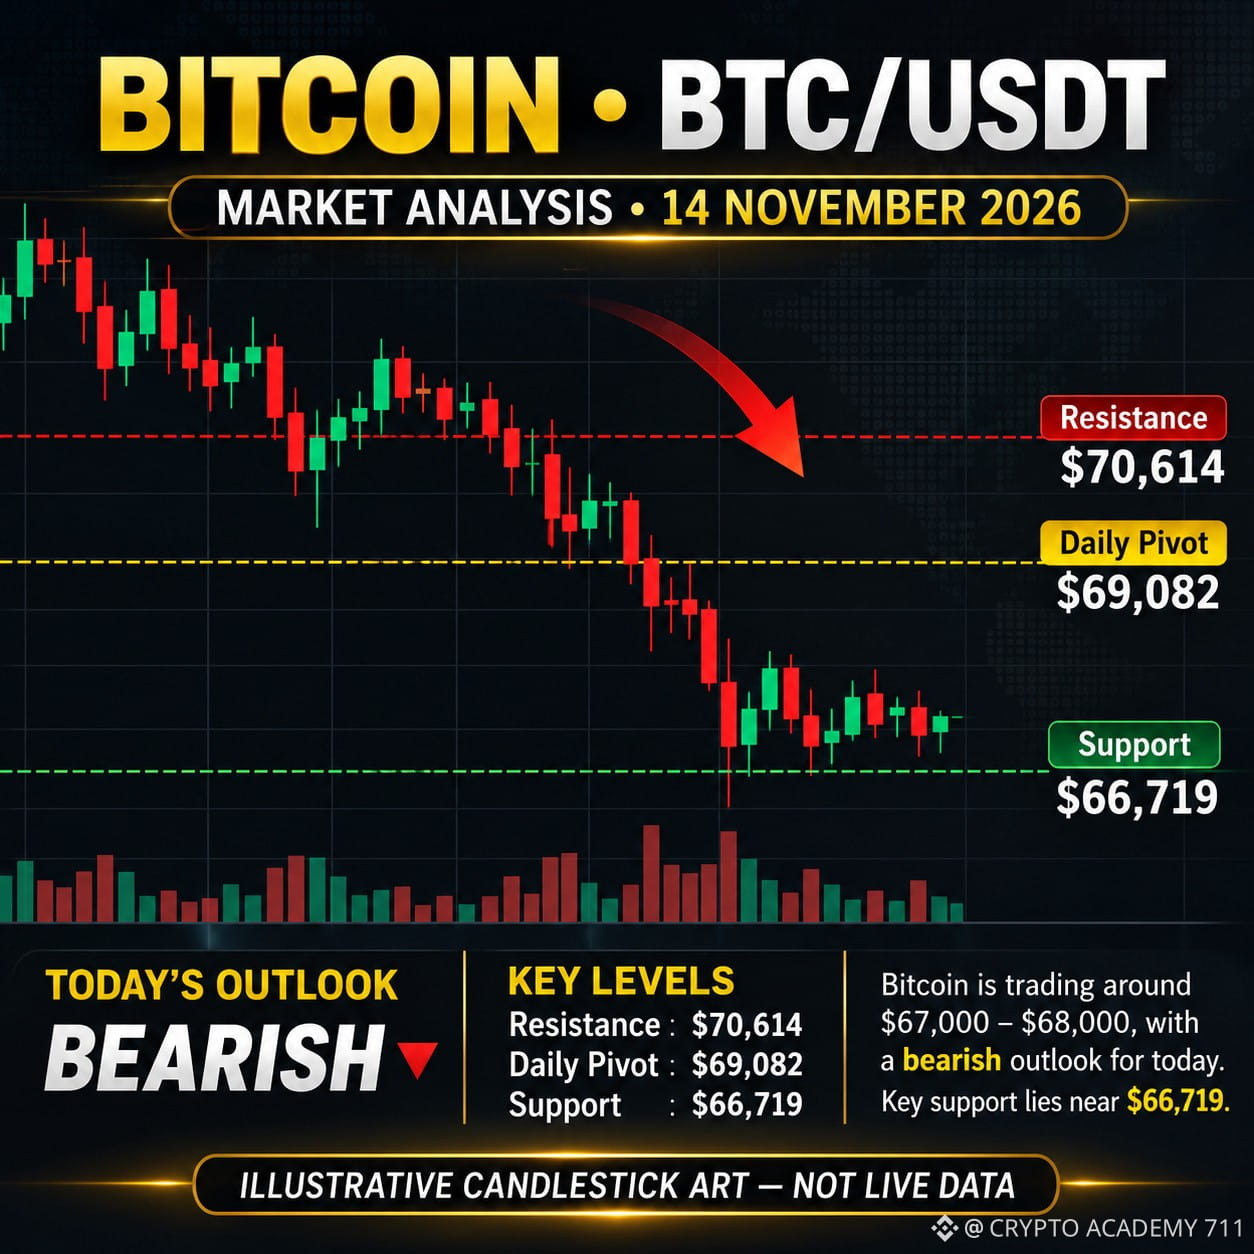
$BTC BITCOIN MARKET UPDATE | BTC/USDT
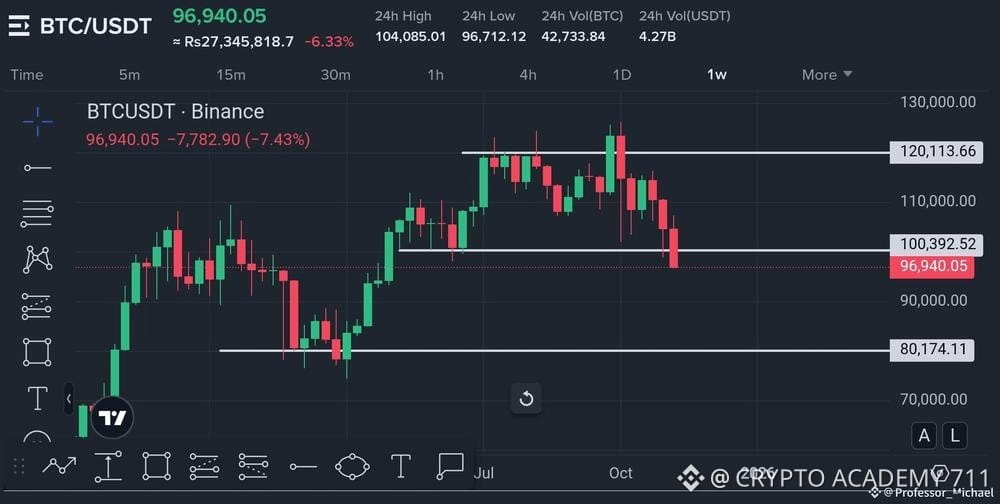
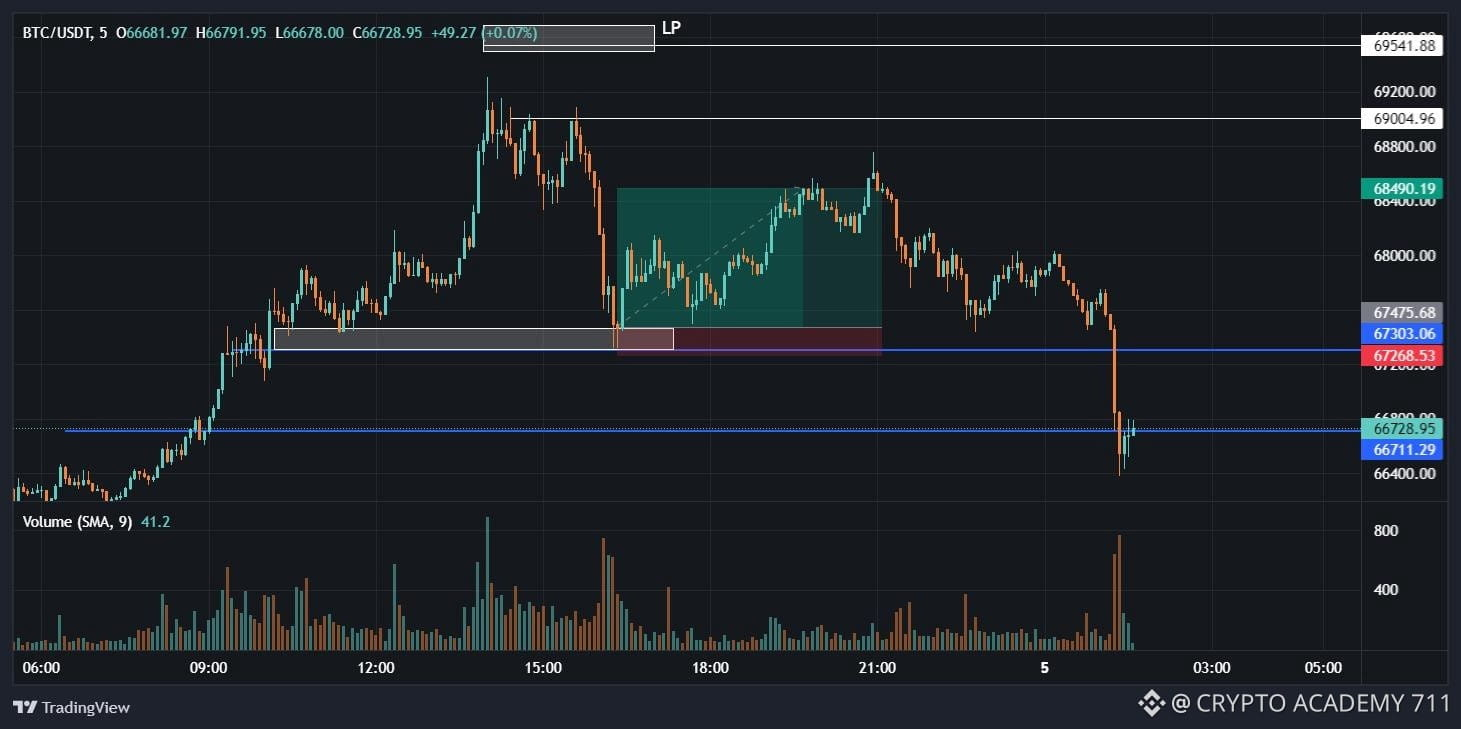
Bitcoin is facing strong selling pressure, trading around the $67K region after dropping more than 20% since October.
📉 WHAT'S DRIVING THE DECLINE?
Two major explanations are being discussed:
1️⃣ Anthropic IPO: Investors may be selling liquid assets like Bitcoin to raise cash for Anthropic's heavily oversubscribed IPO, reportedly receiving 6x demand.
2️⃣ AI-Trade Unwind: Broader uncertainty in technology stocks and the AI sector may be triggering risk-off sentiment across financial markets.
📊 ON-CHAIN SIGNAL
According to the Binance notification, less than 45% of Bitcoin's active supply is currently in profit. Historically, similar levels have sometimes appeared near correction lows.
KEY BTC LEVELS
🔴 Resistance: $68,700 – $69,000
🟡 Major Resistance: $70,200
🟢 Immediate Support: $66,400
🟢 Strong Support: $65,000
MARKET OUTLOOK
🔻 Short-term: Bearish
⚠️ A breakdown below $66,400 could increase selling pressure toward $65,000.
📈 A recovery above $69,000 could improve bullish momentum.
MY VIEW: Bitcoin is at a critical support zone. Watch price action and trading volume before taking any position.
{spot}(BTCUSDT)
#Bitcoin #BTC #CryptoMarket #BinanceSquareTalks #BTCUSDT
$BTC BITCOIN MARKET UPDATE | BTC/USDT
Bitcoin is facing strong selling pressure, trading around the $67K region after dropping more than 20% since October.
📉 WHAT'S DRIVING THE DECLINE?
Two major explanations are being discussed:
1️⃣ Anthropic IPO: Investors may be selling liquid assets like Bitcoin to raise cash for Anthropic's heavily oversubscribed IPO, reportedly receiving 6x demand.
2️⃣ AI-Trade Unwind: Broader uncertainty in technology stocks and the AI sector may be triggering risk-off sentiment across financial markets.
📊 ON-CHAIN SIGNAL
According to the Binance notification, less than 45% of Bitcoin's active supply is currently in profit. Historically, similar levels have sometimes appeared near correction lows.
KEY BTC LEVELS
🔴 Resistance: $68,700 – $69,000
🟡 Major Resistance: $70,200
🟢 Immediate Support: $66,400
🟢 Strong Support: $65,000
MARKET OUTLOOK
🔻 Short-term: Bearish
⚠️ A breakdown below $66,400 could increase selling pressure toward $65,000.
📈 A recovery above $69,000 could improve bullish momentum.
MY VIEW: Bitcoin is at a critical support zone. Watch price action and trading volume before taking any position.
#Bitcoin #BTC #CryptoMarket #BinanceSquareTalks #BTCUSDT
Bitcoin is facing strong selling pressure, trading around the $67K region after dropping more than 20% since October.
📉 WHAT'S DRIVING THE DECLINE?
Two major explanations are being discussed:
1️⃣ Anthropic IPO: Investors may be selling liquid assets like Bitcoin to raise cash for Anthropic's heavily oversubscribed IPO, reportedly receiving 6x demand.
2️⃣ AI-Trade Unwind: Broader uncertainty in technology stocks and the AI sector may be triggering risk-off sentiment across financial markets.
📊 ON-CHAIN SIGNAL
According to the Binance notification, less than 45% of Bitcoin's active supply is currently in profit. Historically, similar levels have sometimes appeared near correction lows.
KEY BTC LEVELS
🔴 Resistance: $68,700 – $69,000
🟡 Major Resistance: $70,200
🟢 Immediate Support: $66,400
🟢 Strong Support: $65,000
MARKET OUTLOOK
🔻 Short-term: Bearish
⚠️ A breakdown below $66,400 could increase selling pressure toward $65,000.
📈 A recovery above $69,000 could improve bullish momentum.
MY VIEW: Bitcoin is at a critical support zone. Watch price action and trading volume before taking any position.
#Bitcoin #BTC #CryptoMarket #BinanceSquareTalks #BTCUSDT
2
61
·
--
Bearish
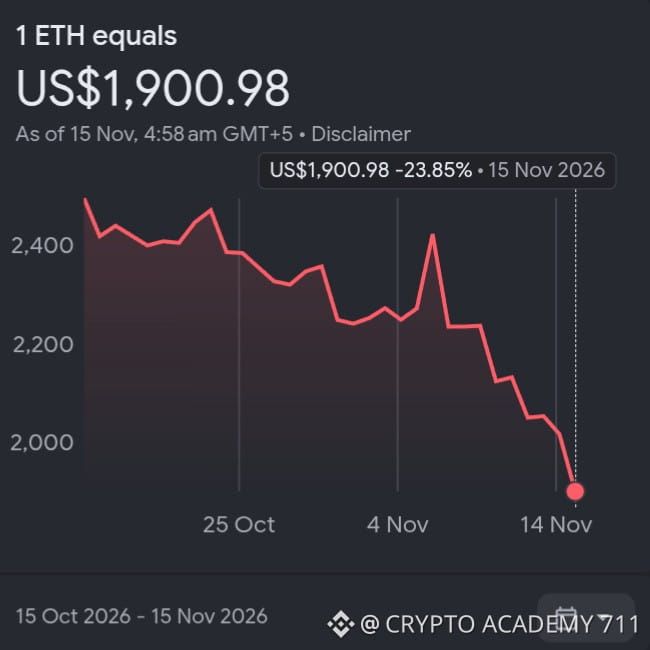
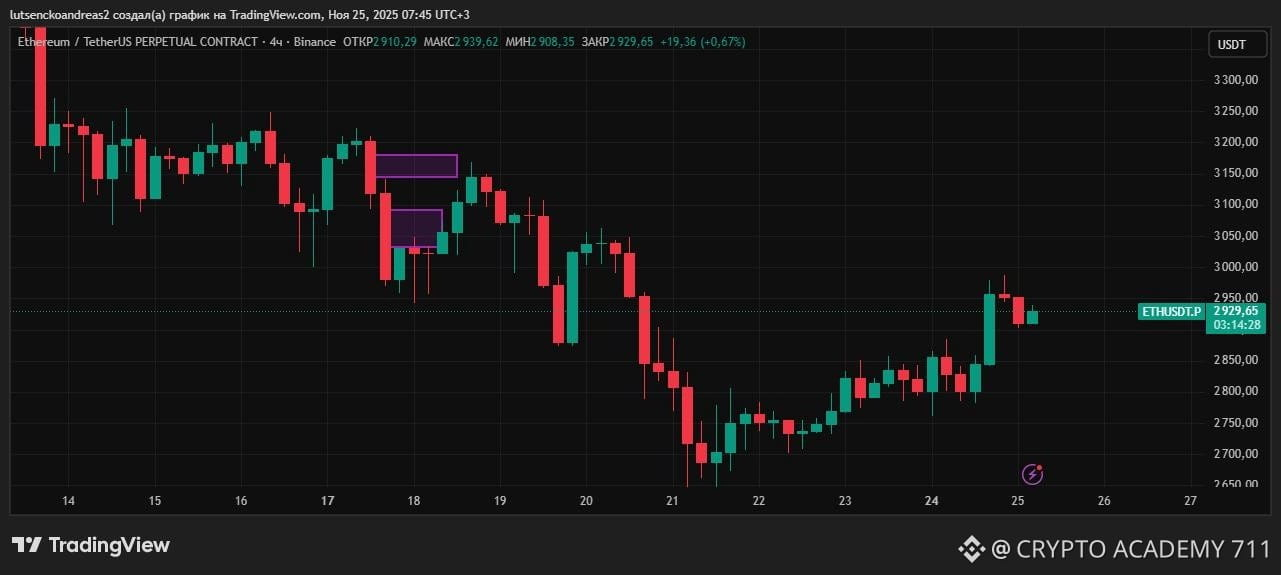
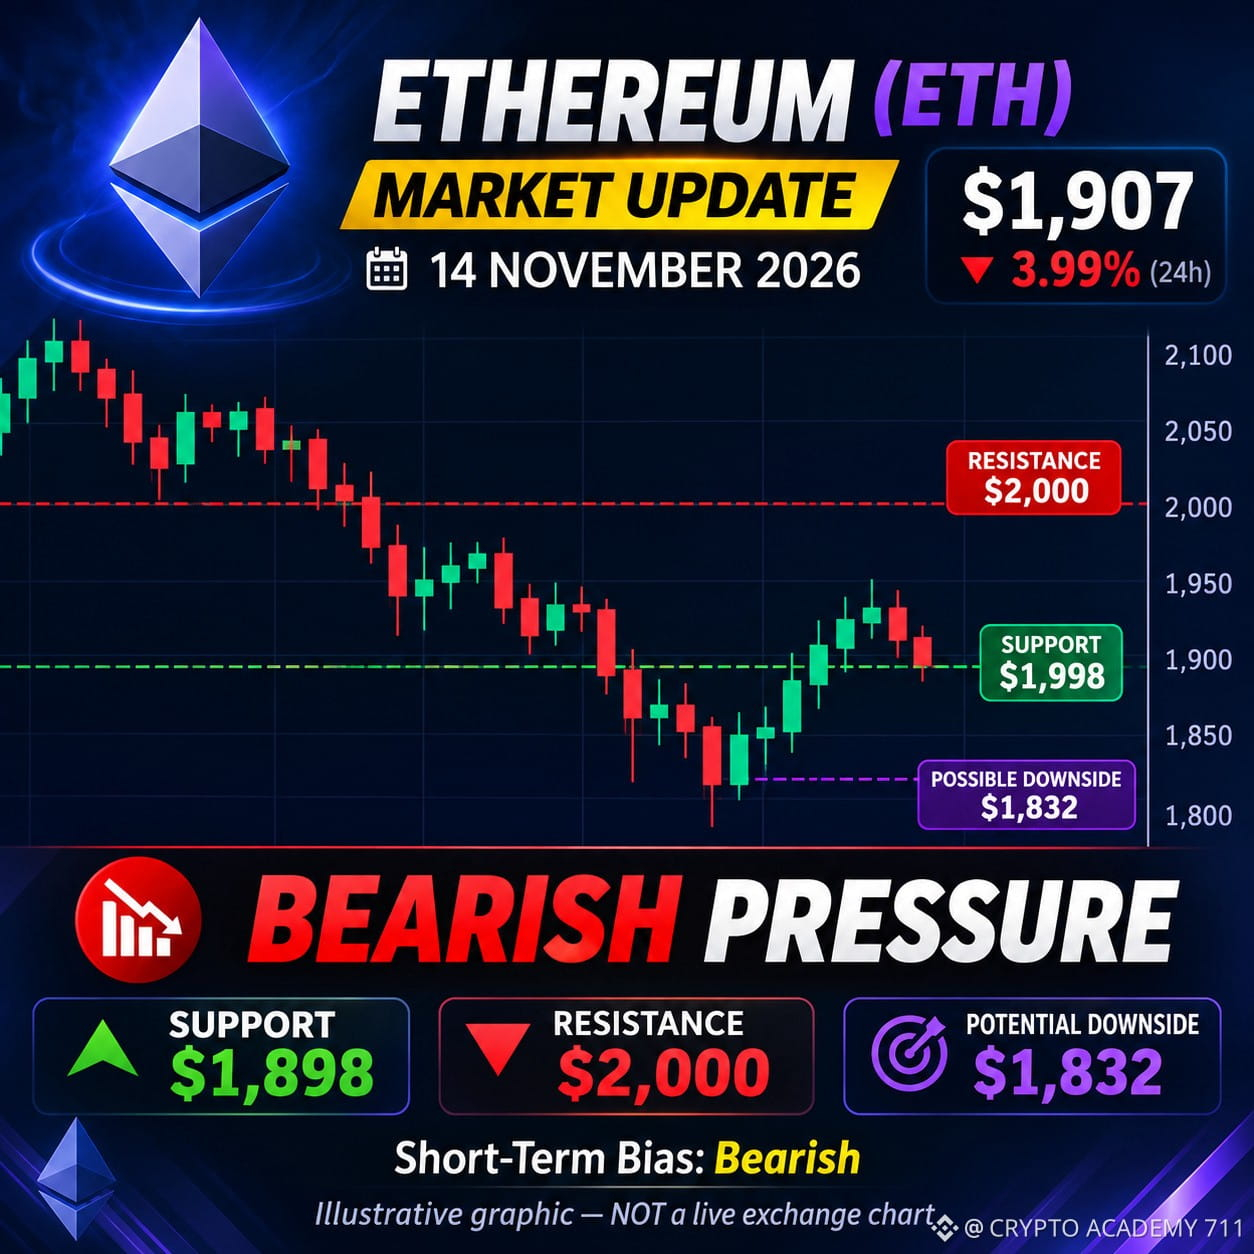
$ETH ETHEREUM (ETH) MARKET ANALYSIS | NOVEMBER 14, 2026
Ethereum is facing strong selling pressure as the broader crypto market remains weak.
💰 Current Price: ~$1,907
📉 Market Trend: Bearish
🔹 Support Levels: • $1,898 • $1,832
🔹 Resistance Levels: • $2,000 • $2,070
📈 Bullish Scenario: A strong breakout above $2,000 could open the door toward $2,070.
📉 Bearish Scenario: Losing $1,898 could expose ETH to further downside toward $1,832.
🎯 My Outlook: Cautious bearish until ETH reclaims the $2,000 resistance zone.
⚠️ Trade carefully. Always use proper risk management.
{spot}(ETHUSDT)
#Ethereum #ETH #CryptoAnalysis #BinanceSquare #Trading
$ETH ETHEREUM (ETH) MARKET ANALYSIS | NOVEMBER 14, 2026
Ethereum is facing strong selling pressure as the broader crypto market remains weak.
💰 Current Price: ~$1,907
📉 Market Trend: Bearish
🔹 Support Levels: • $1,898 • $1,832
🔹 Resistance Levels: • $2,000 • $2,070
📈 Bullish Scenario: A strong breakout above $2,000 could open the door toward $2,070.
📉 Bearish Scenario: Losing $1,898 could expose ETH to further downside toward $1,832.
🎯 My Outlook: Cautious bearish until ETH reclaims the $2,000 resistance zone.
⚠️ Trade carefully. Always use proper risk management.
#Ethereum #ETH #CryptoAnalysis #BinanceSquare #Trading
Ethereum is facing strong selling pressure as the broader crypto market remains weak.
💰 Current Price: ~$1,907
📉 Market Trend: Bearish
🔹 Support Levels: • $1,898 • $1,832
🔹 Resistance Levels: • $2,000 • $2,070
📈 Bullish Scenario: A strong breakout above $2,000 could open the door toward $2,070.
📉 Bearish Scenario: Losing $1,898 could expose ETH to further downside toward $1,832.
🎯 My Outlook: Cautious bearish until ETH reclaims the $2,000 resistance zone.
⚠️ Trade carefully. Always use proper risk management.
#Ethereum #ETH #CryptoAnalysis #BinanceSquare #Trading
63
·
--
Bearish
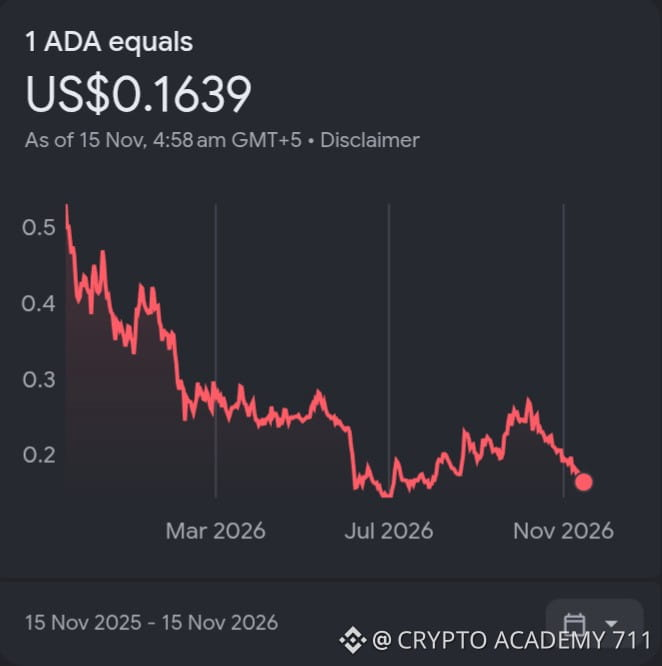
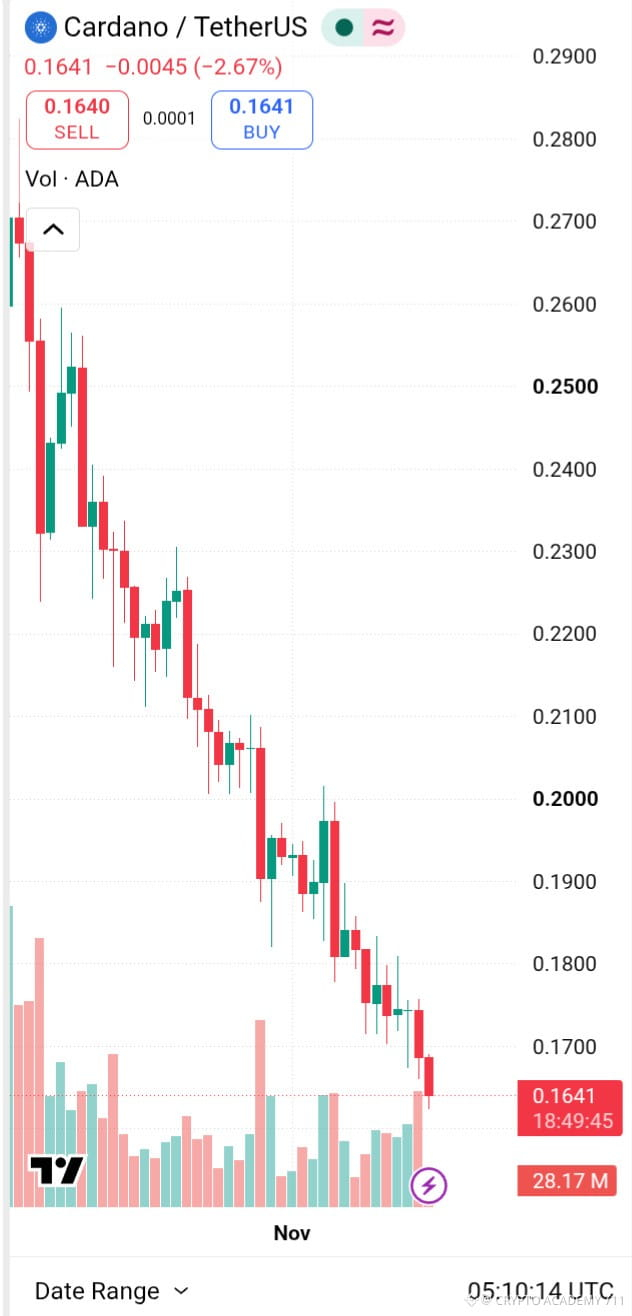
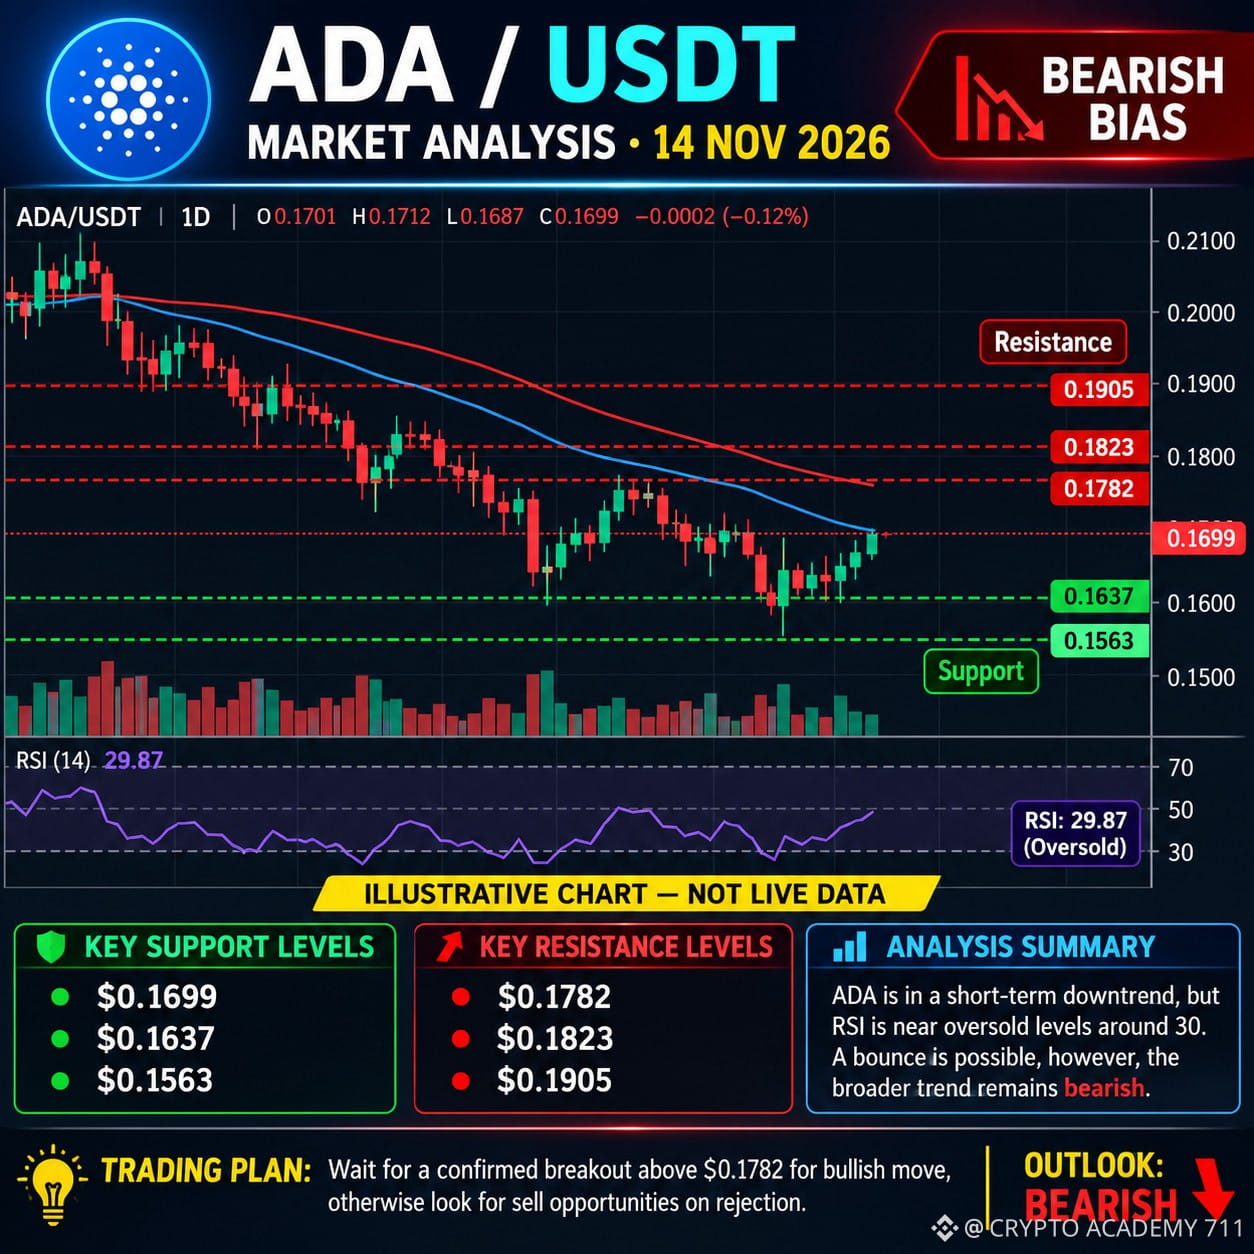
$ADA ADA/USDT – LATEST MARKET ANALYSIS
Date: November 14, 2026
🔴 Market Trend: Bearish
Cardano (ADA) is trading around $0.168–$0.171, showing continued selling pressure.
Key Support Levels:
$0.1699
$0.1637
$0.1563
Key Resistance Levels:
$0.1782
$0.1823
$0.1905
Technical Outlook:
RSI is around 29–30, indicating oversold conditions.
Overall momentum remains bearish.
Sellers currently have the advantage.
A recovery above $0.1782 could improve the short-term outlook.
Bullish Scenario 🟢 A strong breakout above $0.1782 could open the way towards $0.1823 and $0.1905.
Bearish Scenario 🔴 A breakdown below $0.1699 could expose $0.1637 and $0.1563.
My View: ADA remains under bearish pressure. Watch support carefully and wait for confirmation before entering a trade.
⚠️ Trade responsibly. Always use proper risk management.
{spot}(ADAUSDT)
#ADA #Cardano #CryptoAnalysis #BinanceSquare #TradingSignals
$ADA ADA/USDT – LATEST MARKET ANALYSIS
Date: November 14, 2026
🔴 Market Trend: Bearish
Cardano (ADA) is trading around $0.168–$0.171, showing continued selling pressure.
Key Support Levels:
$0.1699
$0.1637
$0.1563
Key Resistance Levels:
$0.1782
$0.1823
$0.1905
Technical Outlook:
RSI is around 29–30, indicating oversold conditions.
Overall momentum remains bearish.
Sellers currently have the advantage.
A recovery above $0.1782 could improve the short-term outlook.
Bullish Scenario 🟢 A strong breakout above $0.1782 could open the way towards $0.1823 and $0.1905.
Bearish Scenario 🔴 A breakdown below $0.1699 could expose $0.1637 and $0.1563.
My View: ADA remains under bearish pressure. Watch support carefully and wait for confirmation before entering a trade.
⚠️ Trade responsibly. Always use proper risk management.
#ADA #Cardano #CryptoAnalysis #BinanceSquare #TradingSignals
Date: November 14, 2026
🔴 Market Trend: Bearish
Cardano (ADA) is trading around $0.168–$0.171, showing continued selling pressure.
Key Support Levels:
$0.1699
$0.1637
$0.1563
Key Resistance Levels:
$0.1782
$0.1823
$0.1905
Technical Outlook:
RSI is around 29–30, indicating oversold conditions.
Overall momentum remains bearish.
Sellers currently have the advantage.
A recovery above $0.1782 could improve the short-term outlook.
Bullish Scenario 🟢 A strong breakout above $0.1782 could open the way towards $0.1823 and $0.1905.
Bearish Scenario 🔴 A breakdown below $0.1699 could expose $0.1637 and $0.1563.
My View: ADA remains under bearish pressure. Watch support carefully and wait for confirmation before entering a trade.
⚠️ Trade responsibly. Always use proper risk management.
#ADA #Cardano #CryptoAnalysis #BinanceSquare #TradingSignals
219
·
--
Bearish
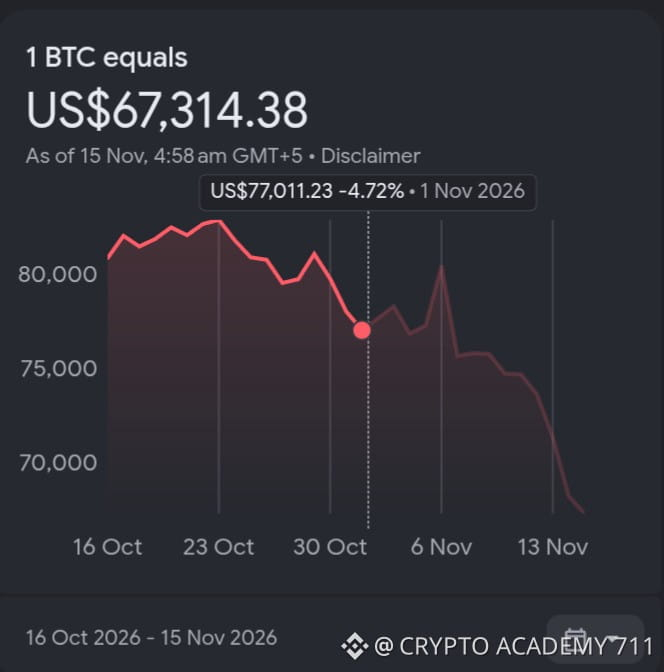
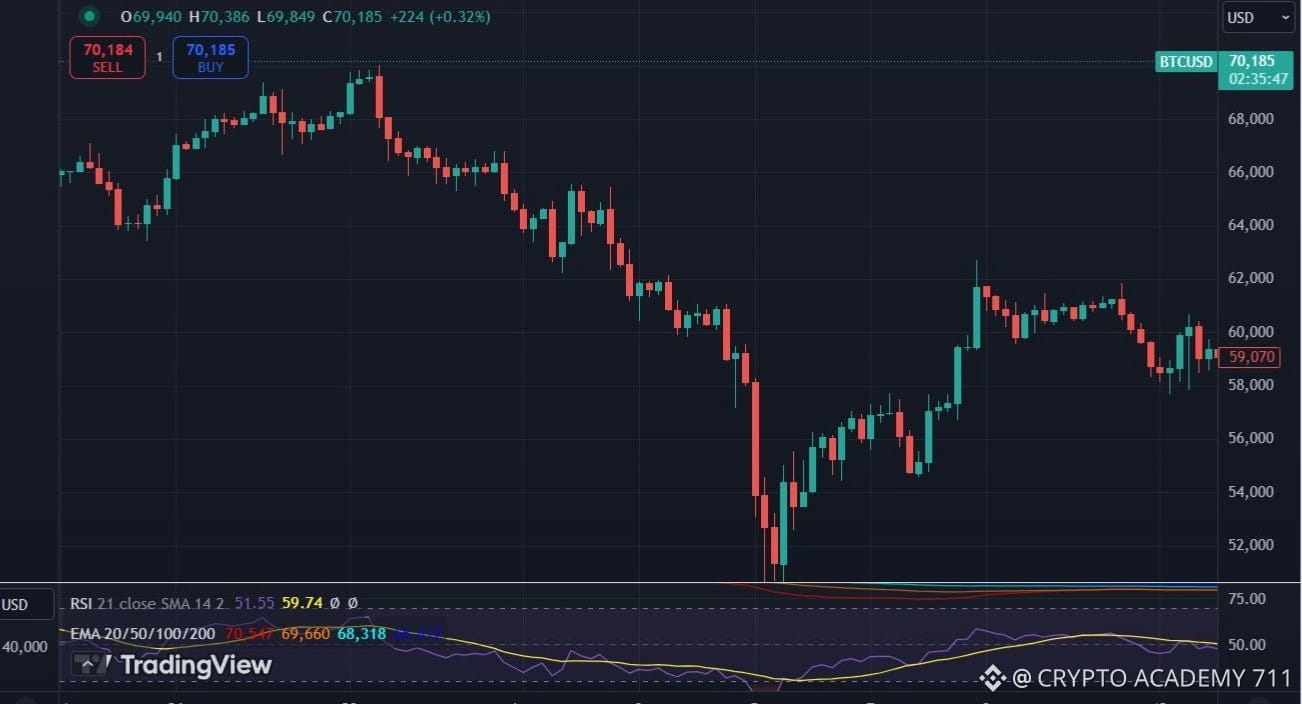
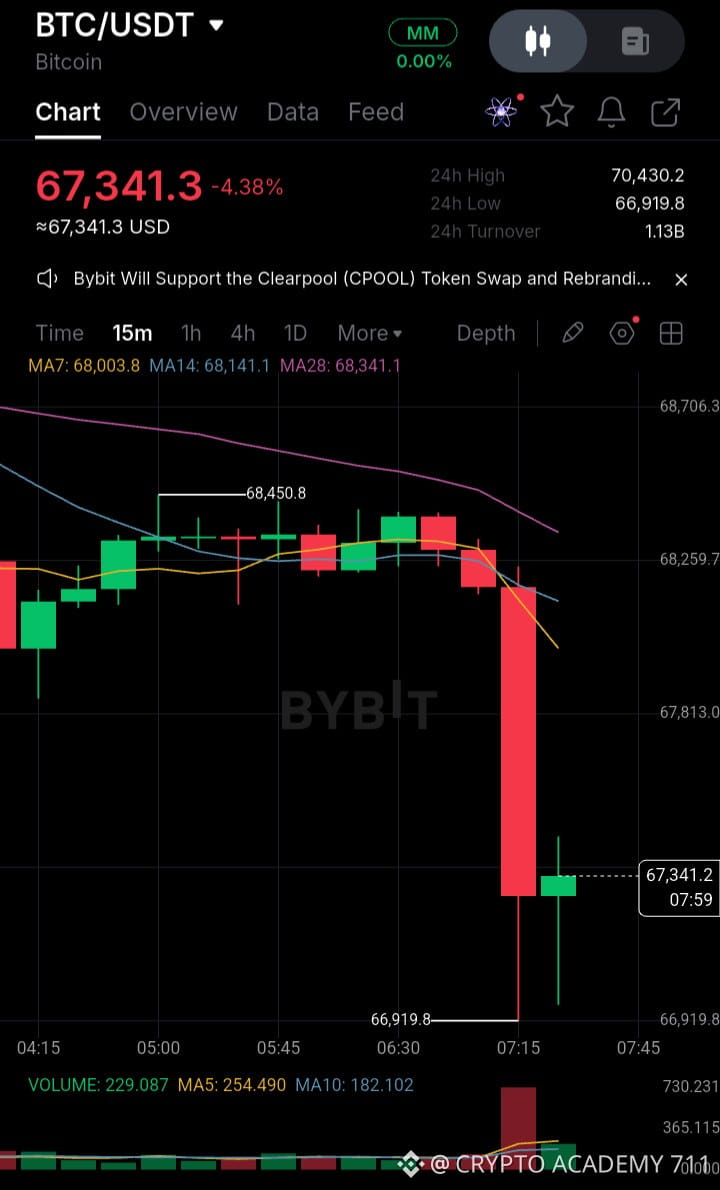
$BTC Market Analysis 📉 | November 14, 2026
Bitcoin is facing strong selling pressure after breaking below the important $70,000 psychological level.
Market Trend: Bearish
Key Support Levels:
- $68,263
- $65,000
- $62,500
Key Resistance Levels:
- $70,000
- $71,700
- $75,987
Bullish Scenario:
If BTC reclaims $70,000 and confirms a strong daily close above it, a recovery toward $71,700 could follow.
Bearish Scenario:
If BTC loses $68,263, further downside toward $65,000 becomes possible.
My Outlook: Sellers currently have control. Watch the $68,263 support and $70,000 resistance carefully before taking any position.
Trade smart. Manage your risk. Stay disciplined. 🚀
{spot}(BTCUSDT)
#Bitcoin #BTC #CryptoAnalysis #BinanceSquare #Trading
$BTC Market Analysis 📉 | November 14, 2026
Bitcoin is facing strong selling pressure after breaking below the important $70,000 psychological level.
Market Trend: Bearish
Key Support Levels:
- $68,263
- $65,000
- $62,500
Key Resistance Levels:
- $70,000
- $71,700
- $75,987
Bullish Scenario:
If BTC reclaims $70,000 and confirms a strong daily close above it, a recovery toward $71,700 could follow.
Bearish Scenario:
If BTC loses $68,263, further downside toward $65,000 becomes possible.
My Outlook: Sellers currently have control. Watch the $68,263 support and $70,000 resistance carefully before taking any position.
Trade smart. Manage your risk. Stay disciplined. 🚀
#Bitcoin #BTC #CryptoAnalysis #BinanceSquare #Trading
Bitcoin is facing strong selling pressure after breaking below the important $70,000 psychological level.
Market Trend: Bearish
Key Support Levels:
- $68,263
- $65,000
- $62,500
Key Resistance Levels:
- $70,000
- $71,700
- $75,987
Bullish Scenario:
If BTC reclaims $70,000 and confirms a strong daily close above it, a recovery toward $71,700 could follow.
Bearish Scenario:
If BTC loses $68,263, further downside toward $65,000 becomes possible.
My Outlook: Sellers currently have control. Watch the $68,263 support and $70,000 resistance carefully before taking any position.
Trade smart. Manage your risk. Stay disciplined. 🚀
#Bitcoin #BTC #CryptoAnalysis #BinanceSquare #Trading
86
·
--
Bearish
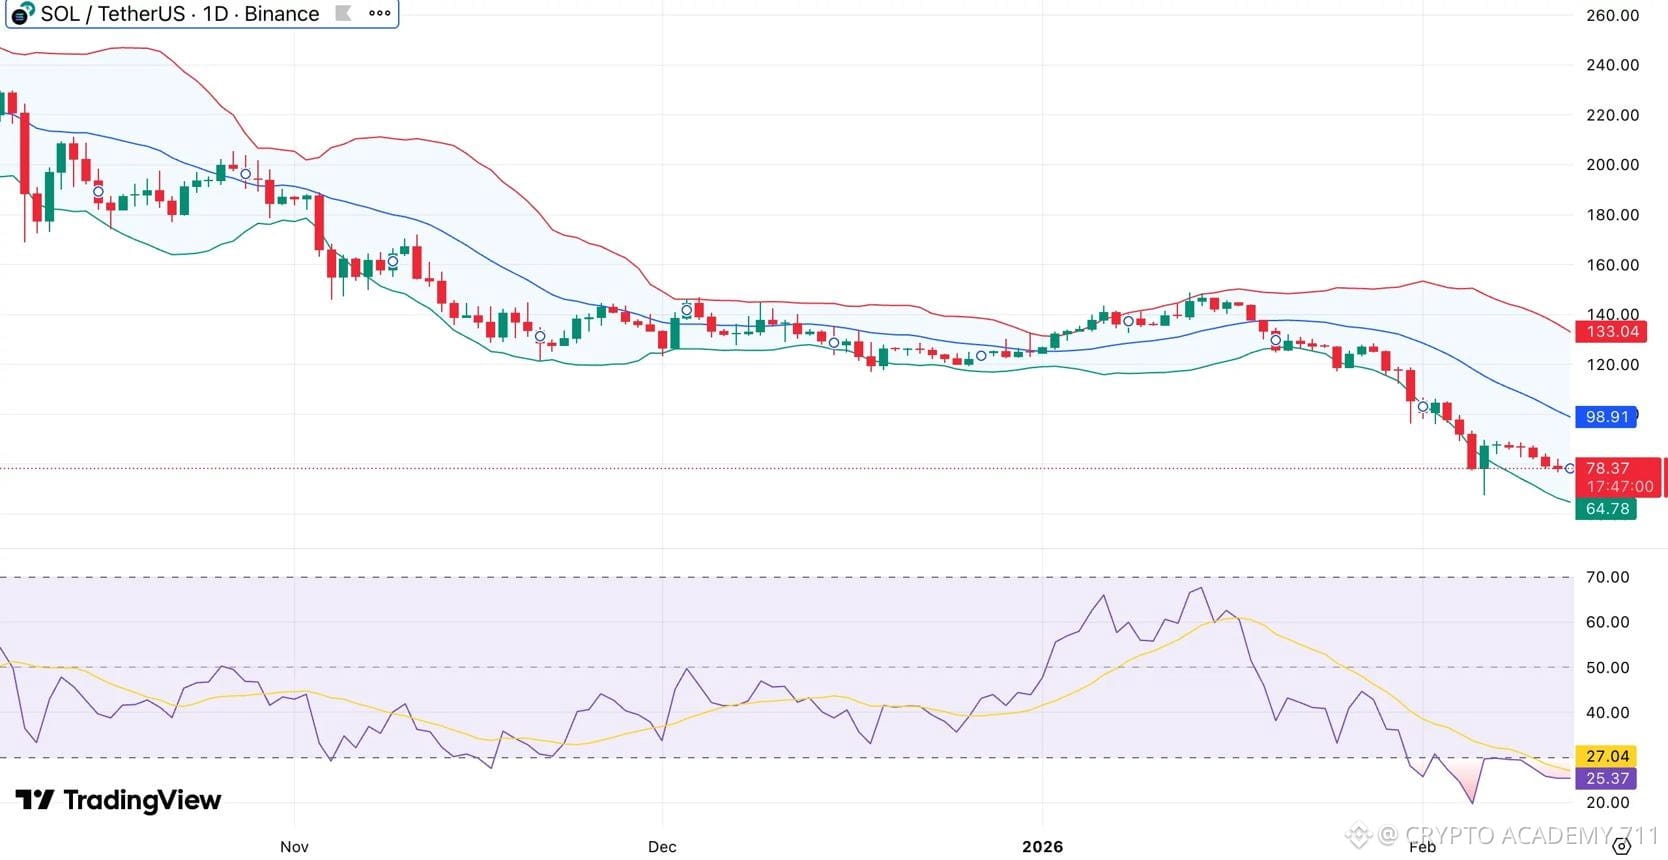
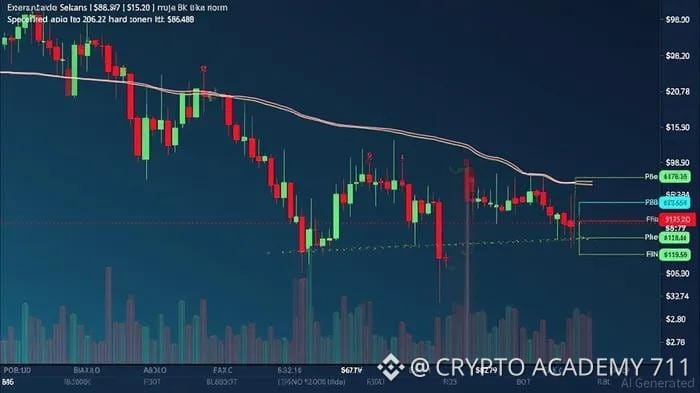
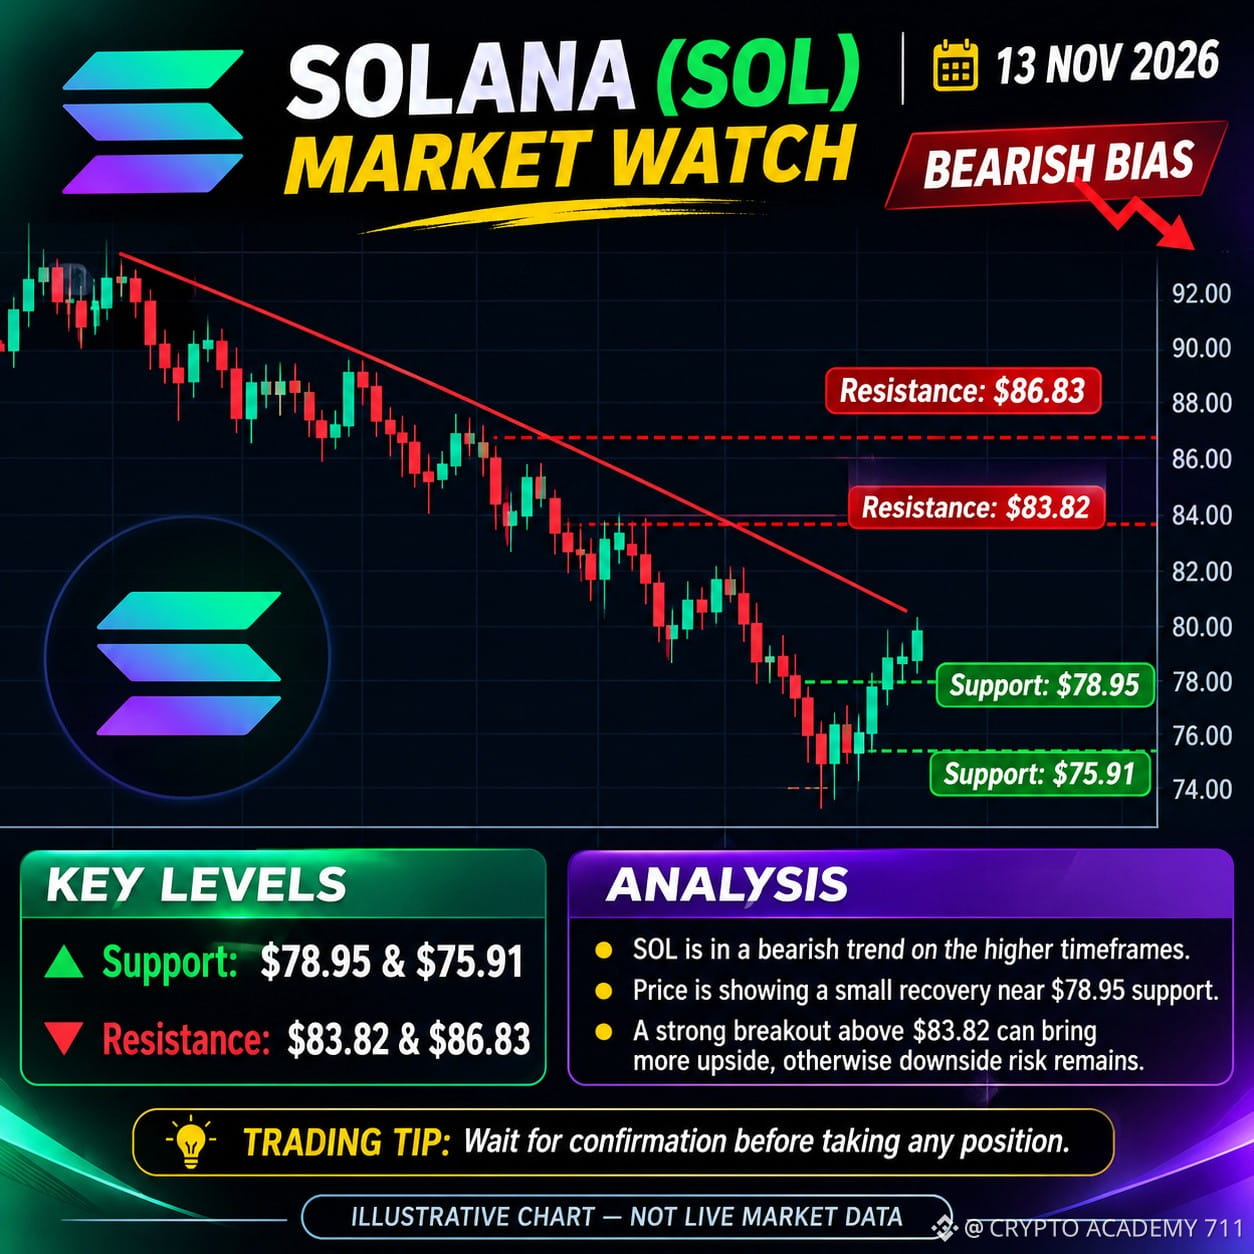
$SOL SOLANA (SOL) MARKET ANALYSIS – NOVEMBER 13, 2026
🔴 Market Trend: BEARISH
Solana is facing strong selling pressure, with SOL trading around the $79–$81 area. The broader market trend remains bearish, although a short-term recovery could develop near support.
🔍 Key Technical Levels
🟢 Support 1: $78.95
🟢 Support 2: $75.91
🔴 Resistance 1: $83.82
🔴 Resistance 2: $86.83
📈 Technical Outlook
• Daily RSI is around 20, indicating oversold conditions. • Sellers remain in control across major timeframes. • A breakout above $83.82 could support a recovery towards $86.83. • A breakdown below $78.95 could expose the $75.91 support.
🎯 Trading Strategy
Bullish scenario: A confirmed breakout above $83.82 could open the door for further recovery.
Bearish scenario: Failure to hold $78.95 could trigger another downward move.
⚠️ My View: SOL remains bearish until buyers reclaim important resistance levels. Watch volume and price action before entering any trade.
{spot}(SOLUSDT)
#SOL #Solana #CryptoAnalysis #TradingSignals #BinanceSquare
$SOL SOLANA (SOL) MARKET ANALYSIS – NOVEMBER 13, 2026
🔴 Market Trend: BEARISH
Solana is facing strong selling pressure, with SOL trading around the $79–$81 area. The broader market trend remains bearish, although a short-term recovery could develop near support.
🔍 Key Technical Levels
🟢 Support 1: $78.95
🟢 Support 2: $75.91
🔴 Resistance 1: $83.82
🔴 Resistance 2: $86.83
📈 Technical Outlook
• Daily RSI is around 20, indicating oversold conditions. • Sellers remain in control across major timeframes. • A breakout above $83.82 could support a recovery towards $86.83. • A breakdown below $78.95 could expose the $75.91 support.
🎯 Trading Strategy
Bullish scenario: A confirmed breakout above $83.82 could open the door for further recovery.
Bearish scenario: Failure to hold $78.95 could trigger another downward move.
⚠️ My View: SOL remains bearish until buyers reclaim important resistance levels. Watch volume and price action before entering any trade.
#SOL #Solana #CryptoAnalysis #TradingSignals #BinanceSquare
🔴 Market Trend: BEARISH
Solana is facing strong selling pressure, with SOL trading around the $79–$81 area. The broader market trend remains bearish, although a short-term recovery could develop near support.
🔍 Key Technical Levels
🟢 Support 1: $78.95
🟢 Support 2: $75.91
🔴 Resistance 1: $83.82
🔴 Resistance 2: $86.83
📈 Technical Outlook
• Daily RSI is around 20, indicating oversold conditions. • Sellers remain in control across major timeframes. • A breakout above $83.82 could support a recovery towards $86.83. • A breakdown below $78.95 could expose the $75.91 support.
🎯 Trading Strategy
Bullish scenario: A confirmed breakout above $83.82 could open the door for further recovery.
Bearish scenario: Failure to hold $78.95 could trigger another downward move.
⚠️ My View: SOL remains bearish until buyers reclaim important resistance levels. Watch volume and price action before entering any trade.
#SOL #Solana #CryptoAnalysis #TradingSignals #BinanceSquare
59
·
--
Bearish
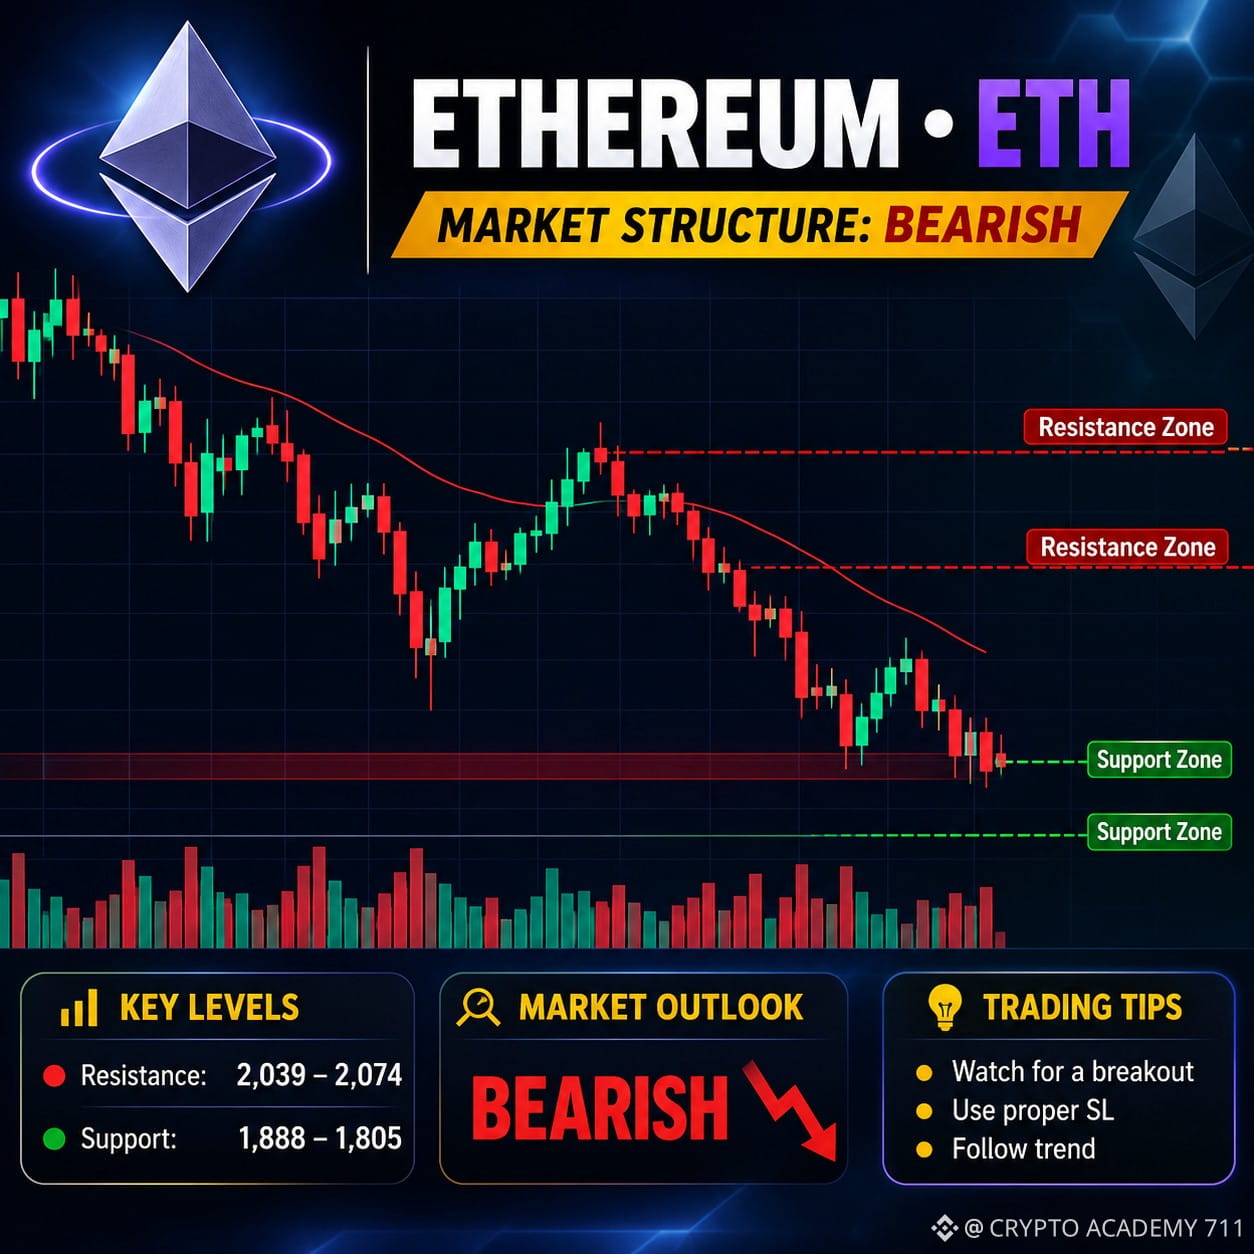
$ETH ETHEREUM (ETH) MARKET ANALYSIS
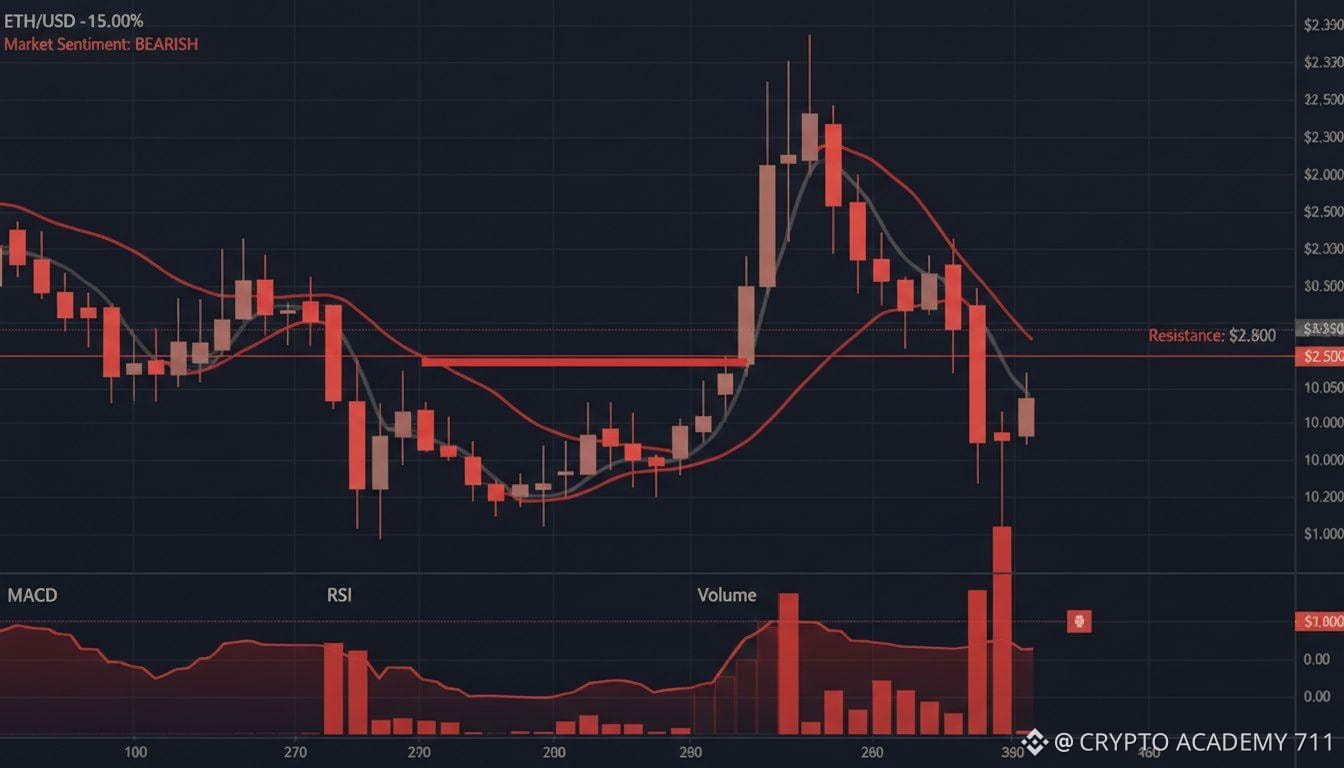
🔴 Current Market Trend: BEARISH
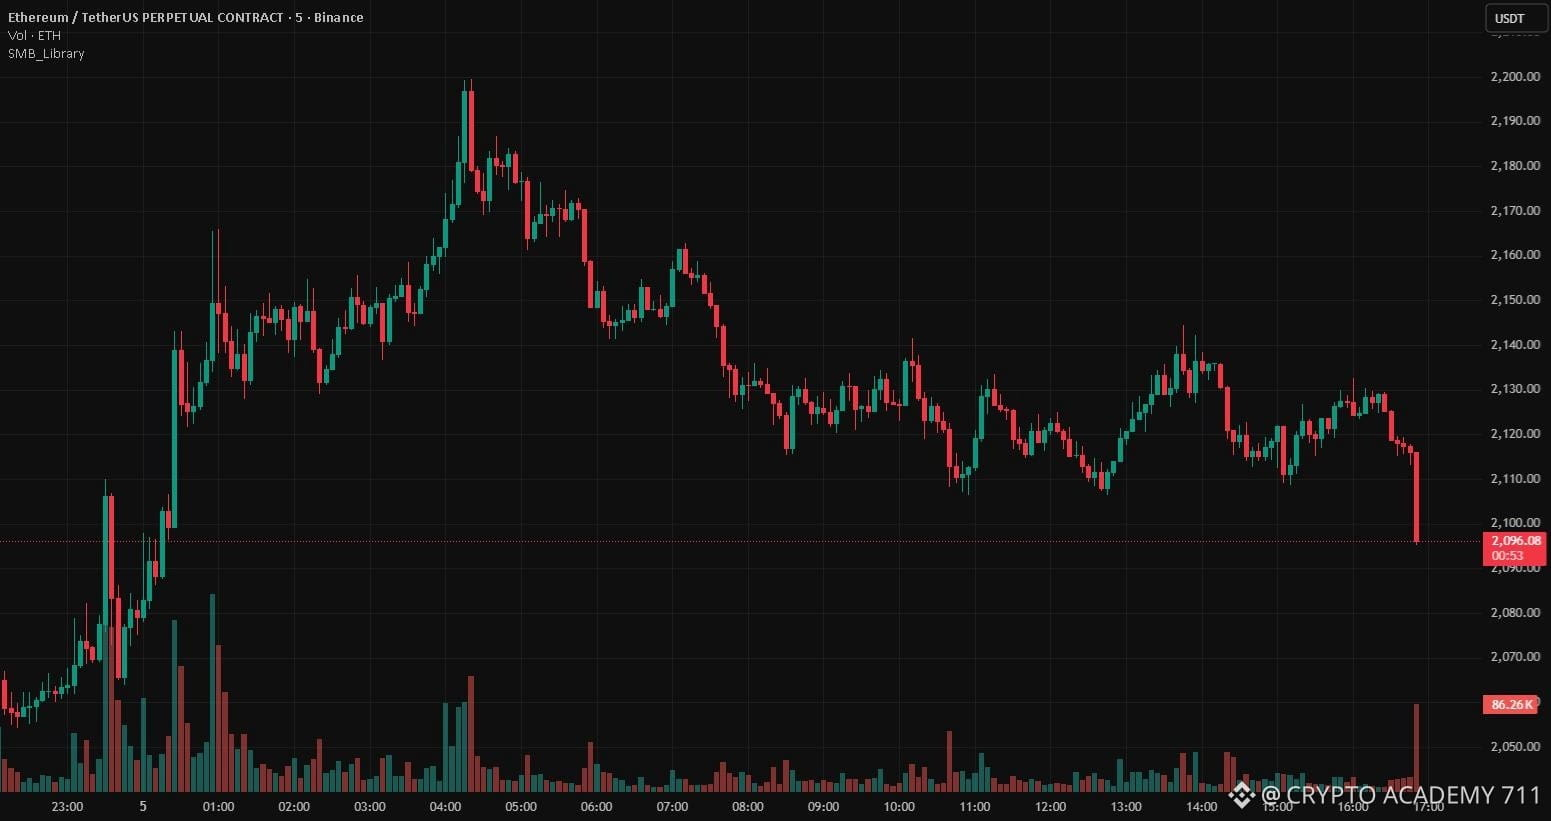
Ethereum is facing strong selling pressure as ETH struggles to maintain the $2,000 level.
Key Technical Levels:
- Resistance 1: $2,039
- Resistance 2: $2,074
- Support 1: $1,888
- Support 2: $1,805
Bullish Scenario 🚀
A strong breakout above $2,039 could open the way toward $2,074 and higher levels.
Bearish Scenario 📉
If ETH loses $1,888, further downside toward $1,805 becomes possible.
Technical Indicators:
- RSI: 24.5 (Oversold)
- Market Structure: Bearish
- Momentum: Weak
- Volatility: High
My Outlook: Cautious bearish until ETH reclaims $2,039.
⚠️ Watch key levels and manage risk carefully. This is market analysis, not financial advice.
{spot}(ETHUSDT)
#Ethereum #ETH #CryptoAnalysis #Trading #BinanceSquare
$ETH ETHEREUM (ETH) MARKET ANALYSIS
🔴 Current Market Trend: BEARISH
Ethereum is facing strong selling pressure as ETH struggles to maintain the $2,000 level.
Key Technical Levels:
- Resistance 1: $2,039
- Resistance 2: $2,074
- Support 1: $1,888
- Support 2: $1,805
Bullish Scenario 🚀
A strong breakout above $2,039 could open the way toward $2,074 and higher levels.
Bearish Scenario 📉
If ETH loses $1,888, further downside toward $1,805 becomes possible.
Technical Indicators:
- RSI: 24.5 (Oversold)
- Market Structure: Bearish
- Momentum: Weak
- Volatility: High
My Outlook: Cautious bearish until ETH reclaims $2,039.
⚠️ Watch key levels and manage risk carefully. This is market analysis, not financial advice.
#Ethereum #ETH #CryptoAnalysis #Trading #BinanceSquare
🔴 Current Market Trend: BEARISH
Ethereum is facing strong selling pressure as ETH struggles to maintain the $2,000 level.
Key Technical Levels:
- Resistance 1: $2,039
- Resistance 2: $2,074
- Support 1: $1,888
- Support 2: $1,805
Bullish Scenario 🚀
A strong breakout above $2,039 could open the way toward $2,074 and higher levels.
Bearish Scenario 📉
If ETH loses $1,888, further downside toward $1,805 becomes possible.
Technical Indicators:
- RSI: 24.5 (Oversold)
- Market Structure: Bearish
- Momentum: Weak
- Volatility: High
My Outlook: Cautious bearish until ETH reclaims $2,039.
⚠️ Watch key levels and manage risk carefully. This is market analysis, not financial advice.
#Ethereum #ETH #CryptoAnalysis #Trading #BinanceSquare
62
·
--
Bearish
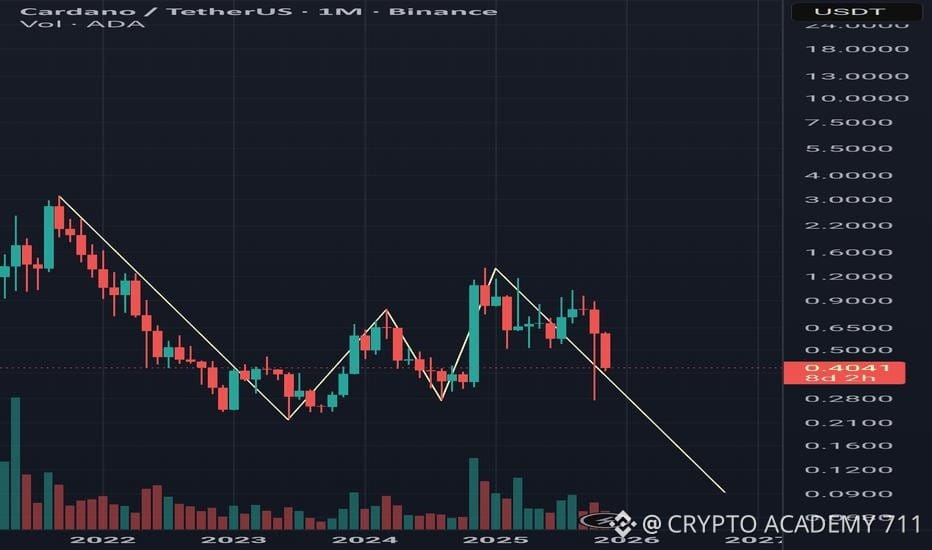
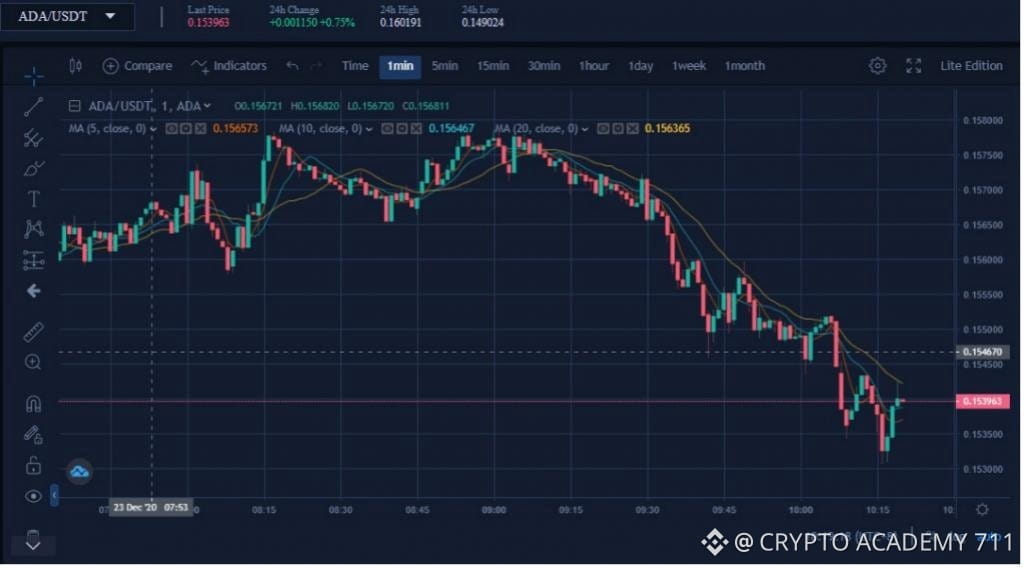
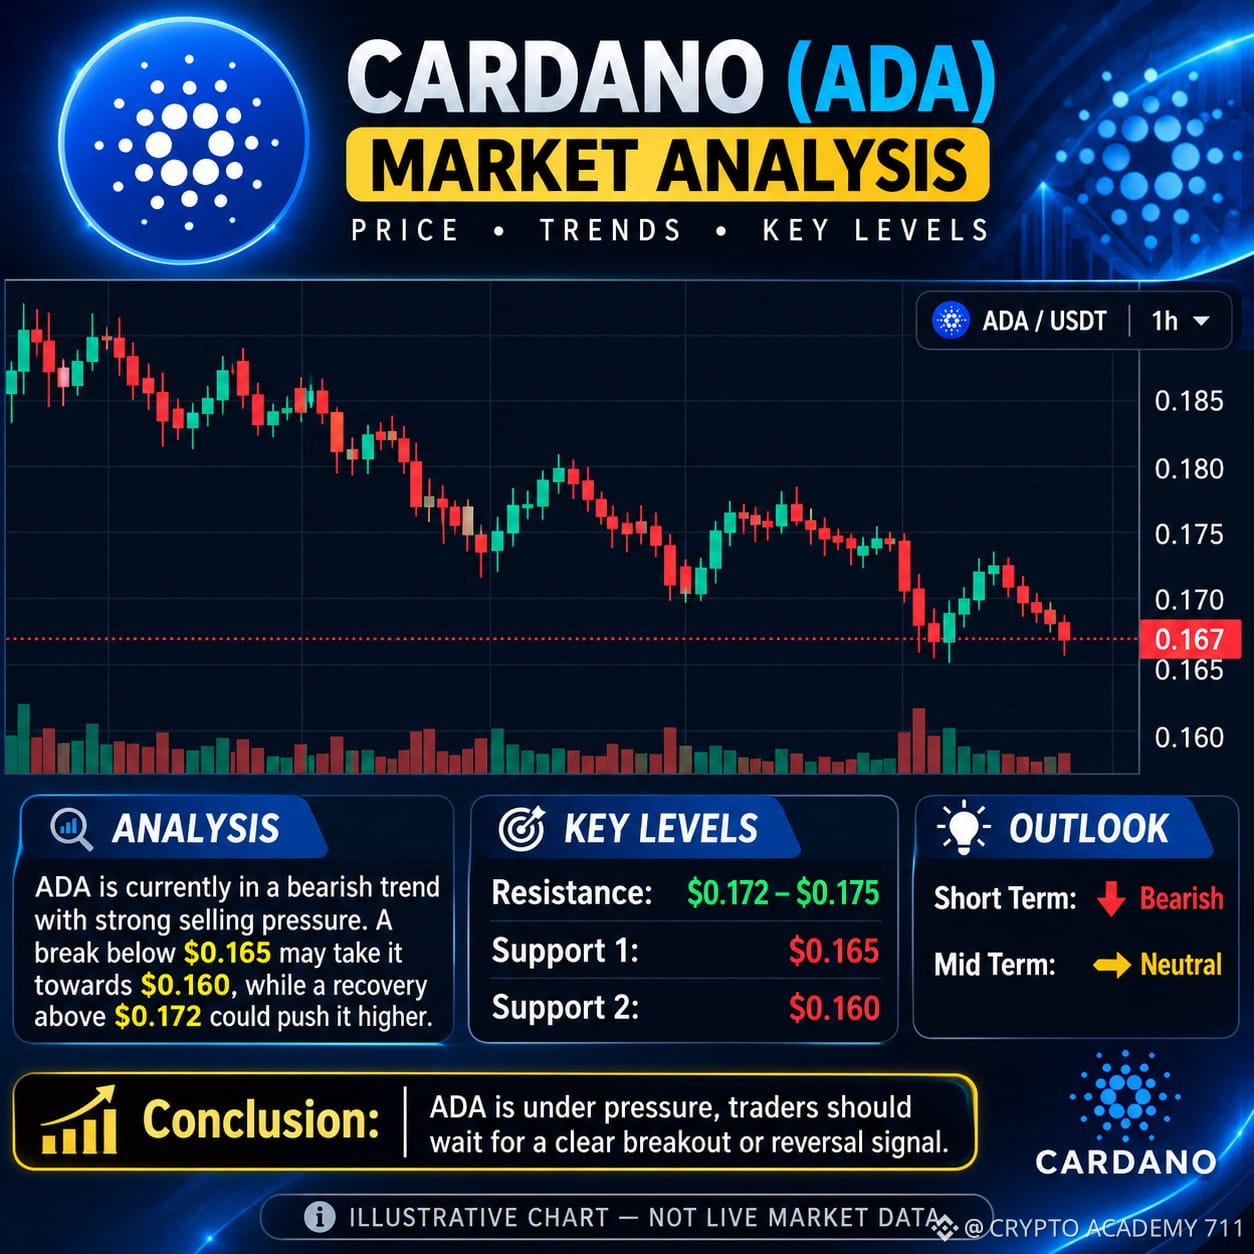
$ADA CARDANO (ADA) MARKET ANALYSIS | NOVEMBER 13, 2026
🔴 Current Price: Around $0.167–$0.169
Market Overview:
Cardano is facing selling pressure as the broader crypto market remains weak. ADA is trading near recent lows, and its short-term trend remains bearish.
Key Technical Levels:
🔹 Resistance 1: $0.1714
🔹 Resistance 2: $0.1750
🔹 Resistance 3: $0.1771
🟢 Support 1: $0.1609
🟢 Support 2: $0.1588
🟢 Support 3: $0.1567
Technical Outlook:
• RSI is near oversold territory.
• MACD indicates bearish momentum.
• A breakout above $0.1750 could support a recovery.
• A breakdown below $0.1609 could bring further downside.
My Market Prediction:
🔴 Short-term: Bearish
🟡 Medium-term: Cautious
⚠️ Traders should wait for confirmation before entering positions. Avoid emotional trading and manage risk carefully.
What do you think? Will ADA recover or fall further?
{spot}(ADAUSDT)
#ADA #Cardano #CryptoAnalysis #BinanceSquare #CryptoTrading
$ADA CARDANO (ADA) MARKET ANALYSIS | NOVEMBER 13, 2026
🔴 Current Price: Around $0.167–$0.169
Market Overview:
Cardano is facing selling pressure as the broader crypto market remains weak. ADA is trading near recent lows, and its short-term trend remains bearish.
Key Technical Levels:
🔹 Resistance 1: $0.1714
🔹 Resistance 2: $0.1750
🔹 Resistance 3: $0.1771
🟢 Support 1: $0.1609
🟢 Support 2: $0.1588
🟢 Support 3: $0.1567
Technical Outlook:
• RSI is near oversold territory.
• MACD indicates bearish momentum.
• A breakout above $0.1750 could support a recovery.
• A breakdown below $0.1609 could bring further downside.
My Market Prediction:
🔴 Short-term: Bearish
🟡 Medium-term: Cautious
⚠️ Traders should wait for confirmation before entering positions. Avoid emotional trading and manage risk carefully.
What do you think? Will ADA recover or fall further?
#ADA #Cardano #CryptoAnalysis #BinanceSquare #CryptoTrading
🔴 Current Price: Around $0.167–$0.169
Market Overview:
Cardano is facing selling pressure as the broader crypto market remains weak. ADA is trading near recent lows, and its short-term trend remains bearish.
Key Technical Levels:
🔹 Resistance 1: $0.1714
🔹 Resistance 2: $0.1750
🔹 Resistance 3: $0.1771
🟢 Support 1: $0.1609
🟢 Support 2: $0.1588
🟢 Support 3: $0.1567
Technical Outlook:
• RSI is near oversold territory.
• MACD indicates bearish momentum.
• A breakout above $0.1750 could support a recovery.
• A breakdown below $0.1609 could bring further downside.
My Market Prediction:
🔴 Short-term: Bearish
🟡 Medium-term: Cautious
⚠️ Traders should wait for confirmation before entering positions. Avoid emotional trading and manage risk carefully.
What do you think? Will ADA recover or fall further?
#ADA #Cardano #CryptoAnalysis #BinanceSquare #CryptoTrading
2
2
679
·
--
Bearish
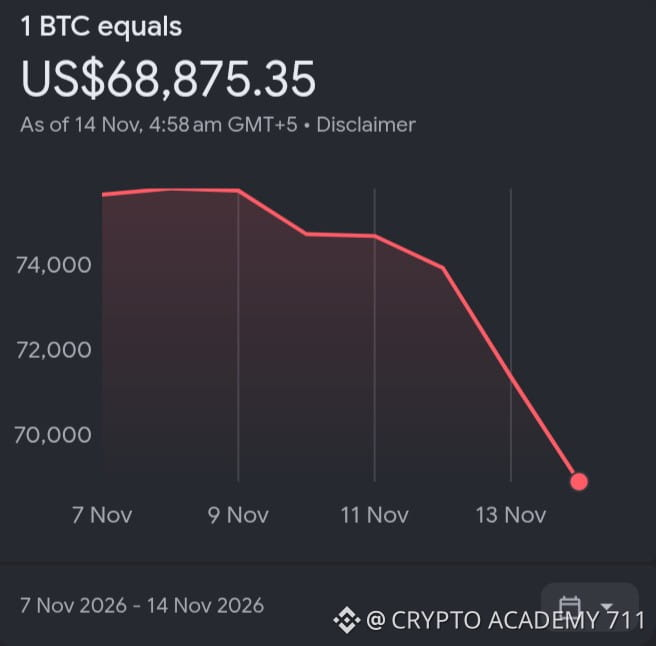
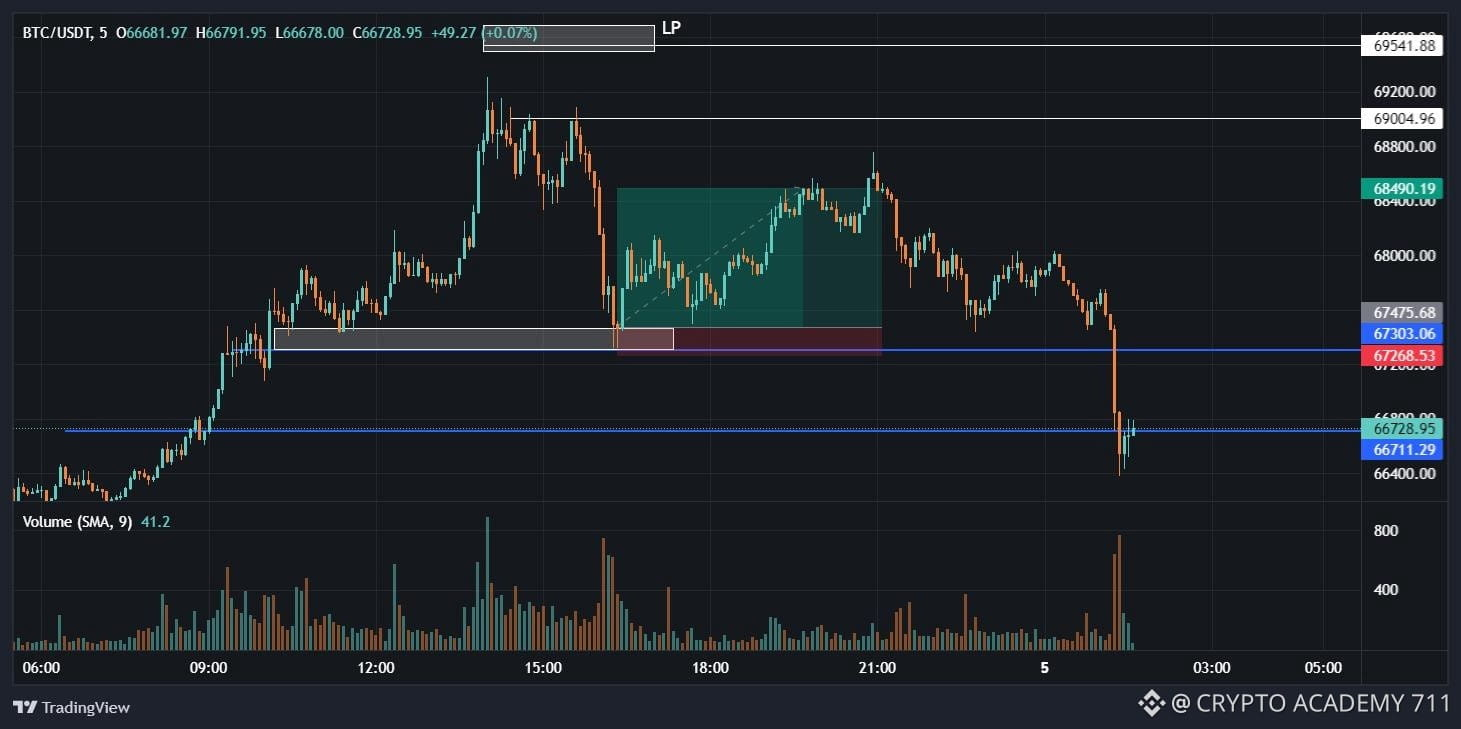
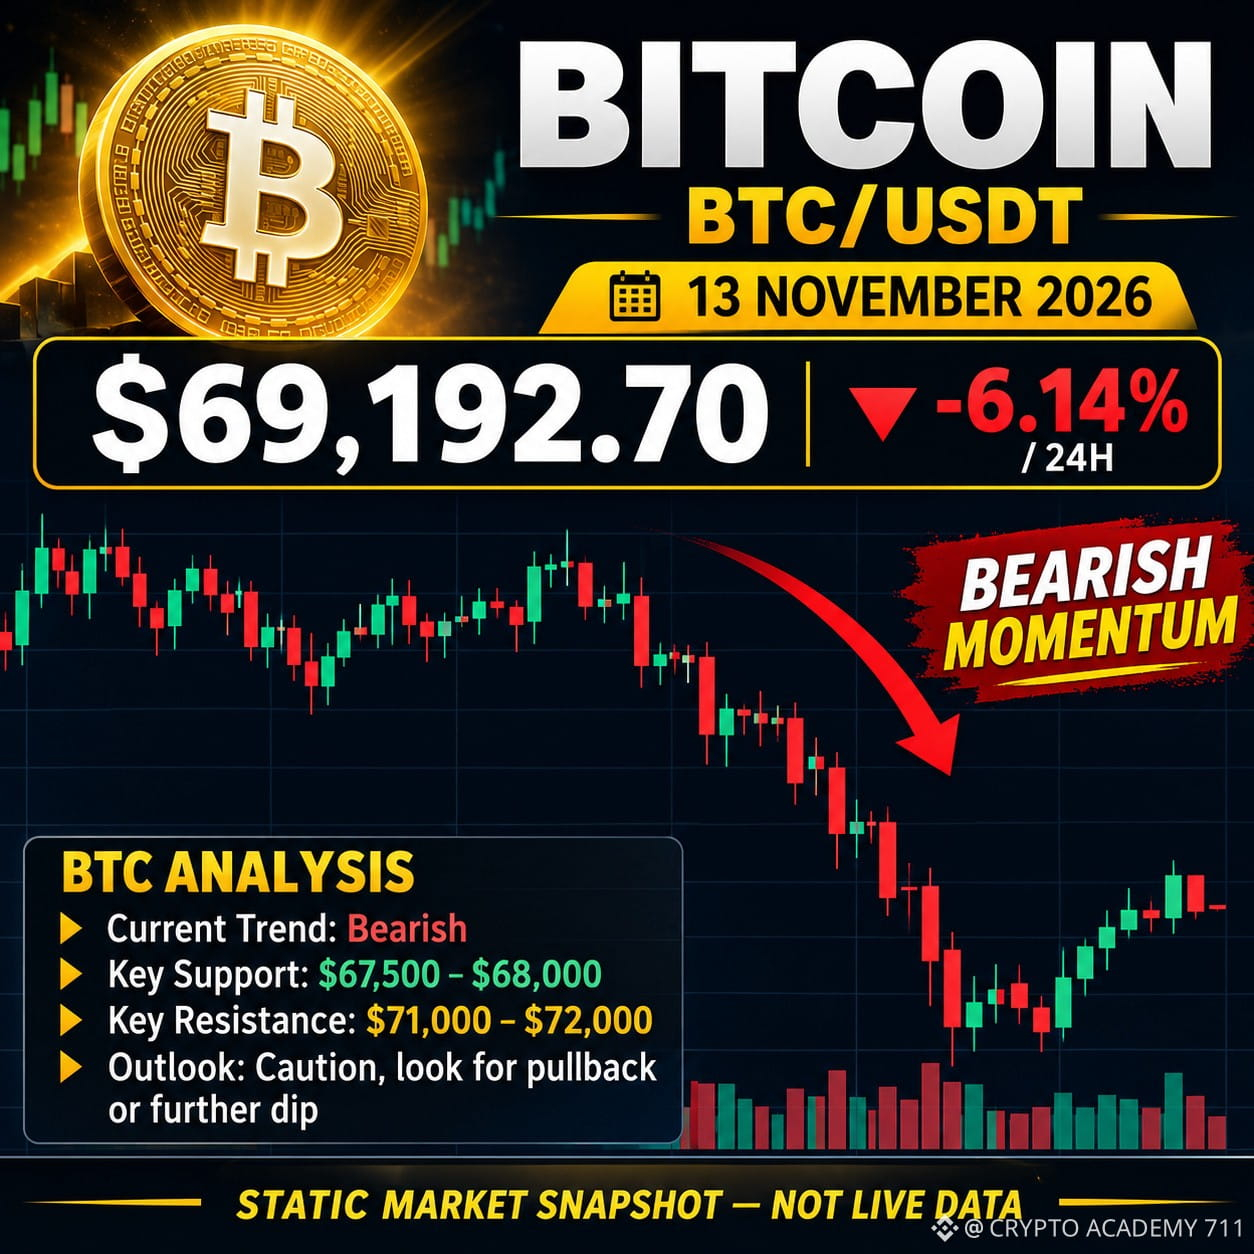
$BTC BITCOIN (BTC) MARKET ANALYSIS | NOVEMBER 13, 2026
Bitcoin is facing strong selling pressure as bearish momentum continues across the crypto market.
💰 Current Price: $69,192
📉 24H Change: -6.14%
🔴 Key Resistance: $73,255 – $73,437
🟢 Immediate Support: Around $68,900
📊 Market Outlook:
BTC remains bearish on the short-term 4H and daily charts.
🐻 Bearish Scenario: A breakdown below recent lows could trigger further downside.
🐂 Bullish Scenario: A strong recovery and breakout above resistance could improve market sentiment.
⚠️ My Strategy: Wait for confirmation before entering any trade. Manage risk carefully and avoid emotional decisions.
Bitcoin is at a critical level. Will buyers defend the support or will sellers push BTC lower?
{spot}(BTCUSDT)
#Bitcoin #BTC #CryptoAnalysis #BinanceSquare #BTCUSDT
$BTC BITCOIN (BTC) MARKET ANALYSIS | NOVEMBER 13, 2026
Bitcoin is facing strong selling pressure as bearish momentum continues across the crypto market.
💰 Current Price: $69,192
📉 24H Change: -6.14%
🔴 Key Resistance: $73,255 – $73,437
🟢 Immediate Support: Around $68,900
📊 Market Outlook:
BTC remains bearish on the short-term 4H and daily charts.
🐻 Bearish Scenario: A breakdown below recent lows could trigger further downside.
🐂 Bullish Scenario: A strong recovery and breakout above resistance could improve market sentiment.
⚠️ My Strategy: Wait for confirmation before entering any trade. Manage risk carefully and avoid emotional decisions.
Bitcoin is at a critical level. Will buyers defend the support or will sellers push BTC lower?
#Bitcoin #BTC #CryptoAnalysis #BinanceSquare #BTCUSDT
Bitcoin is facing strong selling pressure as bearish momentum continues across the crypto market.
💰 Current Price: $69,192
📉 24H Change: -6.14%
🔴 Key Resistance: $73,255 – $73,437
🟢 Immediate Support: Around $68,900
📊 Market Outlook:
BTC remains bearish on the short-term 4H and daily charts.
🐻 Bearish Scenario: A breakdown below recent lows could trigger further downside.
🐂 Bullish Scenario: A strong recovery and breakout above resistance could improve market sentiment.
⚠️ My Strategy: Wait for confirmation before entering any trade. Manage risk carefully and avoid emotional decisions.
Bitcoin is at a critical level. Will buyers defend the support or will sellers push BTC lower?
#Bitcoin #BTC #CryptoAnalysis #BinanceSquare #BTCUSDT
62
·
--
Bearish
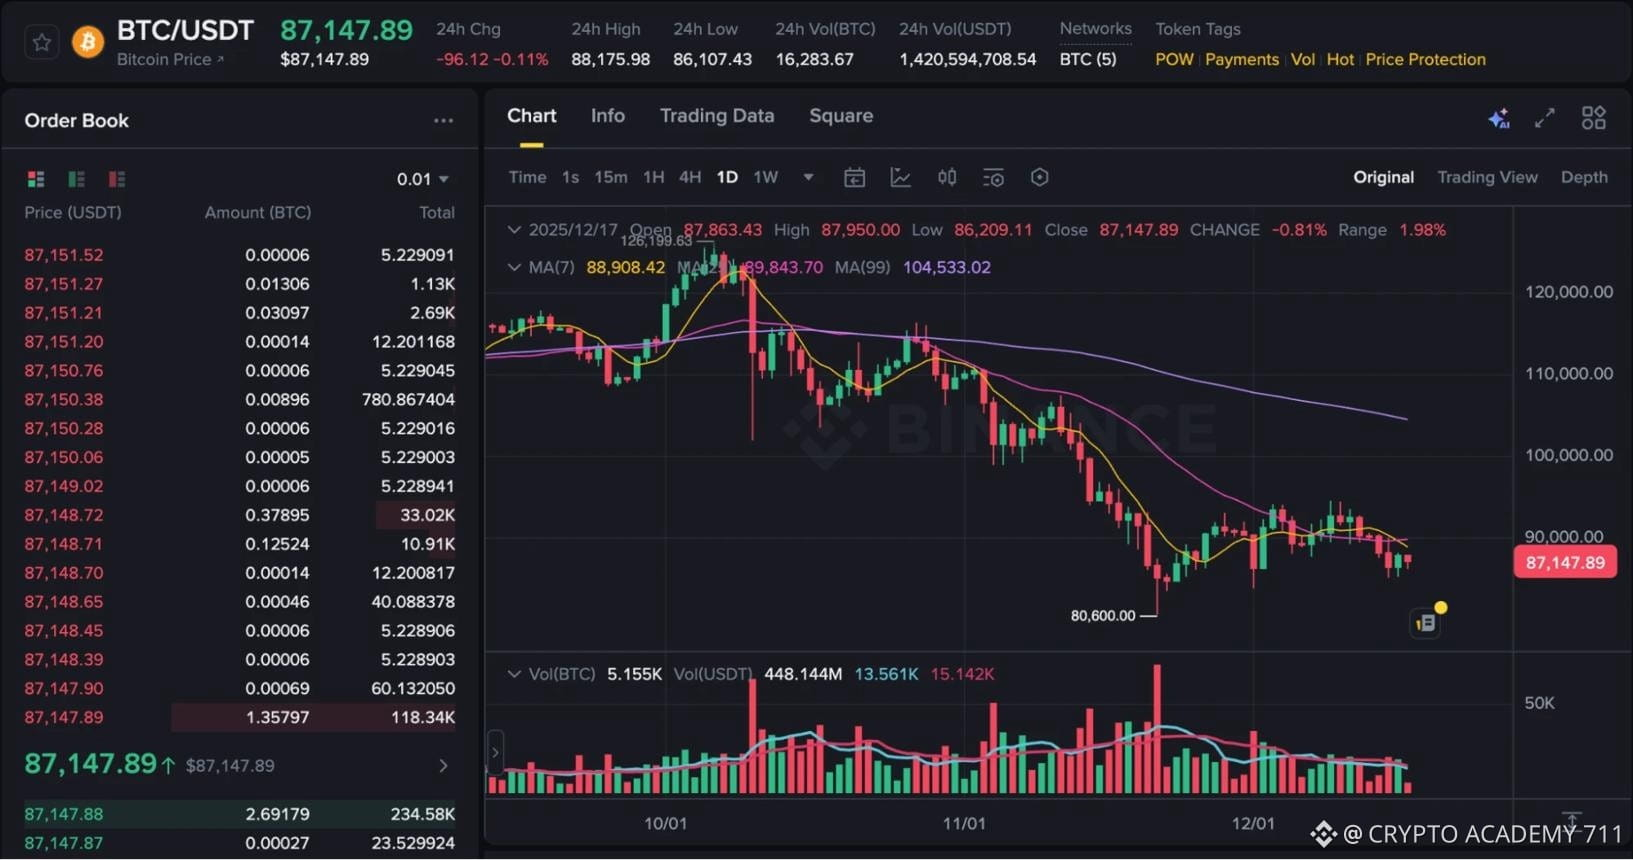
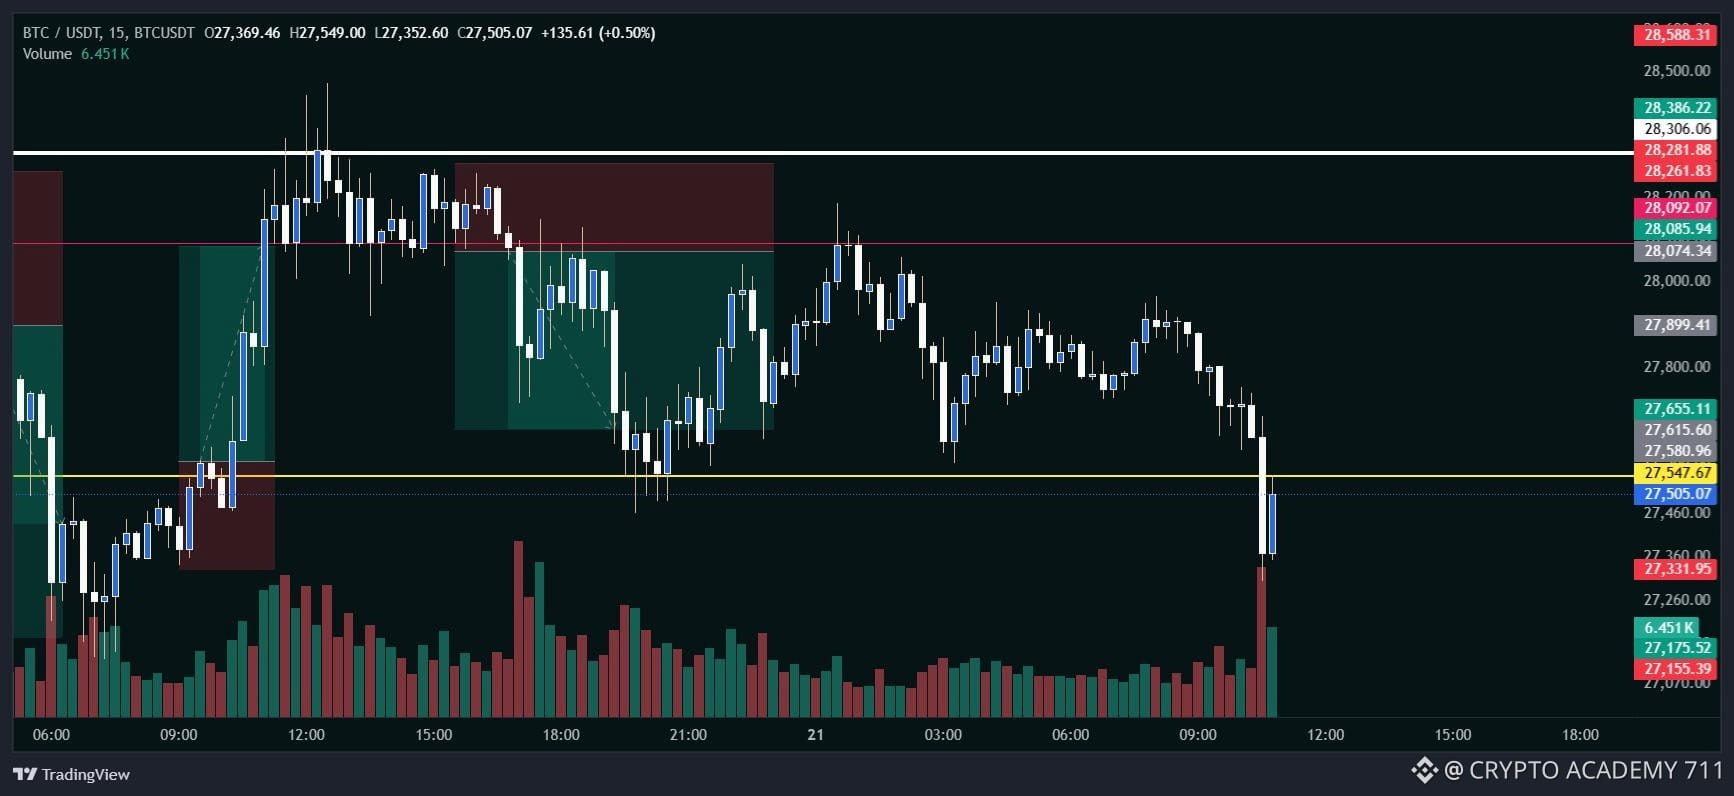
$BTC BITCOIN (BTC) MARKET ANALYSIS – NOVEMBER 13, 2026
₿ BTC/USDT – Bearish Market Structure
Bitcoin is facing strong selling pressure, with the price trading around the $71,000 area.
📊 Technical Analysis
• Current Price: Around $71,000
• Market Trend: Bearish
• Resistance 1: $73,255 – $73,437
• Resistance 2: $73,906 – $74,089
• Support 1: $70,150
• Support 2: $69,100
🔴 Bearish Scenario:
If BTC breaks below $70,150, further downside toward $69,100 could become possible.
🟢 Bullish Scenario:
If BTC reclaims $73,437 with strong volume, a recovery toward $73,900–$74,100 could follow.
🎯 Trading Strategy
• Watch resistance rejection for bearish opportunities.
• Wait for confirmation before entering trades.
• Avoid excessive leverage.
• Always use stop-loss protection.
📌 Market Outlook: Sellers currently have the advantage. A strong recovery above resistance is needed to improve the short-term outlook.
⚠️ Trade carefully. This is market analysis, not financial advice.
{spot}(BTCUSDT)
#Bitcoin #BTC #CryptoAnalysis #BTCUSDT #Binance #CryptoTrading
$BTC BITCOIN (BTC) MARKET ANALYSIS – NOVEMBER 13, 2026
₿ BTC/USDT – Bearish Market Structure
Bitcoin is facing strong selling pressure, with the price trading around the $71,000 area.
📊 Technical Analysis
• Current Price: Around $71,000
• Market Trend: Bearish
• Resistance 1: $73,255 – $73,437
• Resistance 2: $73,906 – $74,089
• Support 1: $70,150
• Support 2: $69,100
🔴 Bearish Scenario:
If BTC breaks below $70,150, further downside toward $69,100 could become possible.
🟢 Bullish Scenario:
If BTC reclaims $73,437 with strong volume, a recovery toward $73,900–$74,100 could follow.
🎯 Trading Strategy
• Watch resistance rejection for bearish opportunities.
• Wait for confirmation before entering trades.
• Avoid excessive leverage.
• Always use stop-loss protection.
📌 Market Outlook: Sellers currently have the advantage. A strong recovery above resistance is needed to improve the short-term outlook.
⚠️ Trade carefully. This is market analysis, not financial advice.
#Bitcoin #BTC #CryptoAnalysis #BTCUSDT #Binance #CryptoTrading
₿ BTC/USDT – Bearish Market Structure
Bitcoin is facing strong selling pressure, with the price trading around the $71,000 area.
📊 Technical Analysis
• Current Price: Around $71,000
• Market Trend: Bearish
• Resistance 1: $73,255 – $73,437
• Resistance 2: $73,906 – $74,089
• Support 1: $70,150
• Support 2: $69,100
🔴 Bearish Scenario:
If BTC breaks below $70,150, further downside toward $69,100 could become possible.
🟢 Bullish Scenario:
If BTC reclaims $73,437 with strong volume, a recovery toward $73,900–$74,100 could follow.
🎯 Trading Strategy
• Watch resistance rejection for bearish opportunities.
• Wait for confirmation before entering trades.
• Avoid excessive leverage.
• Always use stop-loss protection.
📌 Market Outlook: Sellers currently have the advantage. A strong recovery above resistance is needed to improve the short-term outlook.
⚠️ Trade carefully. This is market analysis, not financial advice.
#Bitcoin #BTC #CryptoAnalysis #BTCUSDT #Binance #CryptoTrading

124
·
--
Bearish
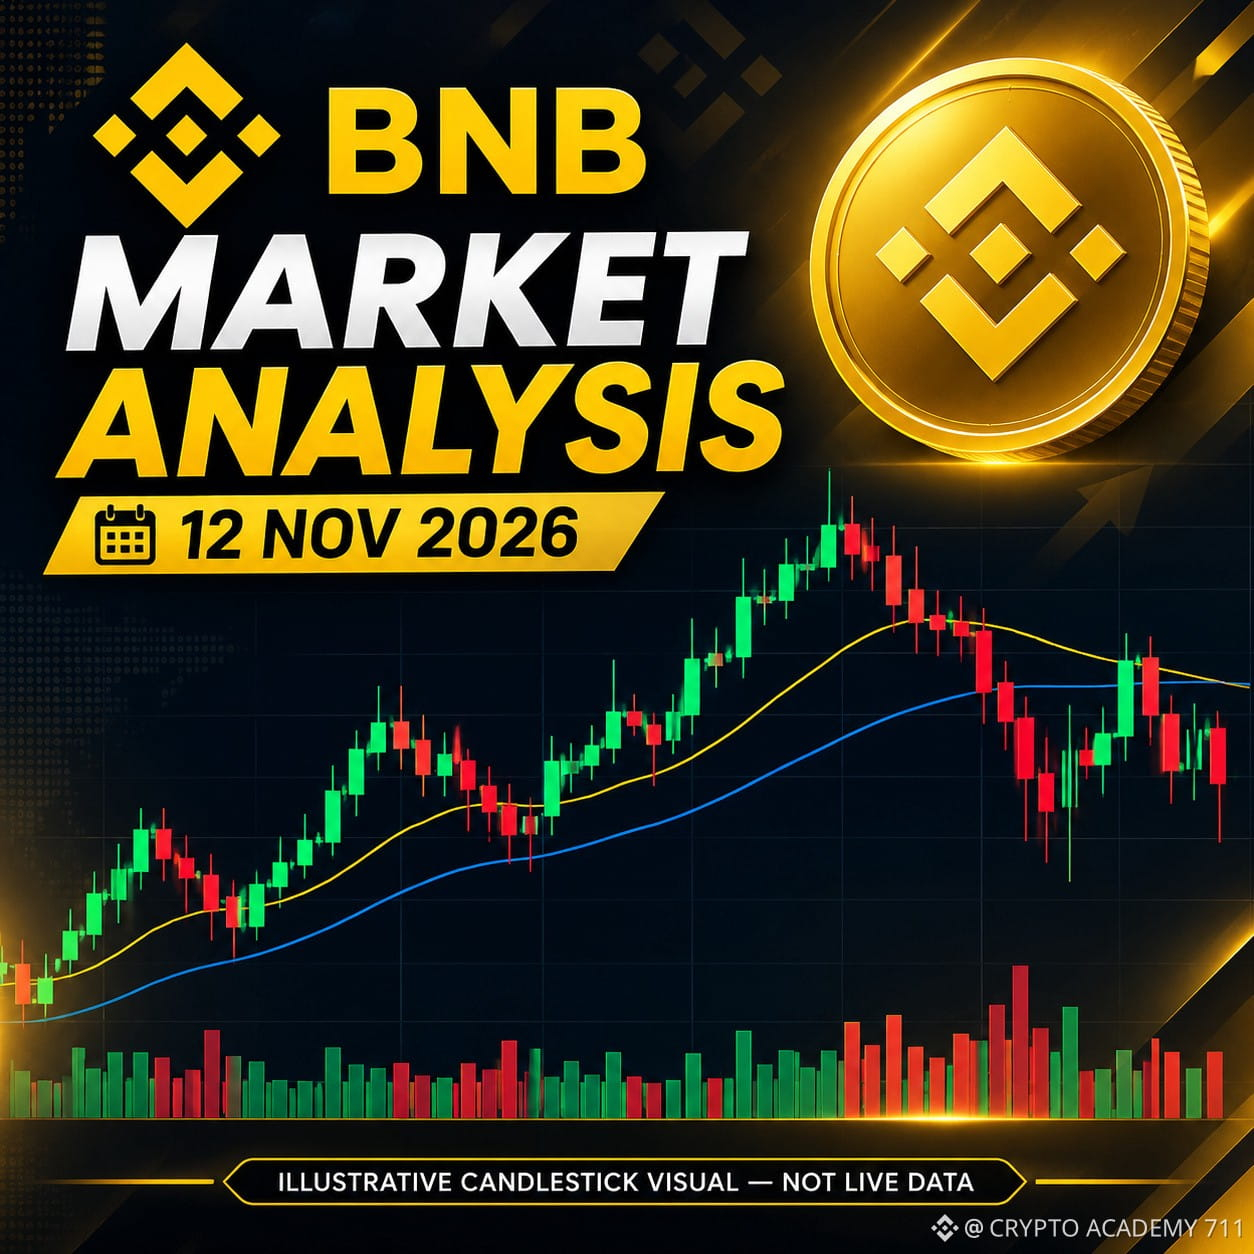
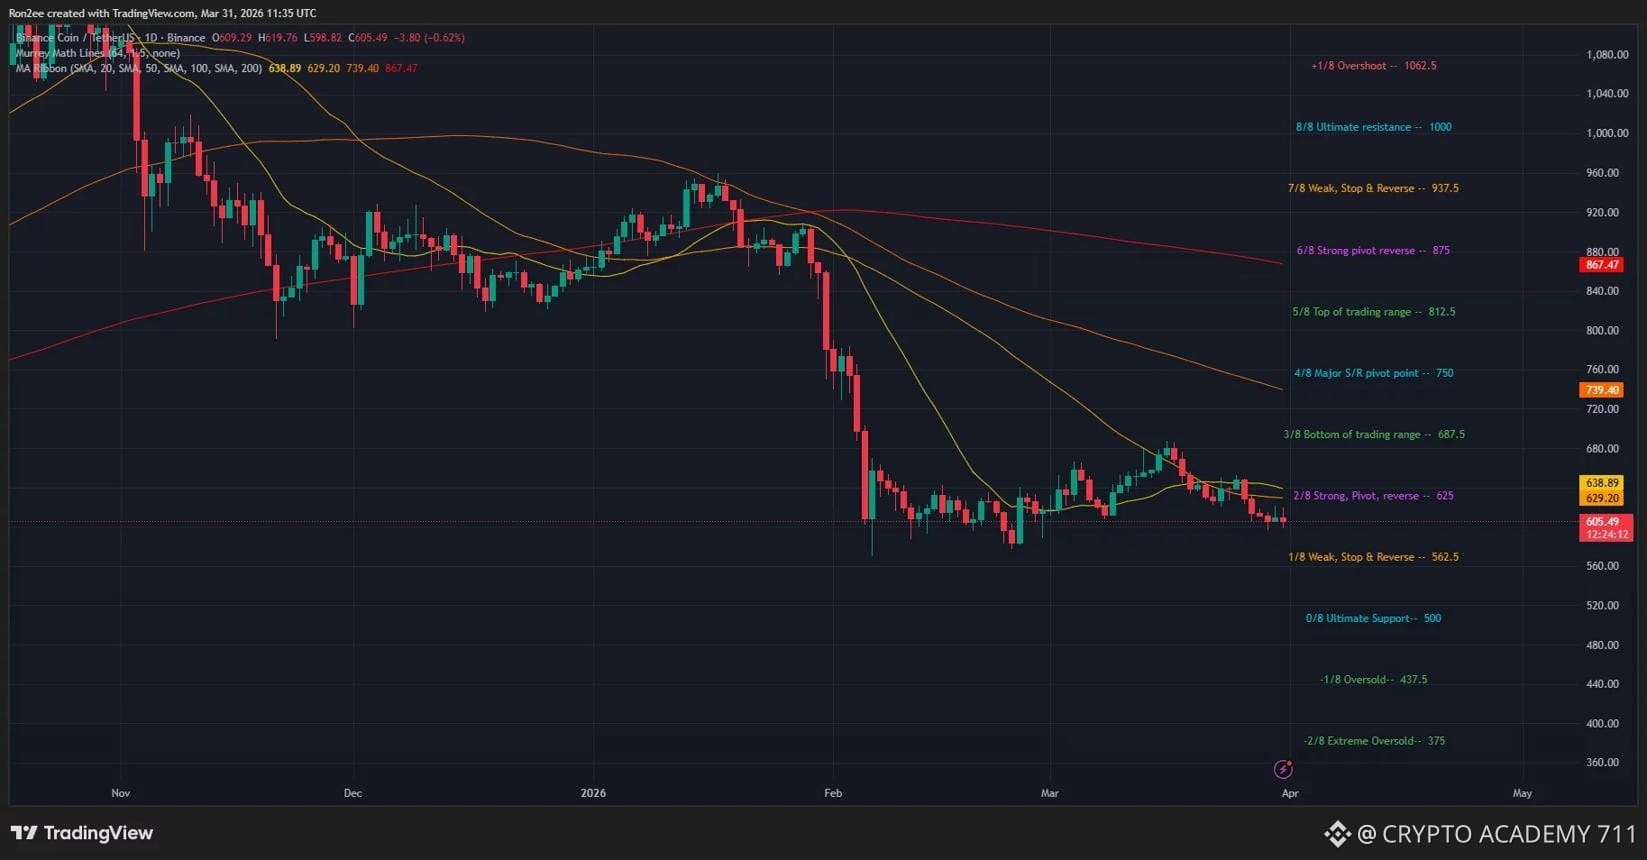
$BNB MARKET ANALYSIS – NOVEMBER 12, 2026
BNB Dips below $660
Current Price: Around $680
Market Structure: Sideways to Bearish
📊 Technical Overview
BNB is currently facing selling pressure after losing its previous support zone. The daily trend remains weak, and buyers need stronger momentum to confirm a bullish reversal.
🔹 Key Support Levels
$668 – Immediate support
$650 – Secondary support
$610 – Major support
🔹 Key Resistance Levels
$704 – First resistance
$723 – Strong resistance
$751 – Next upside target
📈 Bullish Scenario: If BNB reclaims $704 and maintains buying volume, a recovery toward $723 and $751 could become possible.
📉 Bearish Scenario: If BNB loses $668, further downside toward $650 may follow. A deeper correction could expose the $610 support zone.
My Market Outlook: BNB needs a strong breakout above $704 to improve its short-term outlook. Until then, traders should remain cautious and watch volume confirmation.
⚠️ Trade with proper risk management. This is market analysis, not financial advice.
{spot}(BNBUSDT)
#BNB #BinanceCoin #CryptoAnalysis #BNBTrading #CryptoMarket
$BNB MARKET ANALYSIS – NOVEMBER 12, 2026
BNB Dips below $660
Current Price: Around $680
Market Structure: Sideways to Bearish
📊 Technical Overview
BNB is currently facing selling pressure after losing its previous support zone. The daily trend remains weak, and buyers need stronger momentum to confirm a bullish reversal.
🔹 Key Support Levels
$668 – Immediate support
$650 – Secondary support
$610 – Major support
🔹 Key Resistance Levels
$704 – First resistance
$723 – Strong resistance
$751 – Next upside target
📈 Bullish Scenario: If BNB reclaims $704 and maintains buying volume, a recovery toward $723 and $751 could become possible.
📉 Bearish Scenario: If BNB loses $668, further downside toward $650 may follow. A deeper correction could expose the $610 support zone.
My Market Outlook: BNB needs a strong breakout above $704 to improve its short-term outlook. Until then, traders should remain cautious and watch volume confirmation.
⚠️ Trade with proper risk management. This is market analysis, not financial advice.
#BNB #BinanceCoin #CryptoAnalysis #BNBTrading #CryptoMarket
BNB Dips below $660
Current Price: Around $680
Market Structure: Sideways to Bearish
📊 Technical Overview
BNB is currently facing selling pressure after losing its previous support zone. The daily trend remains weak, and buyers need stronger momentum to confirm a bullish reversal.
🔹 Key Support Levels
$668 – Immediate support
$650 – Secondary support
$610 – Major support
🔹 Key Resistance Levels
$704 – First resistance
$723 – Strong resistance
$751 – Next upside target
📈 Bullish Scenario: If BNB reclaims $704 and maintains buying volume, a recovery toward $723 and $751 could become possible.
📉 Bearish Scenario: If BNB loses $668, further downside toward $650 may follow. A deeper correction could expose the $610 support zone.
My Market Outlook: BNB needs a strong breakout above $704 to improve its short-term outlook. Until then, traders should remain cautious and watch volume confirmation.
⚠️ Trade with proper risk management. This is market analysis, not financial advice.
#BNB #BinanceCoin #CryptoAnalysis #BNBTrading #CryptoMarket

2
·
--
Bearish
🚨 BREAKING: Strategy & Metaplanet to Lose MSCI Index Membership
MSCI has announced plans to remove:
🔸 Strategy (MSTR) from its USA Index
🔸 Metaplanet (3350.T) from its Japan Small Cap Index
The changes are scheduled to take effect after the market closes on November 30, 2026.
📉 Why Does This Matter?
• Index-tracking funds may need to adjust their holdings.
• Both companies could face additional selling pressure.
• Market sentiment around Bitcoin treasury companies may weaken.
• Bitcoin could experience indirect short-term volatility.
⚠️ Important: This does NOT mean Strategy or Metaplanet are being delisted from their stock exchanges, or that they are selling their Bitcoin holdings.
📊 Market Watch: Investors should closely monitor MSTR, Metaplanet and BTC price action ahead of November 30.
What do you think? Will this news create more pressure on Bitcoin-related stocks?
{spot}(BTCUSDT)
#Bitcoin #BTC #Strategy #MSTR #Metaplanet #CryptoNews #BinanceSquare
🚨 BREAKING: Strategy & Metaplanet to Lose MSCI Index Membership
MSCI has announced plans to remove:
🔸 Strategy (MSTR) from its USA Index
🔸 Metaplanet (3350.T) from its Japan Small Cap Index
The changes are scheduled to take effect after the market closes on November 30, 2026.
📉 Why Does This Matter?
• Index-tracking funds may need to adjust their holdings.
• Both companies could face additional selling pressure.
• Market sentiment around Bitcoin treasury companies may weaken.
• Bitcoin could experience indirect short-term volatility.
⚠️ Important: This does NOT mean Strategy or Metaplanet are being delisted from their stock exchanges, or that they are selling their Bitcoin holdings.
📊 Market Watch: Investors should closely monitor MSTR, Metaplanet and BTC price action ahead of November 30.
What do you think? Will this news create more pressure on Bitcoin-related stocks?
#Bitcoin #BTC #Strategy #MSTR #Metaplanet #CryptoNews #BinanceSquare
MSCI has announced plans to remove:
🔸 Strategy (MSTR) from its USA Index
🔸 Metaplanet (3350.T) from its Japan Small Cap Index
The changes are scheduled to take effect after the market closes on November 30, 2026.
📉 Why Does This Matter?
• Index-tracking funds may need to adjust their holdings.
• Both companies could face additional selling pressure.
• Market sentiment around Bitcoin treasury companies may weaken.
• Bitcoin could experience indirect short-term volatility.
⚠️ Important: This does NOT mean Strategy or Metaplanet are being delisted from their stock exchanges, or that they are selling their Bitcoin holdings.
📊 Market Watch: Investors should closely monitor MSTR, Metaplanet and BTC price action ahead of November 30.
What do you think? Will this news create more pressure on Bitcoin-related stocks?
#Bitcoin #BTC #Strategy #MSTR #Metaplanet #CryptoNews #BinanceSquare

61
·
--
Bearish
66
·
--
Bearish
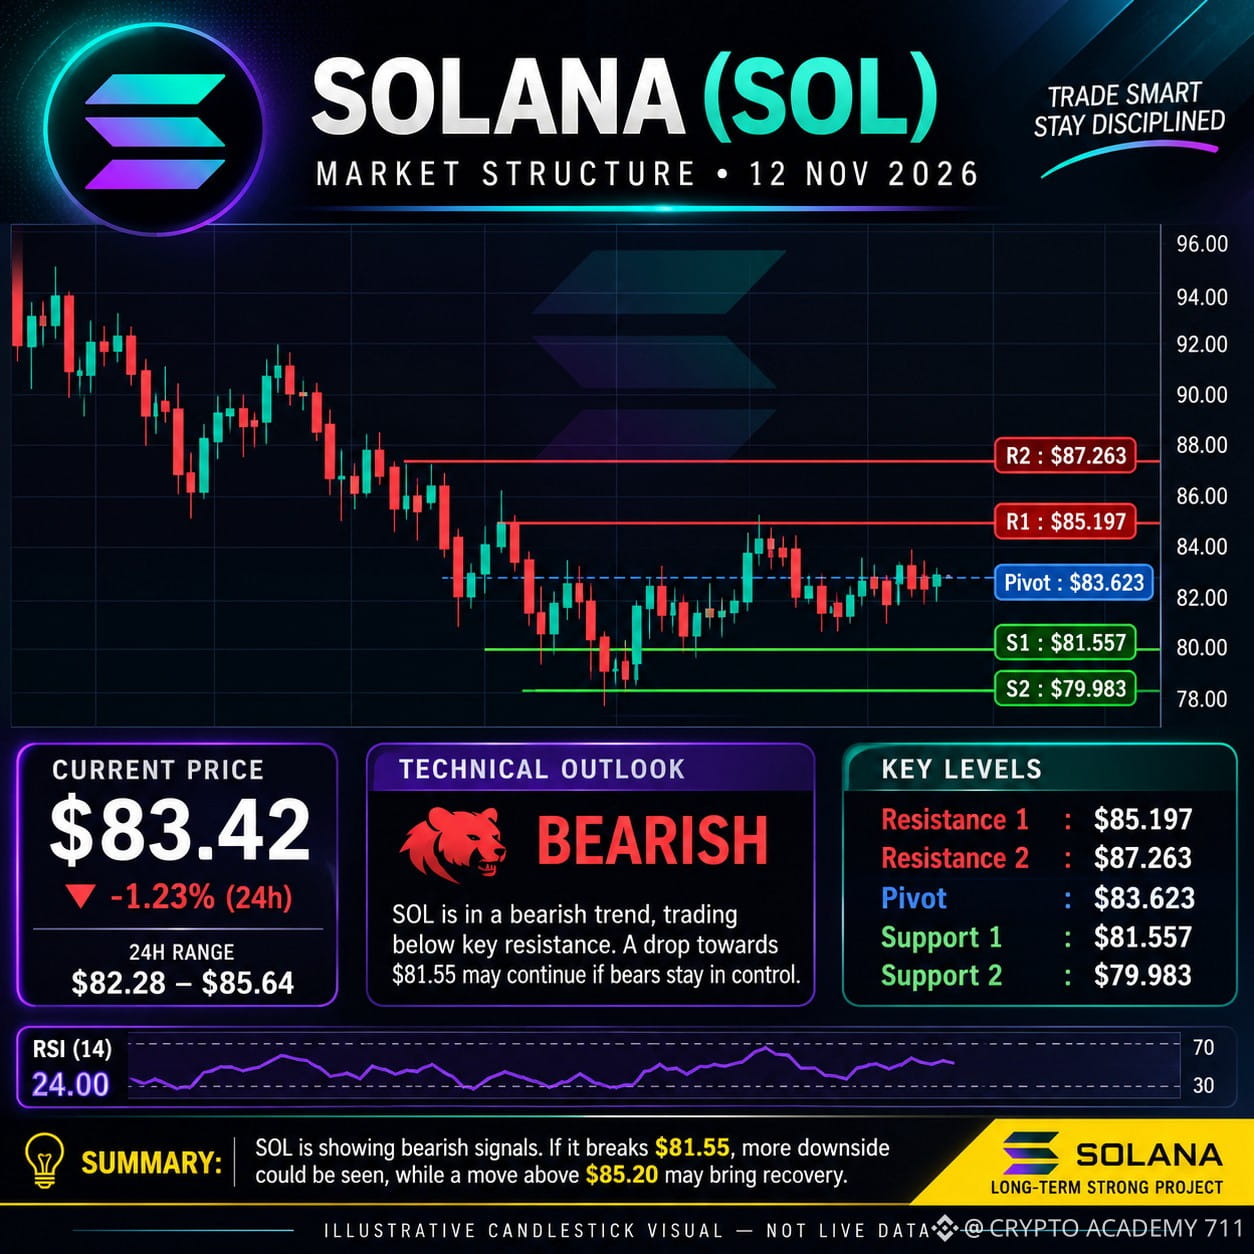
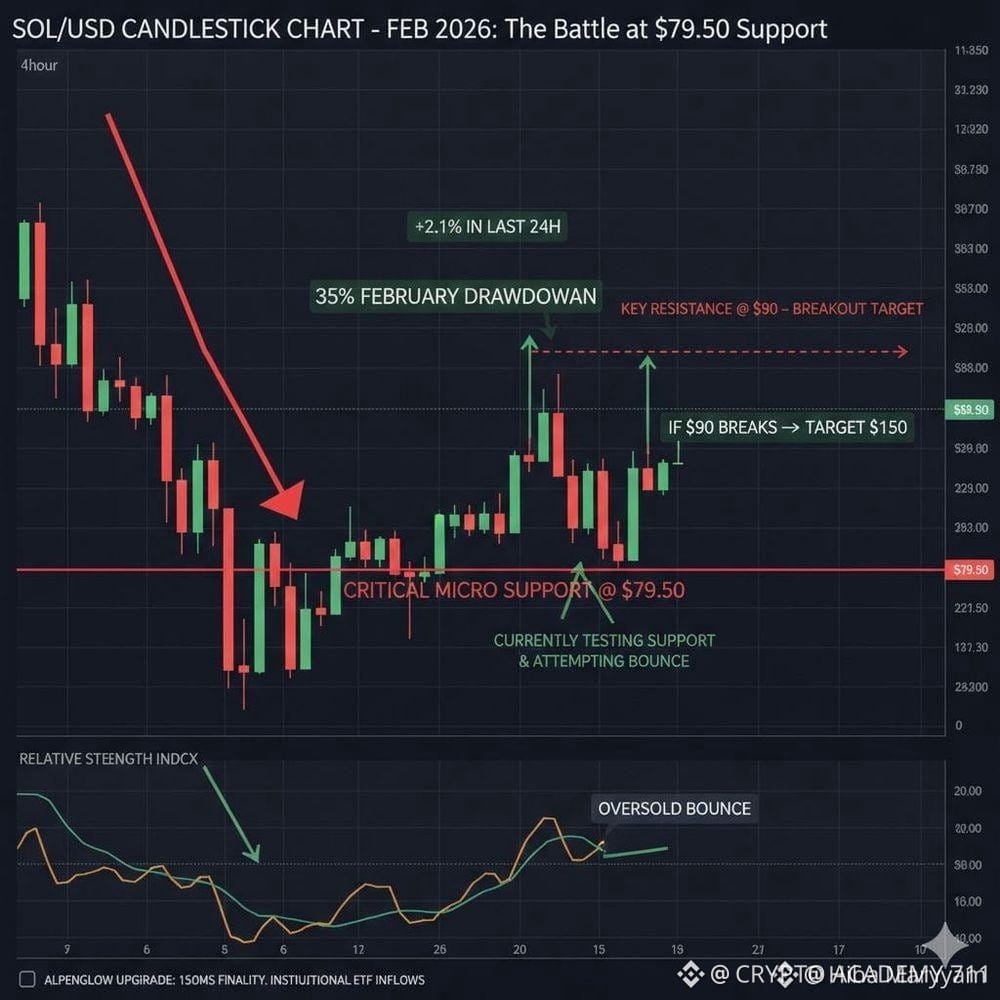
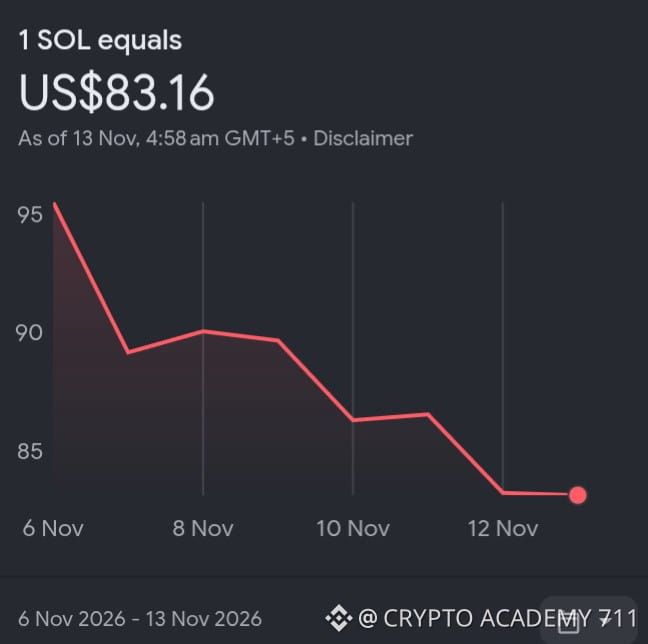
$SOL SOLANA (SOL) MARKET ANALYSIS – NOVEMBER 12, 2026
Solana is currently trading around $83.42, showing bearish market conditions.
📉 Technical Outlook:
SOL remains under selling pressure, with RSI around 24, indicating oversold conditions.
🔴 Resistance Levels:
• $85.20
• $87.26
• $88.84
🟢 Support Levels:
• $81.56
• $79.98
• $77.92
📊 Market Scenarios:
🐻 Bearish: A breakdown below $81.55 could trigger further downside.
🐂 Bullish: A strong recovery above $85.20 could open the door toward $87.26.
⚠️ My View: SOL remains bearish in the short term. Watch support carefully and wait for confirmation before entering a trade.
DYOR. Always manage your risk.
{spot}(SOLUSDT)
#Solana #SOL #CryptoAnalysis #BinanceSquare #CryptoTrading #Altcoins
$SOL SOLANA (SOL) MARKET ANALYSIS – NOVEMBER 12, 2026
Solana is currently trading around $83.42, showing bearish market conditions.
📉 Technical Outlook:
SOL remains under selling pressure, with RSI around 24, indicating oversold conditions.
🔴 Resistance Levels:
• $85.20
• $87.26
• $88.84
🟢 Support Levels:
• $81.56
• $79.98
• $77.92
📊 Market Scenarios:
🐻 Bearish: A breakdown below $81.55 could trigger further downside.
🐂 Bullish: A strong recovery above $85.20 could open the door toward $87.26.
⚠️ My View: SOL remains bearish in the short term. Watch support carefully and wait for confirmation before entering a trade.
DYOR. Always manage your risk.
#Solana #SOL #CryptoAnalysis #BinanceSquare #CryptoTrading #Altcoins
Solana is currently trading around $83.42, showing bearish market conditions.
📉 Technical Outlook:
SOL remains under selling pressure, with RSI around 24, indicating oversold conditions.
🔴 Resistance Levels:
• $85.20
• $87.26
• $88.84
🟢 Support Levels:
• $81.56
• $79.98
• $77.92
📊 Market Scenarios:
🐻 Bearish: A breakdown below $81.55 could trigger further downside.
🐂 Bullish: A strong recovery above $85.20 could open the door toward $87.26.
⚠️ My View: SOL remains bearish in the short term. Watch support carefully and wait for confirmation before entering a trade.
DYOR. Always manage your risk.
#Solana #SOL #CryptoAnalysis #BinanceSquare #CryptoTrading #Altcoins
53
·
--
Bearish
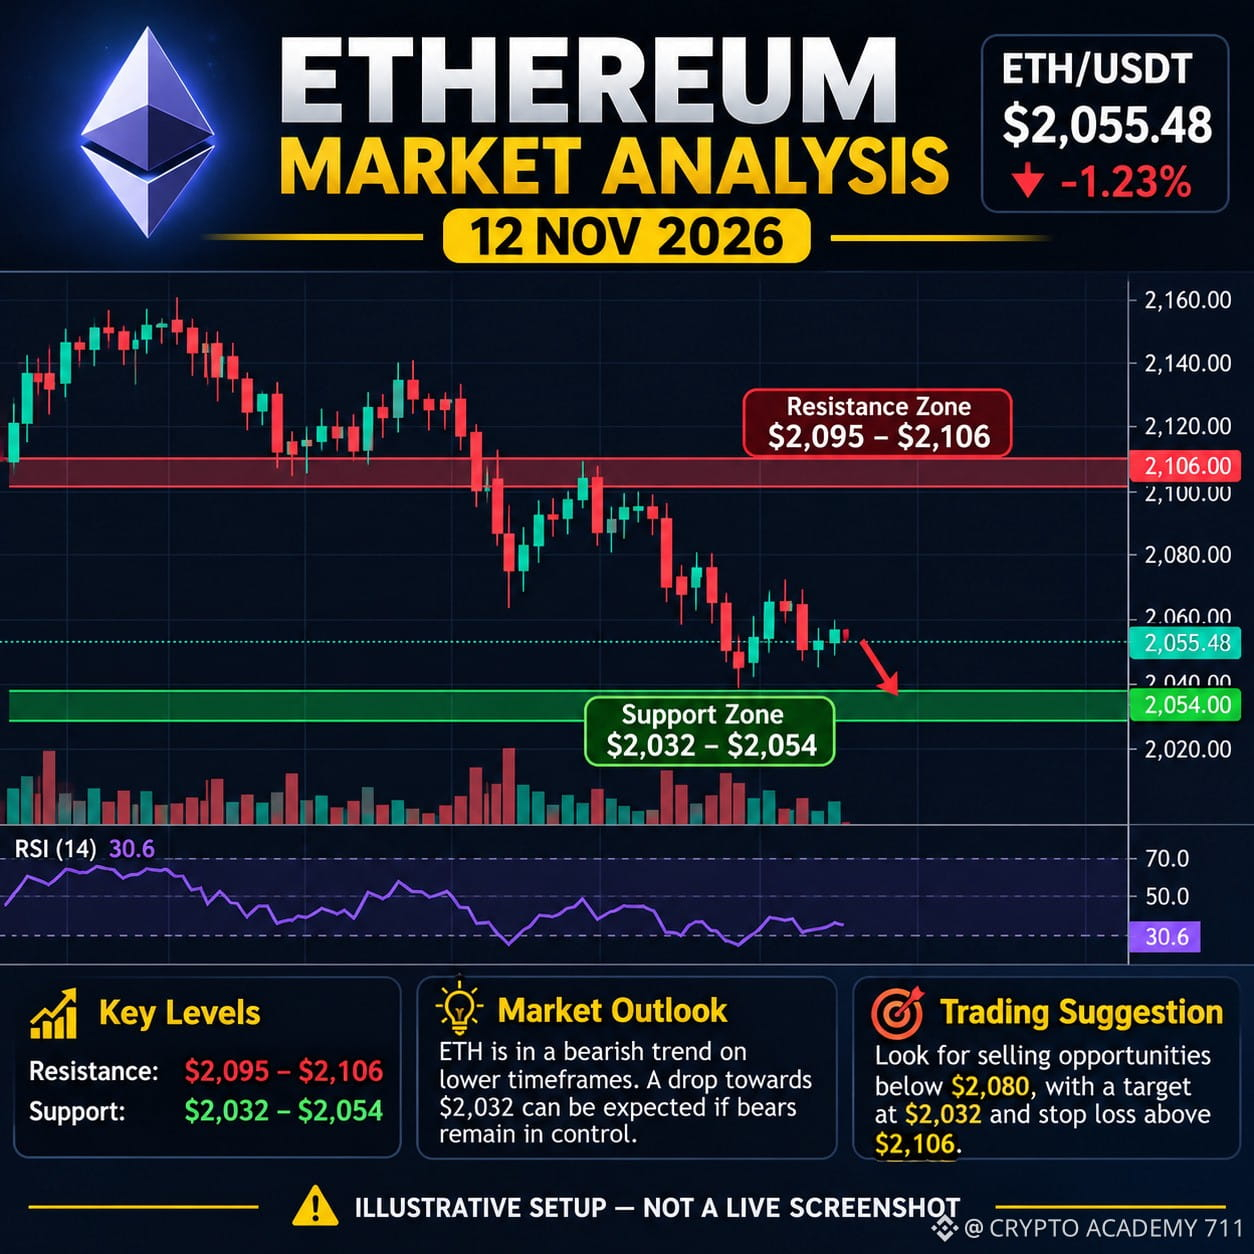
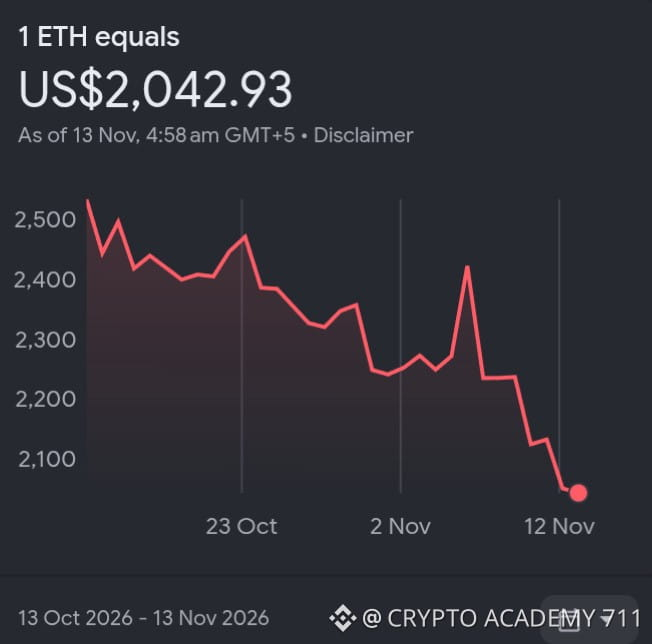
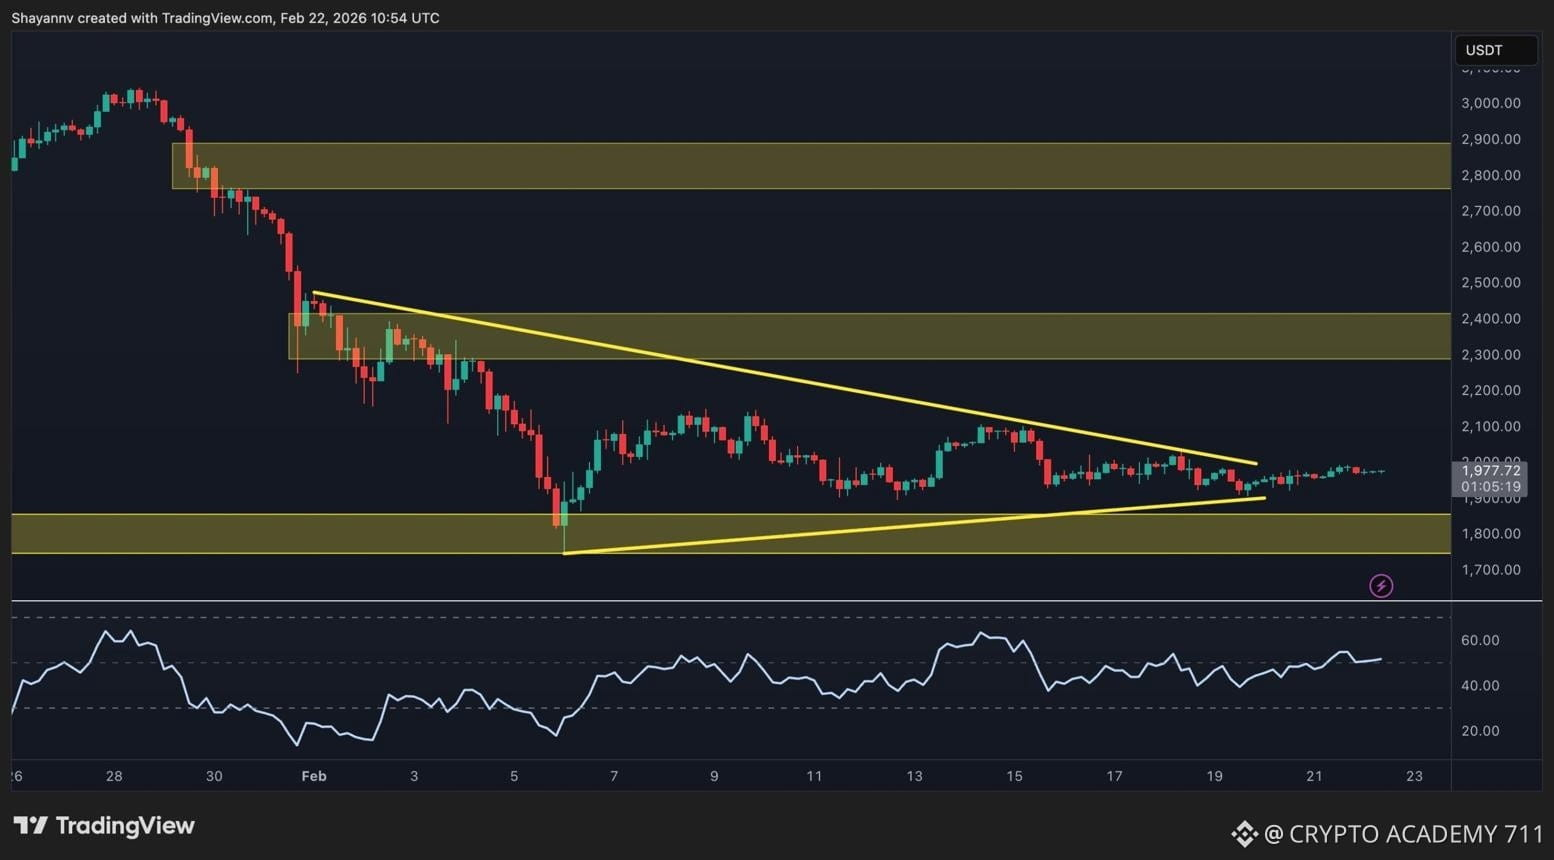
$ETH ETHEREUM (ETH) PRICE ANALYSIS | NOVEMBER 12, 2026
Ethereum is facing significant selling pressure, with ETH trading around $2,055.
🔴 Market Structure: Bearish
📉 Key Resistance Levels:
• $2,101
• $2,147
• $2,211
🟢 Key Support Levels:
• $2,032
• $1,993
• $1,949
Bullish Scenario:
If ETH breaks above $2,101 and maintains momentum, buyers could target $2,147.
Bearish Scenario:
A breakdown below $2,032 could push ETH toward $1,993 and potentially $1,949.
My Market View:
Sellers currently have the advantage. Traders should watch the $2,032 support zone and wait for confirmation before entering positions.
⚠️ Always use proper risk management. This is market analysis, not financial advice.
{spot}(ETHUSDT)
#Ethereum #ETH #CryptoAnalysis #BinanceSquare #ETHUSDT #CryptoTrading
$ETH ETHEREUM (ETH) PRICE ANALYSIS | NOVEMBER 12, 2026
Ethereum is facing significant selling pressure, with ETH trading around $2,055.
🔴 Market Structure: Bearish
📉 Key Resistance Levels:
• $2,101
• $2,147
• $2,211
🟢 Key Support Levels:
• $2,032
• $1,993
• $1,949
Bullish Scenario:
If ETH breaks above $2,101 and maintains momentum, buyers could target $2,147.
Bearish Scenario:
A breakdown below $2,032 could push ETH toward $1,993 and potentially $1,949.
My Market View:
Sellers currently have the advantage. Traders should watch the $2,032 support zone and wait for confirmation before entering positions.
⚠️ Always use proper risk management. This is market analysis, not financial advice.
#Ethereum #ETH #CryptoAnalysis #BinanceSquare #ETHUSDT #CryptoTrading
Ethereum is facing significant selling pressure, with ETH trading around $2,055.
🔴 Market Structure: Bearish
📉 Key Resistance Levels:
• $2,101
• $2,147
• $2,211
🟢 Key Support Levels:
• $2,032
• $1,993
• $1,949
Bullish Scenario:
If ETH breaks above $2,101 and maintains momentum, buyers could target $2,147.
Bearish Scenario:
A breakdown below $2,032 could push ETH toward $1,993 and potentially $1,949.
My Market View:
Sellers currently have the advantage. Traders should watch the $2,032 support zone and wait for confirmation before entering positions.
⚠️ Always use proper risk management. This is market analysis, not financial advice.
#Ethereum #ETH #CryptoAnalysis #BinanceSquare #ETHUSDT #CryptoTrading
69
·
--
Bearish
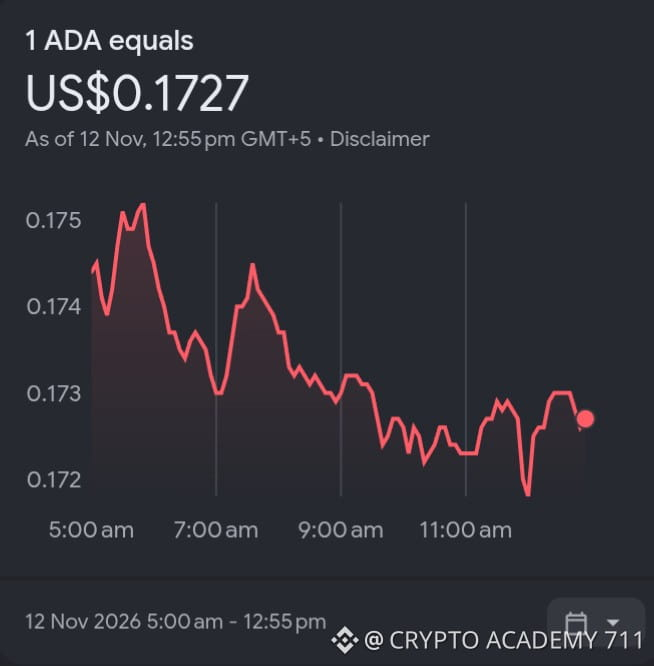
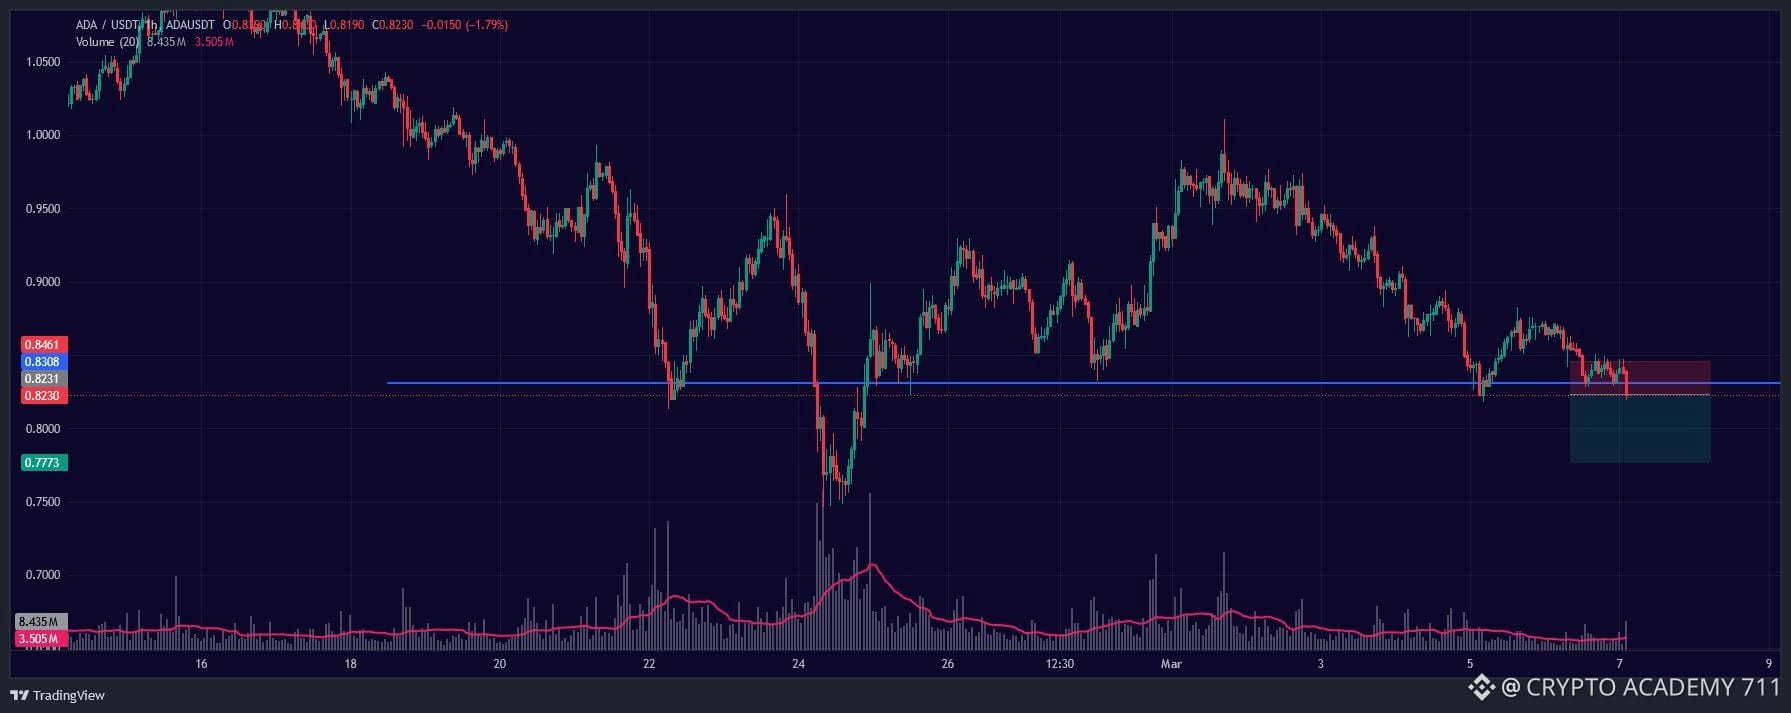
$ADA CARDANO (ADA) MARKET ANALYSIS | NOVEMBER 12, 2026
Cardano is currently trading around $0.1742, with sellers maintaining pressure on the daily timeframe.
📊 Technical Overview:
• Current Price: $0.1742
• Resistance 1: $0.1782
• Resistance 2: $0.1827
• Support 1: $0.1706
• Support 2: $0.1648
📈 Bullish Scenario:
A strong breakout above $0.1782 could push ADA towards $0.1827.
📉 Bearish Scenario:
A breakdown below $0.1706 could bring further downside towards $0.1648.
Market Sentiment: Bearish in the short term. RSI indicates weak momentum, so traders should watch for confirmation before entering positions.
🎯 My Strategy: Watch key support and resistance levels. Avoid chasing sudden price movements.
What is your prediction for ADA?
🚀 BULLISH or 🔻 BEARISH?
{spot}(ADAUSDT)
#ADA #Cardano #CryptoAnalysis #BinanceSquare #CryptoTrading
$ADA CARDANO (ADA) MARKET ANALYSIS | NOVEMBER 12, 2026
Cardano is currently trading around $0.1742, with sellers maintaining pressure on the daily timeframe.
📊 Technical Overview:
• Current Price: $0.1742
• Resistance 1: $0.1782
• Resistance 2: $0.1827
• Support 1: $0.1706
• Support 2: $0.1648
📈 Bullish Scenario:
A strong breakout above $0.1782 could push ADA towards $0.1827.
📉 Bearish Scenario:
A breakdown below $0.1706 could bring further downside towards $0.1648.
Market Sentiment: Bearish in the short term. RSI indicates weak momentum, so traders should watch for confirmation before entering positions.
🎯 My Strategy: Watch key support and resistance levels. Avoid chasing sudden price movements.
What is your prediction for ADA?
🚀 BULLISH or 🔻 BEARISH?
#ADA #Cardano #CryptoAnalysis #BinanceSquare #CryptoTrading
Cardano is currently trading around $0.1742, with sellers maintaining pressure on the daily timeframe.
📊 Technical Overview:
• Current Price: $0.1742
• Resistance 1: $0.1782
• Resistance 2: $0.1827
• Support 1: $0.1706
• Support 2: $0.1648
📈 Bullish Scenario:
A strong breakout above $0.1782 could push ADA towards $0.1827.
📉 Bearish Scenario:
A breakdown below $0.1706 could bring further downside towards $0.1648.
Market Sentiment: Bearish in the short term. RSI indicates weak momentum, so traders should watch for confirmation before entering positions.
🎯 My Strategy: Watch key support and resistance levels. Avoid chasing sudden price movements.
What is your prediction for ADA?
🚀 BULLISH or 🔻 BEARISH?
#ADA #Cardano #CryptoAnalysis #BinanceSquare #CryptoTrading

112
Log in to explore more content
Join global crypto users on Binance Square
⚡️ Get latest and useful information about crypto.
💬 Trusted by the world’s largest crypto exchange.
👍 Discover real insights from verified creators.
Email / Phone number
Trending Topics
WhoWillSucceedJensenHuangatNvidia?
149,873 views
1,567 Discussing
Nvidia Says No CEO Talks Underway as "Stand With Jensen" Petition Tops 77,900 Signatures
Binance News
·33 Likes
·57.3k views
WhatWillDriveCryptoandStocks’NextRebound?
546,924 views
3,410 Discussing
BitcoinActiveSupplyInProfitDropsBelow45%
65,509 views
667 Discussing