

BlockVibe Global
10.8k Posts

BlockVibe Global
 Square Verified+
Report
Block User
📊 Crypto Strategist | High-Conviction Signals | Trade Smart, Not Emotional | Real-Time Setups | Manage Your Risk — Not Responsible for Losses
Open Trade
High-Frequency Trader
6.6 Years
5 Following
40.3K+ Followers
17.8K+ Liked
Posts
Portfolio
All
Quotes
Videos
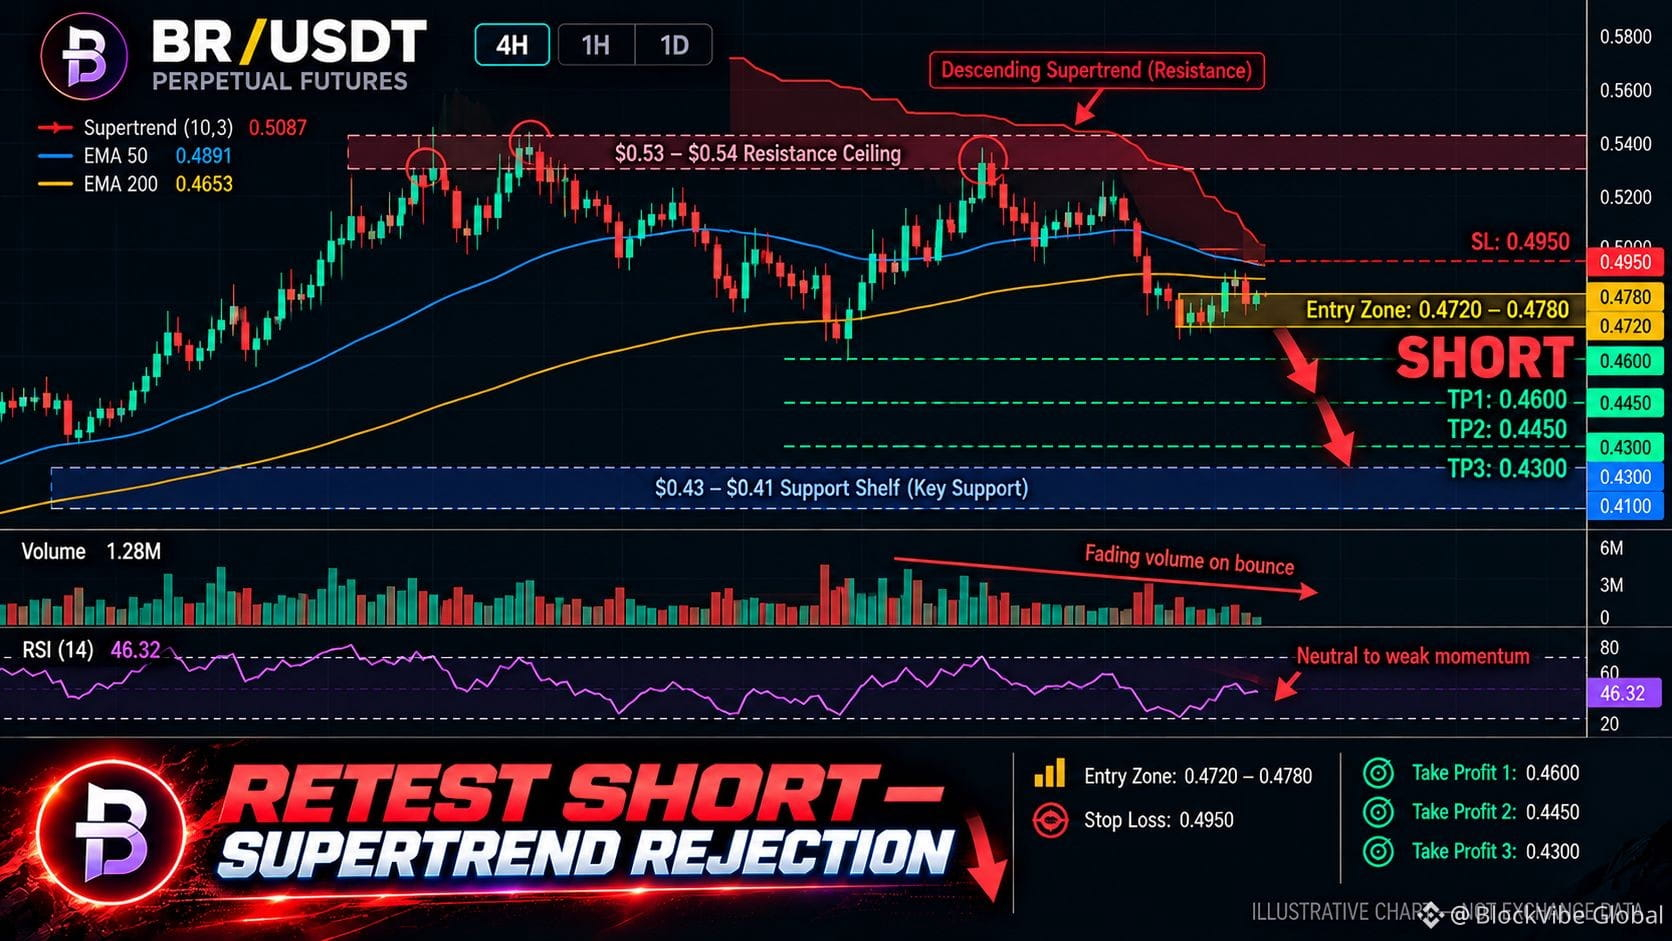
BR bounced into the breakdown — the retest is the short
🔴 SHORT $BR/USDT: expecting price to go DOWN
Bias: SHORT · Leaning
Current Price: $0.4703
Entry: $0.4720 – $0.4780
TP1: $0.4600 (+3.16%)
TP2: $0.4450 (+6.32%)
TP3: $0.4300 (+9.47%)
SL: $0.4950 (−4.21%)
Plan: enter only inside the zone, close 50% at TP1, 25% at TP2, 25% at TP3, and move the stop to entry after TP1. Moderate conviction only, keep size light.
Why SHORT? 3/5 signals agree, 2 against.
• BR rallied from $0.41 to $0.47 but remains below the bearish Supertrend, and the $0.53–$0.54 zone is the immediate rejection ceiling.
• The $0.43–$0.41 support shelf is the downside pivot; a loss there opens the $0.40 handle and the deeper liquidity void toward $0.35.
• Volume on the bounce has not expanded enough to confirm a trend reversal, leaving the move vulnerable to a fade.
Risk: A clean break above $0.54 would invalidate the rejection thesis and open the $0.67–$0.71 major resistance zone.
The setup is a short into a bounce that is stalling below the Supertrend. The entry is placed at the upper end of the current range, so the stop is defined above the $0.495 ceiling. If buyers reclaim $0.50 on a closing basis, the short is wrong.
Does $BR reject $0.478 and flush to $0.445, or does it squeeze through $0.495 first?
Full setup on the chart below.
My call. Your execution.
Click below for trade 👇
DYOR & manage risk!
$BR
{future}(BRUSDT)
BR bounced into the breakdown — the retest is the short
🔴 SHORT $BR /USDT: expecting price to go DOWN
Bias: SHORT · Leaning
Current Price: $0.4703
Entry: $0.4720 – $0.4780
TP1: $0.4600 (+3.16%)
TP2: $0.4450 (+6.32%)
TP3: $0.4300 (+9.47%)
SL: $0.4950 (−4.21%)
Plan: enter only inside the zone, close 50% at TP1, 25% at TP2, 25% at TP3, and move the stop to entry after TP1. Moderate conviction only, keep size light.
Why SHORT? 3/5 signals agree, 2 against.
• BR rallied from $0.41 to $0.47 but remains below the bearish Supertrend, and the $0.53–$0.54 zone is the immediate rejection ceiling.
• The $0.43–$0.41 support shelf is the downside pivot; a loss there opens the $0.40 handle and the deeper liquidity void toward $0.35.
• Volume on the bounce has not expanded enough to confirm a trend reversal, leaving the move vulnerable to a fade.
Risk: A clean break above $0.54 would invalidate the rejection thesis and open the $0.67–$0.71 major resistance zone.
The setup is a short into a bounce that is stalling below the Supertrend. The entry is placed at the upper end of the current range, so the stop is defined above the $0.495 ceiling. If buyers reclaim $0.50 on a closing basis, the short is wrong.
Does $BR reject $0.478 and flush to $0.445, or does it squeeze through $0.495 first?
Full setup on the chart below.
My call. Your execution.
Click below for trade 👇
DYOR & manage risk!
$BR
197
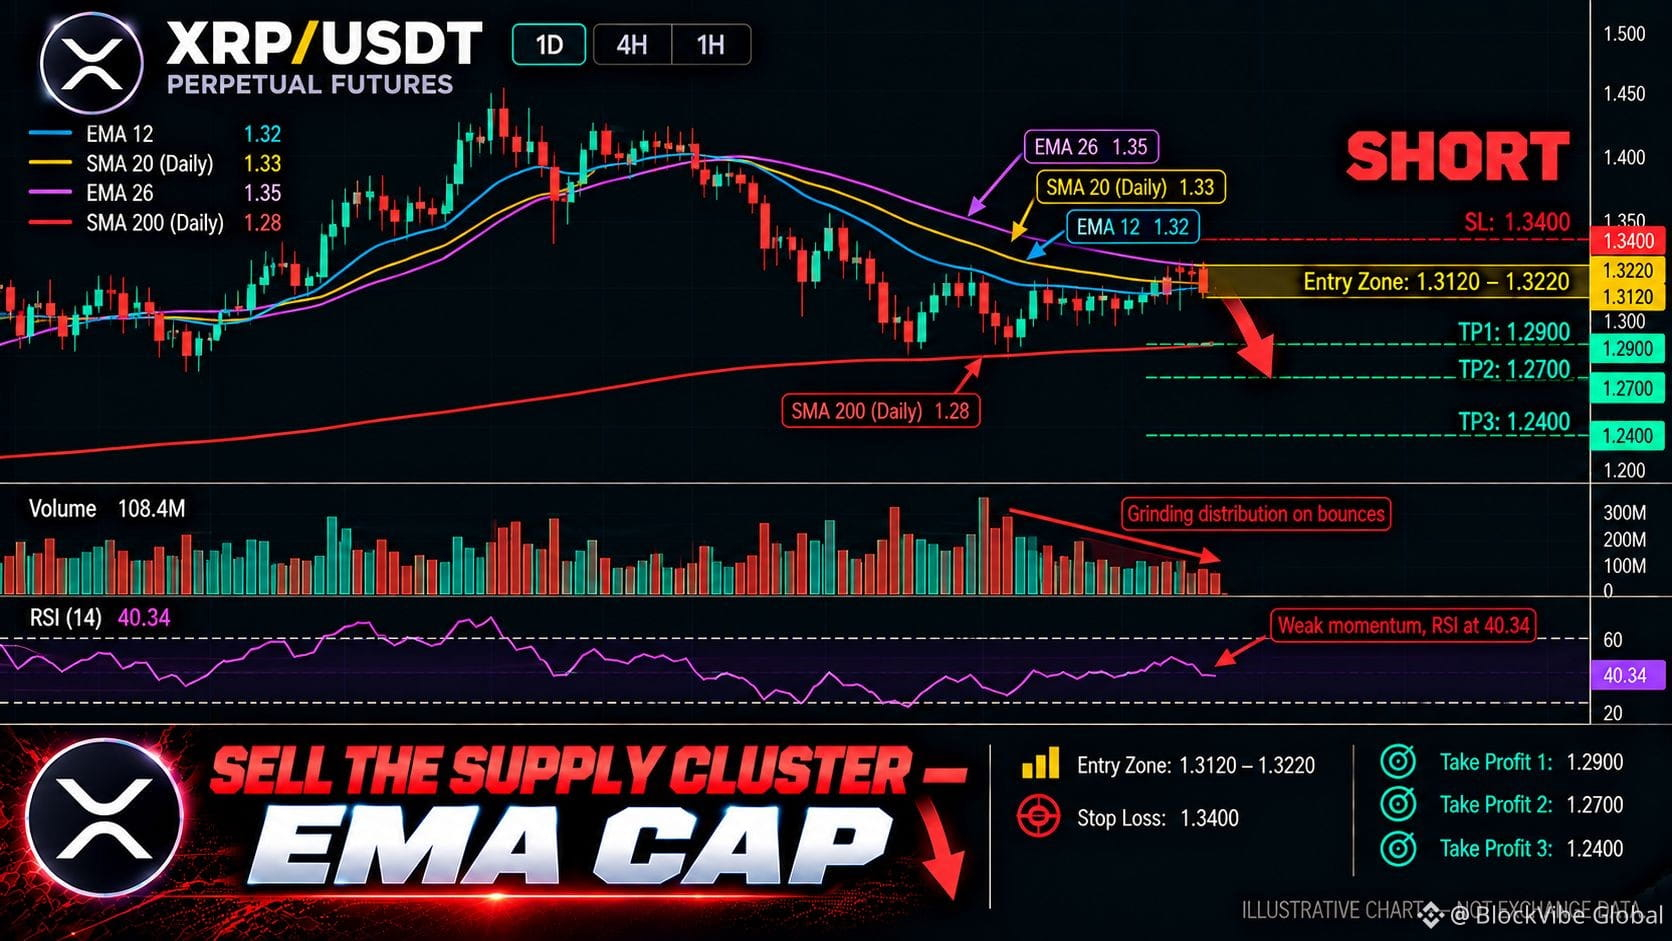
XRP is still capped by the 20-day SMA — the bounce is a short into supply
🔴 SHORT $XRP/USDT: expecting price to go DOWN
Bias: SHORT · Leaning
Current Price: $1.3097
Entry: $1.3120 – $1.3220
TP1: $1.2900 (+1.65%)
TP2: $1.2700 (+3.17%)
TP3: $1.2400 (+5.46%)
SL: $1.3400 (−1.98%)
Plan: enter only inside the zone, close 50% at TP1, 25% at TP2, 25% at TP3, and move the stop to entry after TP1. Moderate conviction only, keep size light.
Why SHORT? 4/6 signals agree, 2 against.
• The 20-day SMA at $1.33 and the 50-day at $1.40 remain overhead, and the EMA12 at $1.32 and EMA26 at $1.35 form a tight supply cluster — the bounce is selling into resistance.
• Daily RSI at 40.34 is closer to oversold than neutral, while Stochastic %K at 27.25 and %D at 21.80 confirm the grind lower.
• Bollinger %B at 0.2453 places XRP in the lower quartile, with the lower band at $1.26 and the midline at $1.33 acting as a ceiling.
Risk: The 200-day SMA at $1.28 is the last mechanical reference below price; a clean 4H hold above $1.34 would invalidate the bearish stack.
XRP is bouncing into a dense moving-average cluster. The entry is placed at the EMA12/20-day confluence, not at current price, because chasing a short into support is poor risk-reward. If $1.34 is reclaimed on a closing basis, the short is wrong.
Does $XRP reject $1.322 and flush to $1.29, or does it reclaim $1.34 first?
Levels mapped on the chart below.
My call. Your execution.
Click below for trade 👇
DYOR & manage risk!
$XRP
{future}(XRPUSDT)
XRP is still capped by the 20-day SMA — the bounce is a short into supply
🔴 SHORT $XRP /USDT: expecting price to go DOWN
Bias: SHORT · Leaning
Current Price: $1.3097
Entry: $1.3120 – $1.3220
TP1: $1.2900 (+1.65%)
TP2: $1.2700 (+3.17%)
TP3: $1.2400 (+5.46%)
SL: $1.3400 (−1.98%)
Plan: enter only inside the zone, close 50% at TP1, 25% at TP2, 25% at TP3, and move the stop to entry after TP1. Moderate conviction only, keep size light.
Why SHORT? 4/6 signals agree, 2 against.
• The 20-day SMA at $1.33 and the 50-day at $1.40 remain overhead, and the EMA12 at $1.32 and EMA26 at $1.35 form a tight supply cluster — the bounce is selling into resistance.
• Daily RSI at 40.34 is closer to oversold than neutral, while Stochastic %K at 27.25 and %D at 21.80 confirm the grind lower.
• Bollinger %B at 0.2453 places XRP in the lower quartile, with the lower band at $1.26 and the midline at $1.33 acting as a ceiling.
Risk: The 200-day SMA at $1.28 is the last mechanical reference below price; a clean 4H hold above $1.34 would invalidate the bearish stack.
XRP is bouncing into a dense moving-average cluster. The entry is placed at the EMA12/20-day confluence, not at current price, because chasing a short into support is poor risk-reward. If $1.34 is reclaimed on a closing basis, the short is wrong.
Does $XRP reject $1.322 and flush to $1.29, or does it reclaim $1.34 first?
Levels mapped on the chart below.
My call. Your execution.
Click below for trade 👇
DYOR & manage risk!
$XRP
1
1k
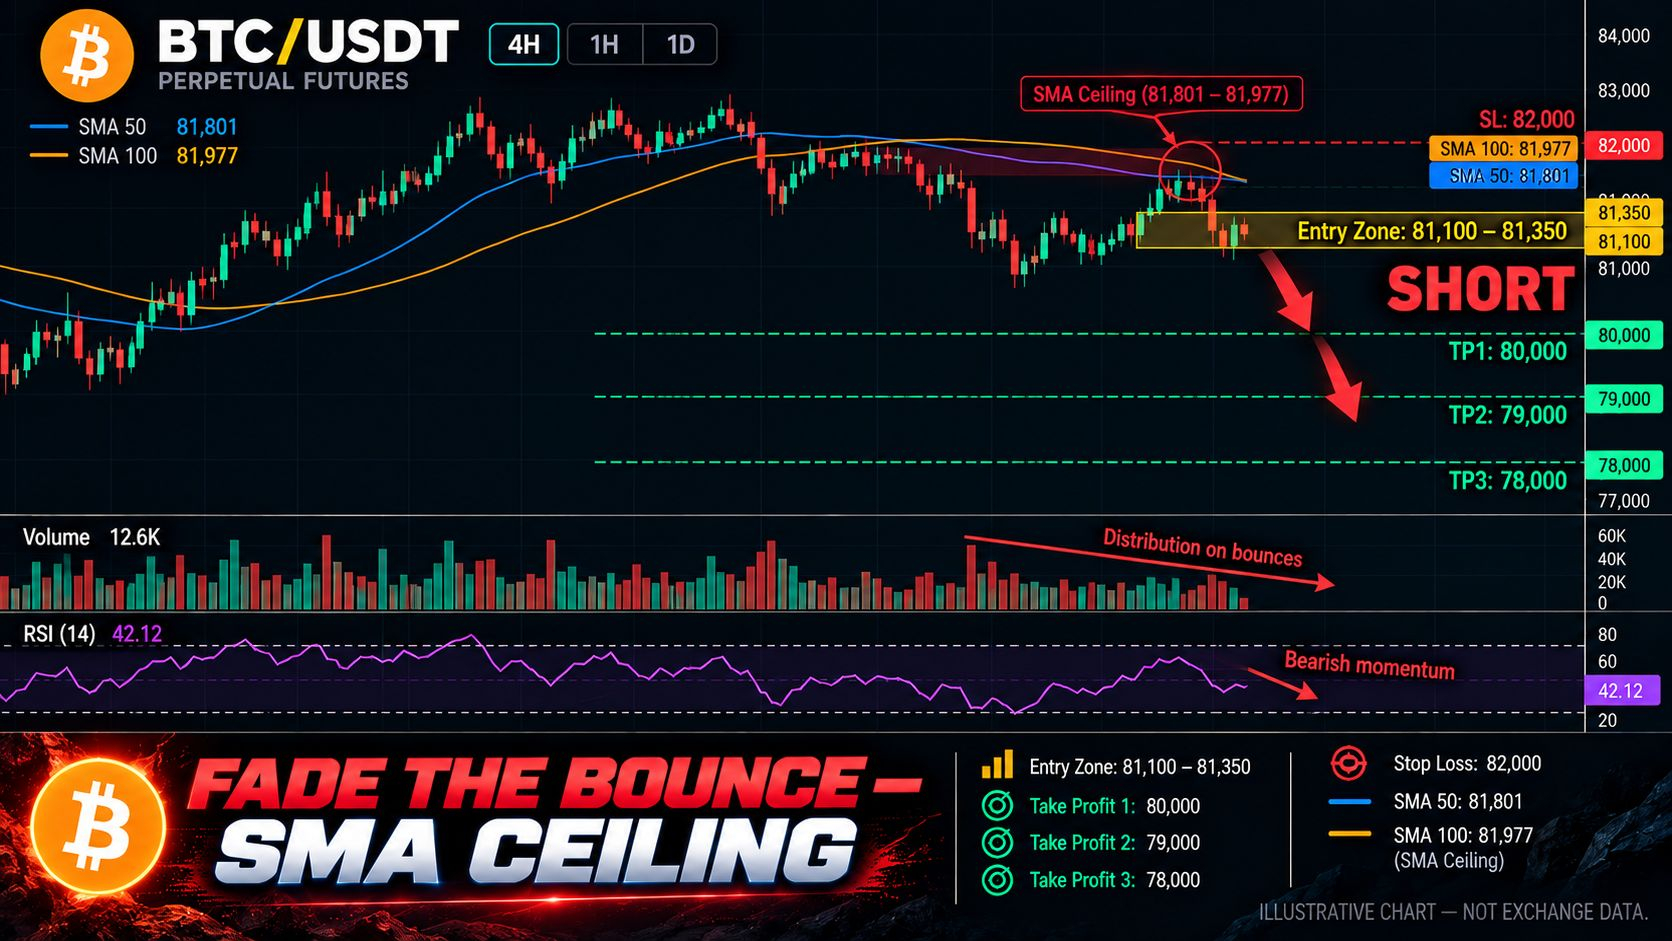
Bitcoin is still capped by the 20/50 SMA stack — the bounce is the short
🔴 SHORT $BTC/USDT: expecting price to go DOWN
Bias: SHORT · Leaning
Current Price: $81,067.00
Entry: $81,100 – $81,350
TP1: $80,000 (+1.51%)
TP2: $79,000 (+2.74%)
TP3: $78,000 (+3.97%)
SL: $82,000 (−0.95%)
Plan: enter only inside the zone, close 50% at TP1, 25% at TP2, 25% at TP3, and move the stop to entry after TP1. Moderate conviction only, keep size light.
Why SHORT? 4/6 signals agree, 2 against.
• The 20-day SMA at $81,801 and 50-day SMA at $81,977 form a layered ceiling directly above price — every recovery attempt is selling into supply.
• Daily RSI at 42.12 sits below the 50 midpoint, keeping momentum in a contraction regime rather than a reversal.
• Bollinger %B at 0.0979 places price just above the lower band at $79,543, with the middle band at $81,801 concentrating supply into the $81,800–$84,100 zone.
Risk: Stochastic %K at 13.48 is deeply oversold and can produce a violent short-cover bounce before the trend resumes.
The trade is a fade of a dead-cat recovery, not a chase. Price is below the 20/50 SMA stack and the taker buy/sell ratio at 0.8573 shows order flow still skewed toward the offer. If buyers reclaim $82,000 on a closing basis, the short is wrong and the layered ceiling has broken.
Does $BTC sweep $79,000 before it reclaims $82,000?
Full setup on the chart below.
My call. Your execution.
Click below for trade 👇
DYOR & manage risk!
$BTC
{future}(BTCUSDT)
Bitcoin is still capped by the 20/50 SMA stack — the bounce is the short
🔴 SHORT $BTC /USDT: expecting price to go DOWN
Bias: SHORT · Leaning
Current Price: $81,067.00
Entry: $81,100 – $81,350
TP1: $80,000 (+1.51%)
TP2: $79,000 (+2.74%)
TP3: $78,000 (+3.97%)
SL: $82,000 (−0.95%)
Plan: enter only inside the zone, close 50% at TP1, 25% at TP2, 25% at TP3, and move the stop to entry after TP1. Moderate conviction only, keep size light.
Why SHORT? 4/6 signals agree, 2 against.
• The 20-day SMA at $81,801 and 50-day SMA at $81,977 form a layered ceiling directly above price — every recovery attempt is selling into supply.
• Daily RSI at 42.12 sits below the 50 midpoint, keeping momentum in a contraction regime rather than a reversal.
• Bollinger %B at 0.0979 places price just above the lower band at $79,543, with the middle band at $81,801 concentrating supply into the $81,800–$84,100 zone.
Risk: Stochastic %K at 13.48 is deeply oversold and can produce a violent short-cover bounce before the trend resumes.
The trade is a fade of a dead-cat recovery, not a chase. Price is below the 20/50 SMA stack and the taker buy/sell ratio at 0.8573 shows order flow still skewed toward the offer. If buyers reclaim $82,000 on a closing basis, the short is wrong and the layered ceiling has broken.
Does $BTC sweep $79,000 before it reclaims $82,000?
Full setup on the chart below.
My call. Your execution.
Click below for trade 👇
DYOR & manage risk!
$BTC
1
994
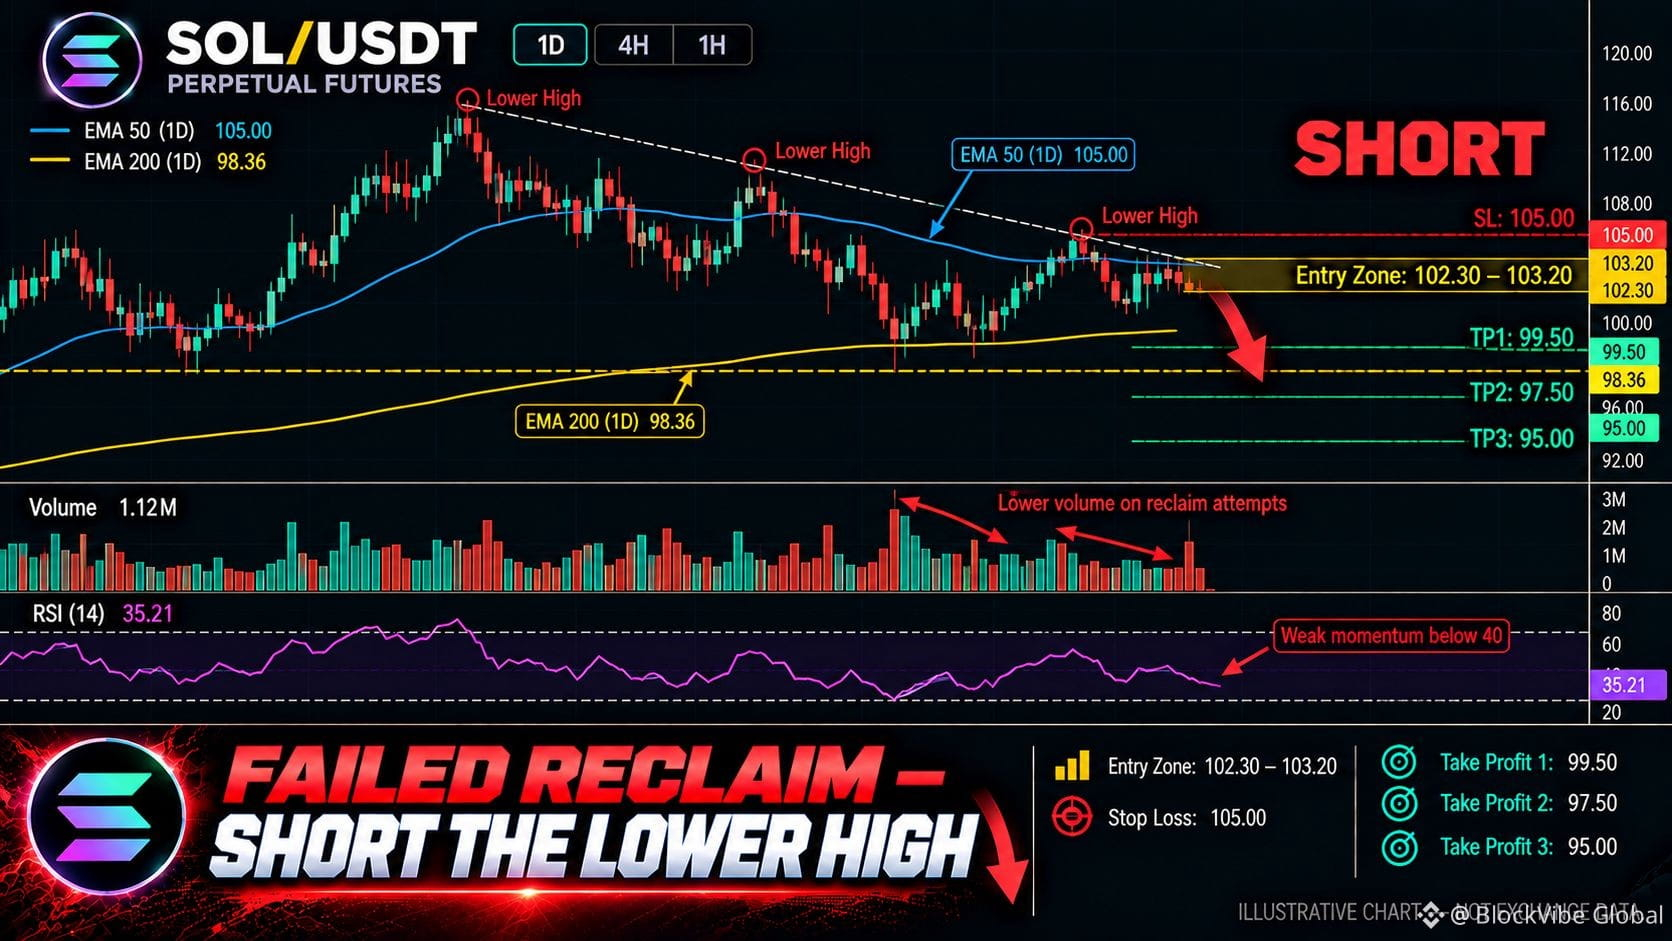
SOL is still pinned under the 50-day EMA — the $100 handle is the battleground
🔴 SHORT $SOL/USDT: expecting price to go DOWN
Bias: SHORT · Leaning
Current Price: $102.00
Entry: $102.30 – $103.20
TP1: $99.50 (+2.46%)
TP2: $97.50 (+4.47%)
TP3: $95.00 (+6.92%)
SL: $105.00 (−2.42%)
Plan: enter only inside the zone, close 50% at TP1, 25% at TP2, 25% at TP3, and move the stop to entry after TP1. Moderate conviction only, keep size light.
Why SHORT? 3/5 signals agree, 2 against.
• Price remains below the 50-day EMA at $105, which is the immediate rejection ceiling, and the 200-day EMA at $98.36 is the last structural floor.
• Daily RSI near 35 hovers just above oversold, and the MACD remains negative — downside momentum is dominant but not accelerating.
• The $100–$102 zone has been tested repeatedly without a volume-backed reclaim, keeping the lower-high sequence intact.
Risk: A 4H close above $105 would reclaim the 50-day EMA and neutralize the lower-high thesis.
The setup is a short into a failing defense of the $100 handle. Price is inside the entry zone, so the risk is defined. If buyers push through $105 on a closing basis, the short is wrong.
Does $SOL lose $99.50 before it reclaims $105?
Full setup on the chart below.
My call. Your execution.
Click below for trade 👇
DYOR & manage risk!
$SOL
{future}(SOLUSDT)
SOL is still pinned under the 50-day EMA — the $100 handle is the battleground
🔴 SHORT $SOL /USDT: expecting price to go DOWN
Bias: SHORT · Leaning
Current Price: $102.00
Entry: $102.30 – $103.20
TP1: $99.50 (+2.46%)
TP2: $97.50 (+4.47%)
TP3: $95.00 (+6.92%)
SL: $105.00 (−2.42%)
Plan: enter only inside the zone, close 50% at TP1, 25% at TP2, 25% at TP3, and move the stop to entry after TP1. Moderate conviction only, keep size light.
Why SHORT? 3/5 signals agree, 2 against.
• Price remains below the 50-day EMA at $105, which is the immediate rejection ceiling, and the 200-day EMA at $98.36 is the last structural floor.
• Daily RSI near 35 hovers just above oversold, and the MACD remains negative — downside momentum is dominant but not accelerating.
• The $100–$102 zone has been tested repeatedly without a volume-backed reclaim, keeping the lower-high sequence intact.
Risk: A 4H close above $105 would reclaim the 50-day EMA and neutralize the lower-high thesis.
The setup is a short into a failing defense of the $100 handle. Price is inside the entry zone, so the risk is defined. If buyers push through $105 on a closing basis, the short is wrong.
Does $SOL lose $99.50 before it reclaims $105?
Full setup on the chart below.
My call. Your execution.
Click below for trade 👇
DYOR & manage risk!
$SOL
483
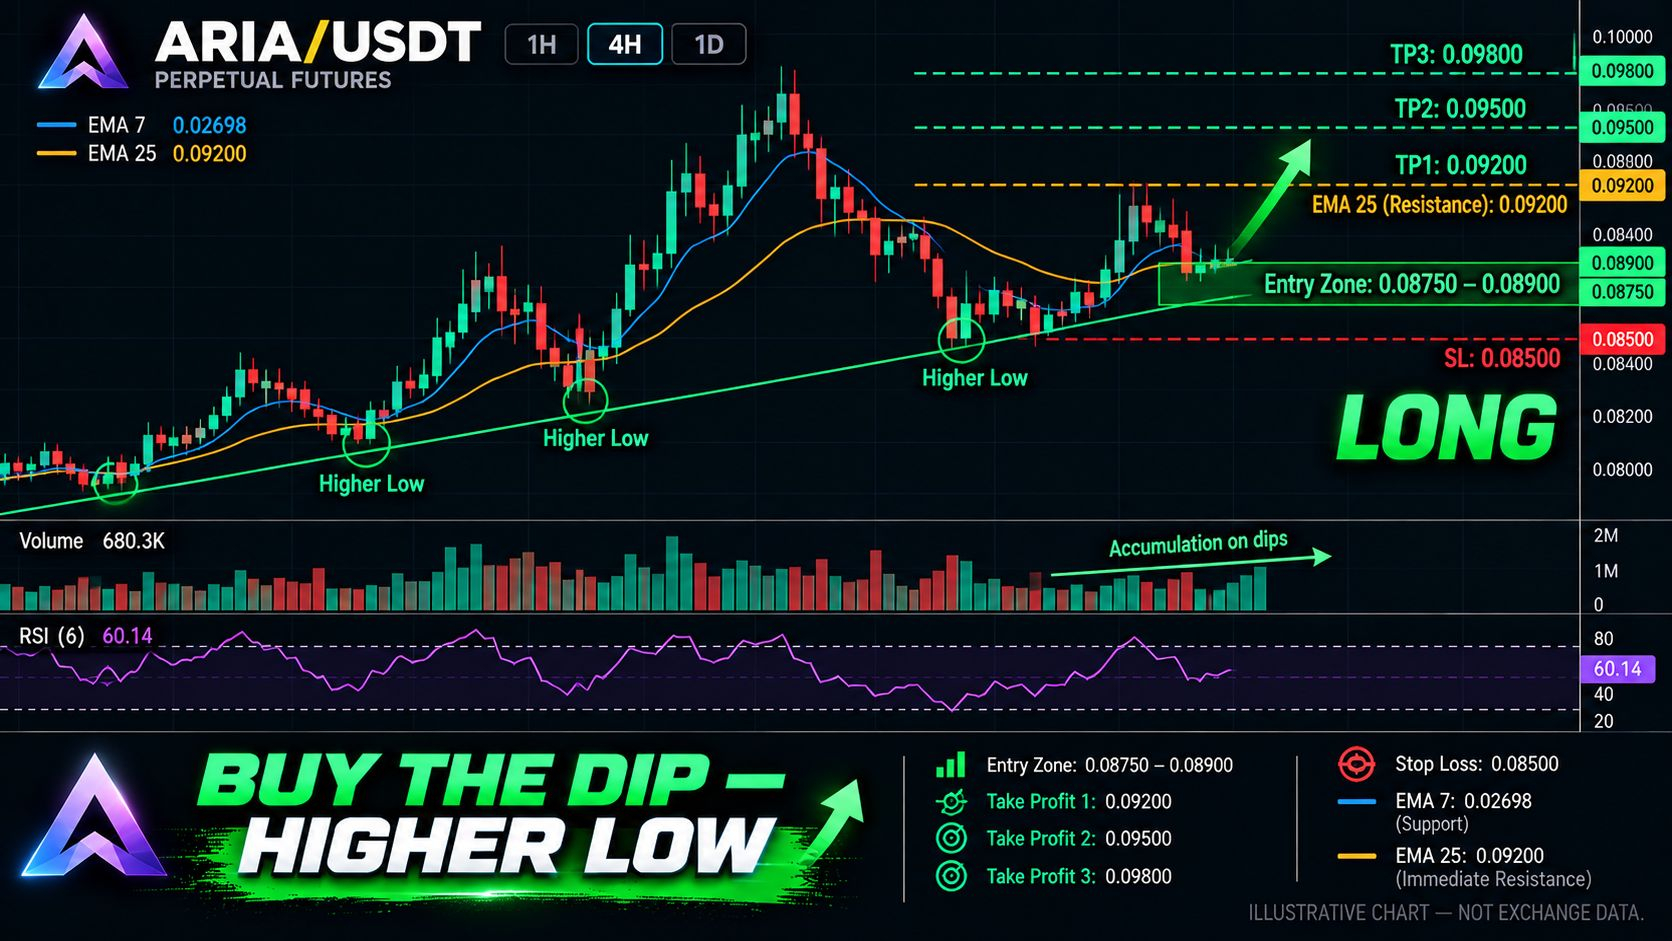
ARIA is holding the higher-low structure — the pullback is the opportunity
🟢 LONG $ARIA/USDT: expecting price to go UP
Bias: LONG · Leaning
Current Price: $0.08912
Entry: $0.08750 – $0.08900
TP1: $0.09200 (+4.25%)
TP2: $0.09500 (+7.65%)
TP3: $0.09800 (+11.05%)
SL: $0.08500 (−3.68%)
Plan: enter only inside the zone, close 50% at TP1, 25% at TP2, 25% at TP3, and consider moving the stop to entry after TP1. Moderate conviction only, keep size light.
Why LONG? 4/6 signals agree, 2 against.
• ARIA has formed a sequence of higher lows since the $0.02251 base, and price is holding above the EMA7 at $0.02698 — the short-term trend structure is constructive.
• RSI6 at 60.42 is above the 50 midline and still rising, which suggests buy-side pressure is building without being overbought.
• The immediate resistance is $0.03022 (EMA25), and a daily close above it would open the $0.0325–$0.035 extension.
The setup is a higher-low continuation, not a breakout chase. The entry zone spans the EMA7 and the $0.08750 support shelf, giving a defined invalidation below $0.08500. If price loses that level, the higher-low structure is broken and the long is wrong. The main risk is a rejection at the $0.09200 EMA25, which would keep price range-bound.
Does $ARIA clear $0.09200 on the first attempt, or does it need one more higher-low test before the breakout?
Full setup on the chart below.
My call. Your execution.
Click below for trade 👇
DYOR & manage risk!
$ARIA
{future}(ARIAUSDT)
ARIA is holding the higher-low structure — the pullback is the opportunity
🟢 LONG $ARIA /USDT: expecting price to go UP
Bias: LONG · Leaning
Current Price: $0.08912
Entry: $0.08750 – $0.08900
TP1: $0.09200 (+4.25%)
TP2: $0.09500 (+7.65%)
TP3: $0.09800 (+11.05%)
SL: $0.08500 (−3.68%)
Plan: enter only inside the zone, close 50% at TP1, 25% at TP2, 25% at TP3, and consider moving the stop to entry after TP1. Moderate conviction only, keep size light.
Why LONG? 4/6 signals agree, 2 against.
• ARIA has formed a sequence of higher lows since the $0.02251 base, and price is holding above the EMA7 at $0.02698 — the short-term trend structure is constructive.
• RSI6 at 60.42 is above the 50 midline and still rising, which suggests buy-side pressure is building without being overbought.
• The immediate resistance is $0.03022 (EMA25), and a daily close above it would open the $0.0325–$0.035 extension.
The setup is a higher-low continuation, not a breakout chase. The entry zone spans the EMA7 and the $0.08750 support shelf, giving a defined invalidation below $0.08500. If price loses that level, the higher-low structure is broken and the long is wrong. The main risk is a rejection at the $0.09200 EMA25, which would keep price range-bound.
Does $ARIA clear $0.09200 on the first attempt, or does it need one more higher-low test before the breakout?
Full setup on the chart below.
My call. Your execution.
Click below for trade 👇
DYOR & manage risk!
$ARIA
383
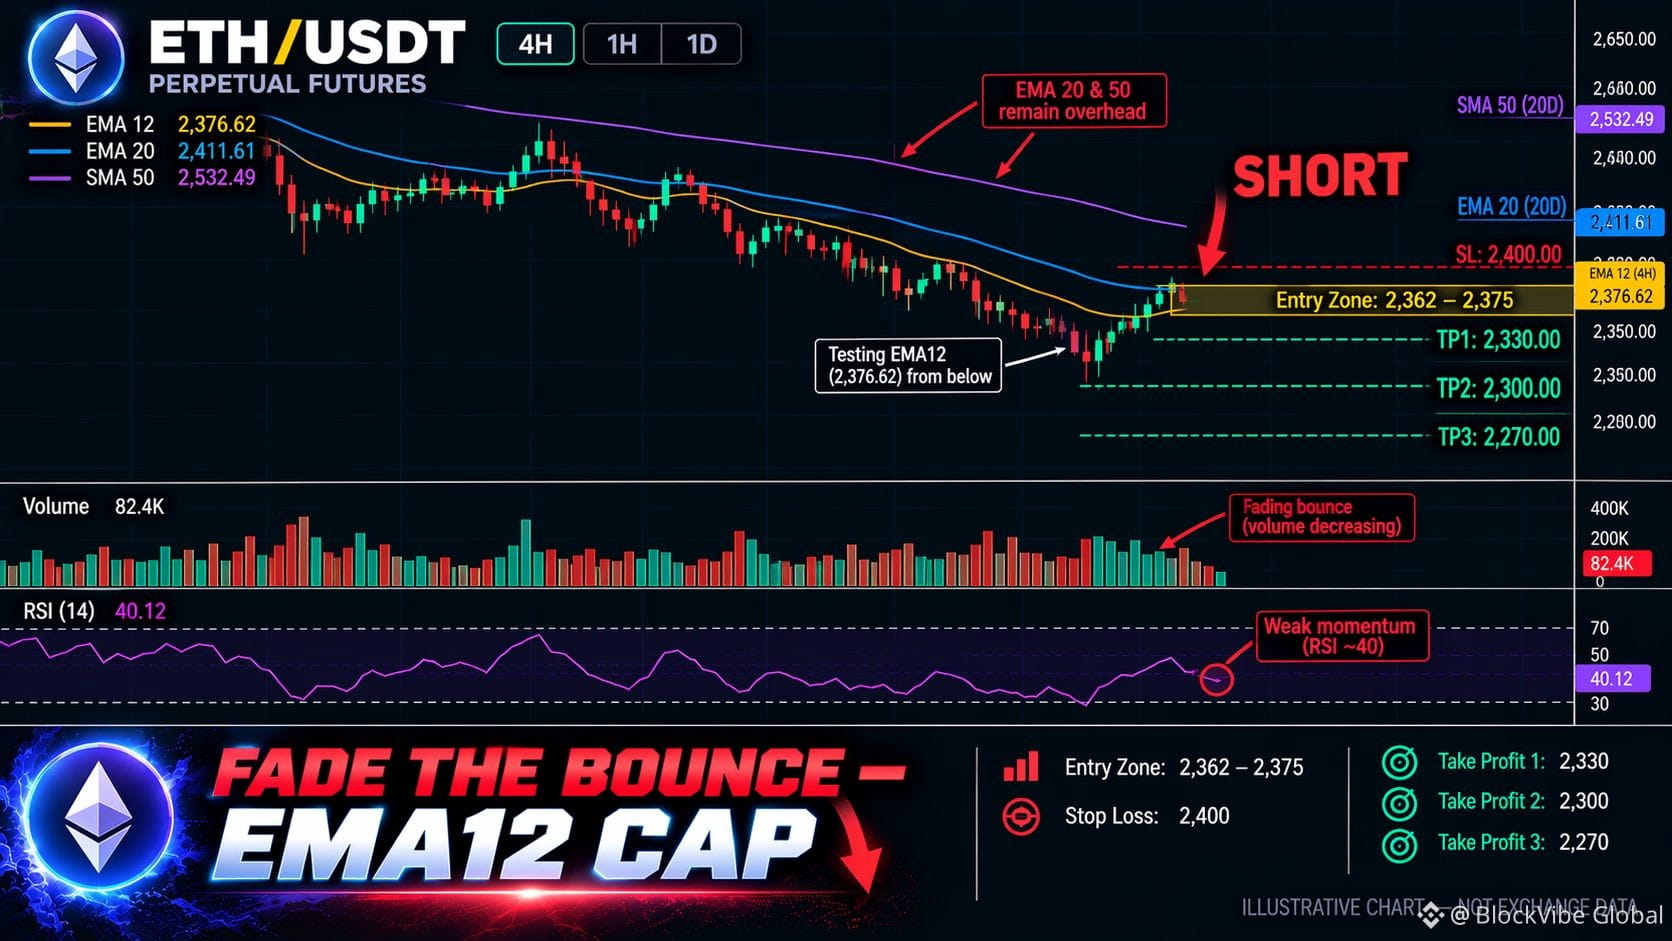
ETH is still capped by the EMA12 — the bounce is a short into resistance
🔴 SHORT $ETH/USDT: expecting price to go DOWN
Bias: SHORT · Leaning
Current Price: $2,359.00
Entry: $2,362.00 – $2,375.00
TP1: $2,330.00 (+1.57%)
TP2: $2,300.00 (+2.84%)
TP3: $2,270.00 (+4.11%)
SL: $2,400.00 (−1.54%)
Plan: enter only inside the zone, close 50% at TP1, 25% at TP2, 25% at TP3, and move the stop to entry after TP1. Moderate conviction only, keep size light.
Why SHORT? 4/6 signals agree, 2 against.
• Price is above the 7-day SMA at $2,346 but still below the EMA12 at $2,376.62, the 20-day at $2,411.61, and the 50-day at $2,532.49 — the broader stack remains overhead.
• Daily RSI recovered from 34.71 but is still below the 50 midline, and the Stochastic %K at 12.21 remains deeply oversold — a relief bounce, not a trend reversal.
• Bollinger %B at 0.0928 placed price near the lower band at $2,289.61; the midline at $2,411.61 is the real ceiling.
Risk: A 4H close above $2,400 would reclaim the EMA12 and force a re-map toward the $2,411 midline.
The bounce is corrective. Price is testing the EMA12 from below, and the 20/50 SMA stack still caps the upside. If buyers reclaim $2,400 on a closing basis, the short is wrong and the structure has shifted.
Does $ETH reject $2,375 and flush to $2,300, or does it squeeze through $2,400 first?
Full setup on the chart below.
My call. Your execution.
Click below for trade 👇
DYOR & manage risk!
$ETH
{future}(ETHUSDT)
ETH is still capped by the EMA12 — the bounce is a short into resistance
🔴 SHORT $ETH /USDT: expecting price to go DOWN
Bias: SHORT · Leaning
Current Price: $2,359.00
Entry: $2,362.00 – $2,375.00
TP1: $2,330.00 (+1.57%)
TP2: $2,300.00 (+2.84%)
TP3: $2,270.00 (+4.11%)
SL: $2,400.00 (−1.54%)
Plan: enter only inside the zone, close 50% at TP1, 25% at TP2, 25% at TP3, and move the stop to entry after TP1. Moderate conviction only, keep size light.
Why SHORT? 4/6 signals agree, 2 against.
• Price is above the 7-day SMA at $2,346 but still below the EMA12 at $2,376.62, the 20-day at $2,411.61, and the 50-day at $2,532.49 — the broader stack remains overhead.
• Daily RSI recovered from 34.71 but is still below the 50 midline, and the Stochastic %K at 12.21 remains deeply oversold — a relief bounce, not a trend reversal.
• Bollinger %B at 0.0928 placed price near the lower band at $2,289.61; the midline at $2,411.61 is the real ceiling.
Risk: A 4H close above $2,400 would reclaim the EMA12 and force a re-map toward the $2,411 midline.
The bounce is corrective. Price is testing the EMA12 from below, and the 20/50 SMA stack still caps the upside. If buyers reclaim $2,400 on a closing basis, the short is wrong and the structure has shifted.
Does $ETH reject $2,375 and flush to $2,300, or does it squeeze through $2,400 first?
Full setup on the chart below.
My call. Your execution.
Click below for trade 👇
DYOR & manage risk!
$ETH
2
402
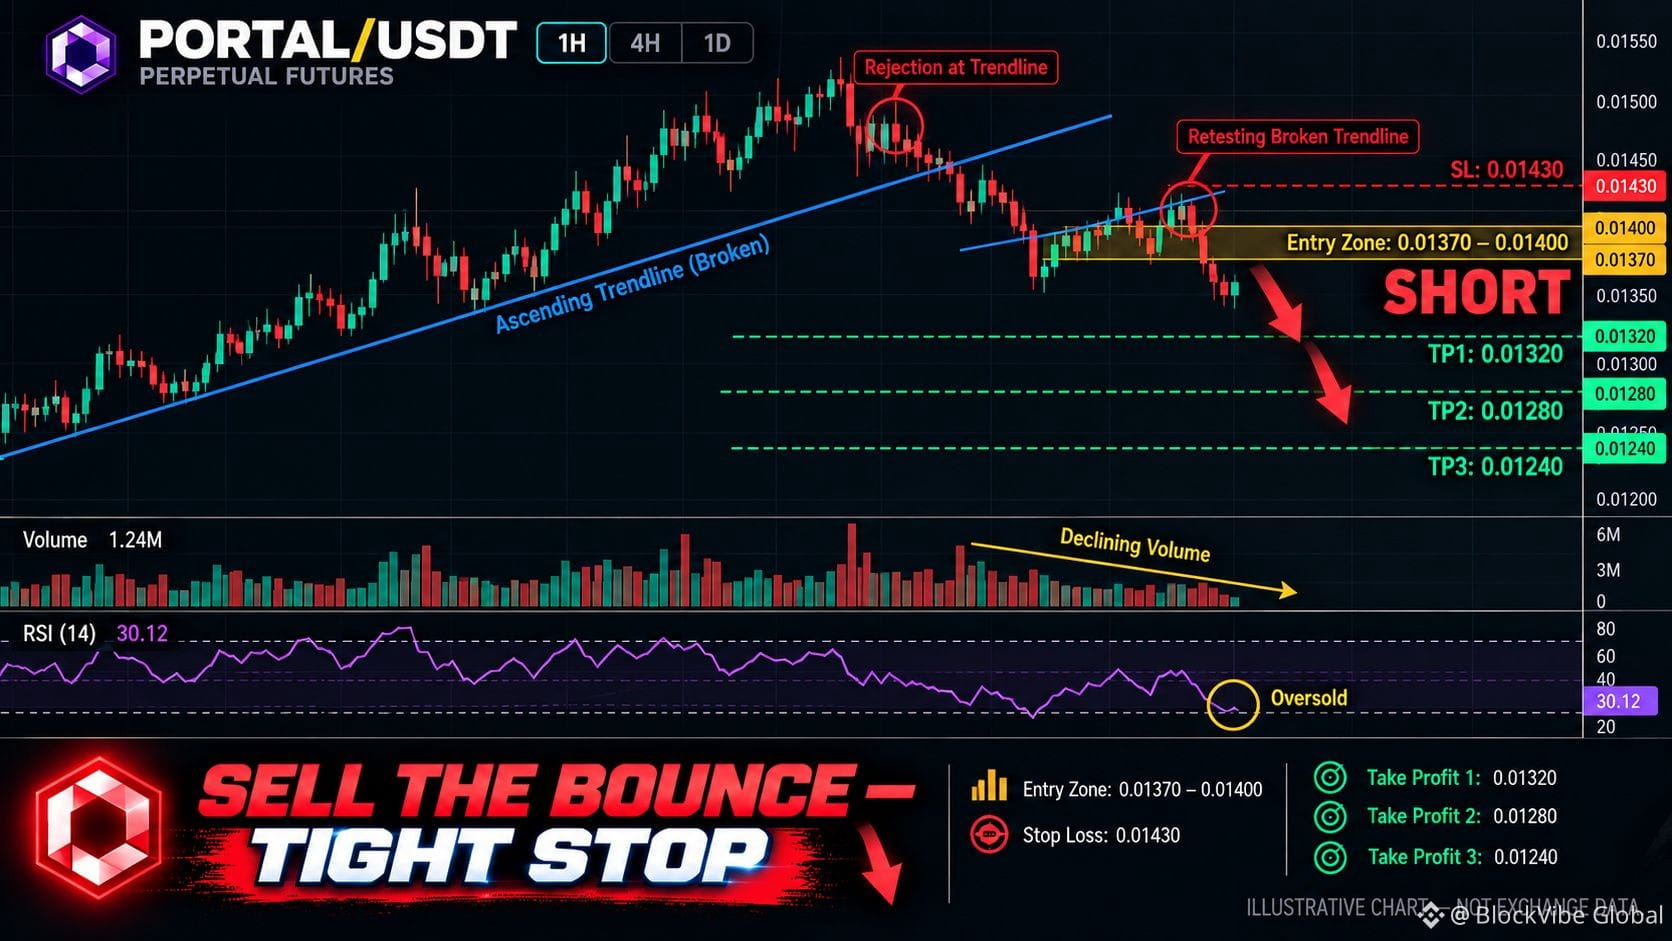
PORTAL is oversold on the 1H — the bounce is the short
🔴 SHORT $PORTAL/USDT: expecting price to go DOWN
Bias: SHORT · Leaning
Current Price: $0.01353
Entry: $0.01370 – $0.01400
TP1: $0.01320 (+4.69%)
TP2: $0.01280 (+7.58%)
TP3: $0.01240 (+10.47%)
SL: $0.01430 (−3.25%)
Plan: enter only inside the zone, close 50% at TP1, 25% at TP2, 25% at TP3, and consider moving the stop to entry after TP1. Moderate conviction only, keep size light.
Why SHORT? 3/5 signals agree, 2 against.
• The 1H RSI is already at the oversold threshold near 30, which means the immediate downside is stretched — the better short entry is a bounce into $0.01370–$0.01400, not a chase at current price.
• Price is testing an ascending trendline breakdown area, and the broader 1H structure remains bearish after the failure at the trendline support.
• The $0.01320 level is the first downside liquidity reference, with $0.01280 and $0.01240 below it.
The tape is oversold enough that a relief bounce is more likely than a straight flush. The trade is to sell that bounce into the $0.01370–$0.01400 zone, with a hard stop above $0.01430. If price reclaims $0.01430, the oversold bounce has become a reversal and the short is wrong.
Would you short the first touch of $0.01370, or wait for a lower-high confirmation on the 15m?
Levels mapped on the chart below.
My call. Your execution.
Click below for trade 👇
DYOR & manage risk!
$PORTAL
{future}(PORTALUSDT)
PORTAL is oversold on the 1H — the bounce is the short
🔴 SHORT $PORTAL /USDT: expecting price to go DOWN
Bias: SHORT · Leaning
Current Price: $0.01353
Entry: $0.01370 – $0.01400
TP1: $0.01320 (+4.69%)
TP2: $0.01280 (+7.58%)
TP3: $0.01240 (+10.47%)
SL: $0.01430 (−3.25%)
Plan: enter only inside the zone, close 50% at TP1, 25% at TP2, 25% at TP3, and consider moving the stop to entry after TP1. Moderate conviction only, keep size light.
Why SHORT? 3/5 signals agree, 2 against.
• The 1H RSI is already at the oversold threshold near 30, which means the immediate downside is stretched — the better short entry is a bounce into $0.01370–$0.01400, not a chase at current price.
• Price is testing an ascending trendline breakdown area, and the broader 1H structure remains bearish after the failure at the trendline support.
• The $0.01320 level is the first downside liquidity reference, with $0.01280 and $0.01240 below it.
The tape is oversold enough that a relief bounce is more likely than a straight flush. The trade is to sell that bounce into the $0.01370–$0.01400 zone, with a hard stop above $0.01430. If price reclaims $0.01430, the oversold bounce has become a reversal and the short is wrong.
Would you short the first touch of $0.01370, or wait for a lower-high confirmation on the 15m?
Levels mapped on the chart below.
My call. Your execution.
Click below for trade 👇
DYOR & manage risk!
$PORTAL
1
316
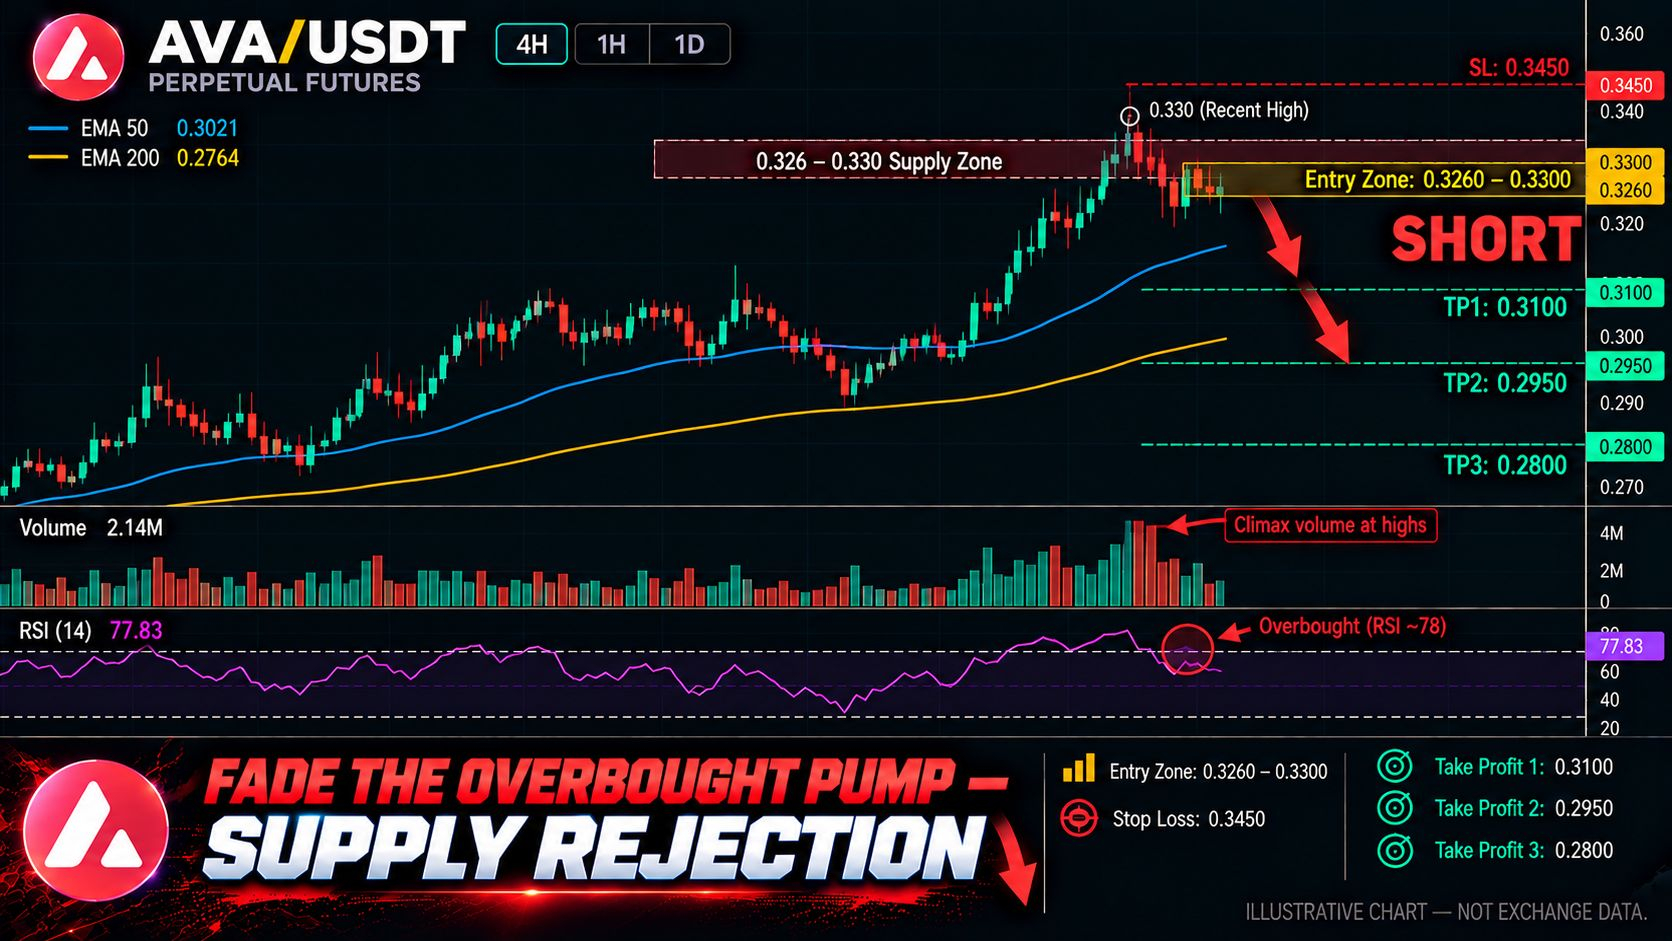
AVA is overbought after a 30% run — the pullback is the short
🔴 SHORT $AVA/USDT: expecting price to go DOWN
Bias: SHORT · Leaning
Current Price: $0.3245
Entry: $0.3260 – $0.3300
TP1: $0.3100 (+5.49%)
TP2: $0.2950 (+10.06%)
TP3: $0.2800 (+14.63%)
SL: $0.3450 (−5.18%)
Plan: enter only inside the zone, close 50% at TP1, 25% at TP2, 25% at TP3, and move the stop to entry after TP1. Moderate conviction only, keep size light.
Why SHORT? 4/6 signals agree, 2 against.
• AVA rallied over 30% and the 4H RSI reached 78–82, a deeply overbought condition that preceded a rejection at the $0.33 resistance.
• Price is now rolling over from the $0.326–$0.330 supply zone, with the $0.3100 level as the first downside target and $0.2800 as the deeper liquidity reference.
• The 4H trend has shifted bearish with consecutive red candles, and the 99-day moving average at $0.243 remains the longer-term floor.
Risk: A 4H close above $0.345 would invalidate the rejection and open a retest of the $0.4758 highs.
AVA is a momentum fade, not a trend reversal call. The entry is placed at the $0.326–$0.330 supply zone where the last rejection occurred, so the stop is tight above $0.345. If buyers reclaim that level on a closing basis, the short is wrong.
Does $AVA reject $0.330 and flush to $0.310, or does it squeeze back to $0.345 first?
Full setup on the chart below.
My call. Your execution.
Click below for trade 👇
DYOR & manage risk!
$AVA
{future}(AVAUSDT)
AVA is overbought after a 30% run — the pullback is the short
🔴 SHORT $AVA /USDT: expecting price to go DOWN
Bias: SHORT · Leaning
Current Price: $0.3245
Entry: $0.3260 – $0.3300
TP1: $0.3100 (+5.49%)
TP2: $0.2950 (+10.06%)
TP3: $0.2800 (+14.63%)
SL: $0.3450 (−5.18%)
Plan: enter only inside the zone, close 50% at TP1, 25% at TP2, 25% at TP3, and move the stop to entry after TP1. Moderate conviction only, keep size light.
Why SHORT? 4/6 signals agree, 2 against.
• AVA rallied over 30% and the 4H RSI reached 78–82, a deeply overbought condition that preceded a rejection at the $0.33 resistance.
• Price is now rolling over from the $0.326–$0.330 supply zone, with the $0.3100 level as the first downside target and $0.2800 as the deeper liquidity reference.
• The 4H trend has shifted bearish with consecutive red candles, and the 99-day moving average at $0.243 remains the longer-term floor.
Risk: A 4H close above $0.345 would invalidate the rejection and open a retest of the $0.4758 highs.
AVA is a momentum fade, not a trend reversal call. The entry is placed at the $0.326–$0.330 supply zone where the last rejection occurred, so the stop is tight above $0.345. If buyers reclaim that level on a closing basis, the short is wrong.
Does $AVA reject $0.330 and flush to $0.310, or does it squeeze back to $0.345 first?
Full setup on the chart below.
My call. Your execution.
Click below for trade 👇
DYOR & manage risk!
$AVA
275
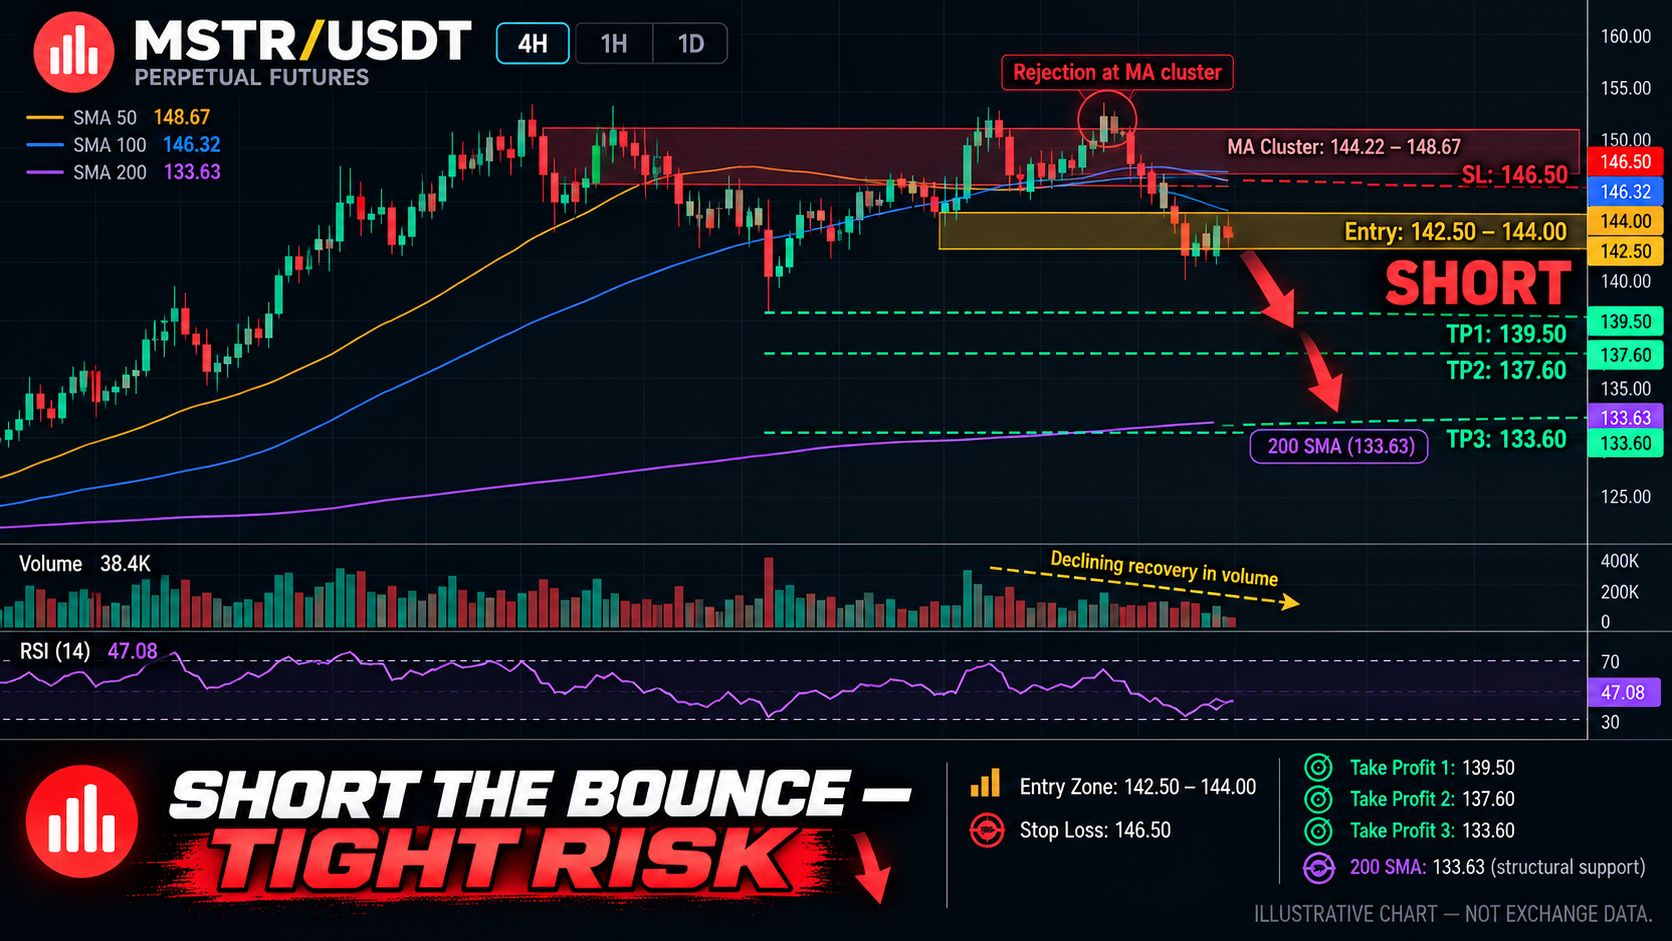
MSTR is bouncing into a moving-average wall
🔴 SHORT $MSTR/USDT: expecting price to go DOWN
Bias: SHORT · Leaning
Current Price: $142.00
Entry: $142.50 – $144.00
TP1: $139.50 (+2.55%)
TP2: $137.60 (+3.86%)
TP3: $133.60 (+6.59%)
SL: $146.50 (−2.07%)
Plan: enter only inside the zone, close 50% at TP1, 25% at TP2, 25% at TP3, and consider moving the stop to entry after TP1. Moderate conviction only, keep size light.
Why SHORT? 4/6 signals agree, 2 against.
• The EMA12 at $144.22, SMA20 at $145.54, and strong resistance at $148.67 form a tight overhead cluster — the bounce is stalling directly into supply.
• Open interest fell 7.32% during the recovery, which points to short covering rather than fresh directional demand.
• The 200-day SMA at $133.63 is the next structural magnet below, and the $137.60 level is the nearest liquidity pocket beneath current price.
The recovery has the footprint of a squeeze, not a reversal. Price is back at the 7-day SMA but has not produced a clean close above it. If the $144.00 ceiling holds, the short targets the $139.50–$137.60 shelf first. A 4H close above 146.50wouldneutralizetheidea.Does146.50wouldneutralizetheidea.DoesMSTR need to tag $148.67 before the $137.60 liquidity pocket gets filled?
Levels mapped on the chart below.
My call. Your execution.
Click below for trade 👇
DYOR & manage risk!
$MSTR
{future}(MSTRUSDT)
MSTR is bouncing into a moving-average wall
🔴 SHORT $MSTR /USDT: expecting price to go DOWN
Bias: SHORT · Leaning
Current Price: $142.00
Entry: $142.50 – $144.00
TP1: $139.50 (+2.55%)
TP2: $137.60 (+3.86%)
TP3: $133.60 (+6.59%)
SL: $146.50 (−2.07%)
Plan: enter only inside the zone, close 50% at TP1, 25% at TP2, 25% at TP3, and consider moving the stop to entry after TP1. Moderate conviction only, keep size light.
Why SHORT? 4/6 signals agree, 2 against.
• The EMA12 at $144.22, SMA20 at $145.54, and strong resistance at $148.67 form a tight overhead cluster — the bounce is stalling directly into supply.
• Open interest fell 7.32% during the recovery, which points to short covering rather than fresh directional demand.
• The 200-day SMA at $133.63 is the next structural magnet below, and the $137.60 level is the nearest liquidity pocket beneath current price.
The recovery has the footprint of a squeeze, not a reversal. Price is back at the 7-day SMA but has not produced a clean close above it. If the $144.00 ceiling holds, the short targets the $139.50–$137.60 shelf first. A 4H close above 146.50wouldneutralizetheidea.Does146.50wouldneutralizetheidea.DoesMSTR need to tag $148.67 before the $137.60 liquidity pocket gets filled?
Levels mapped on the chart below.
My call. Your execution.
Click below for trade 👇
DYOR & manage risk!
$MSTR
1
318
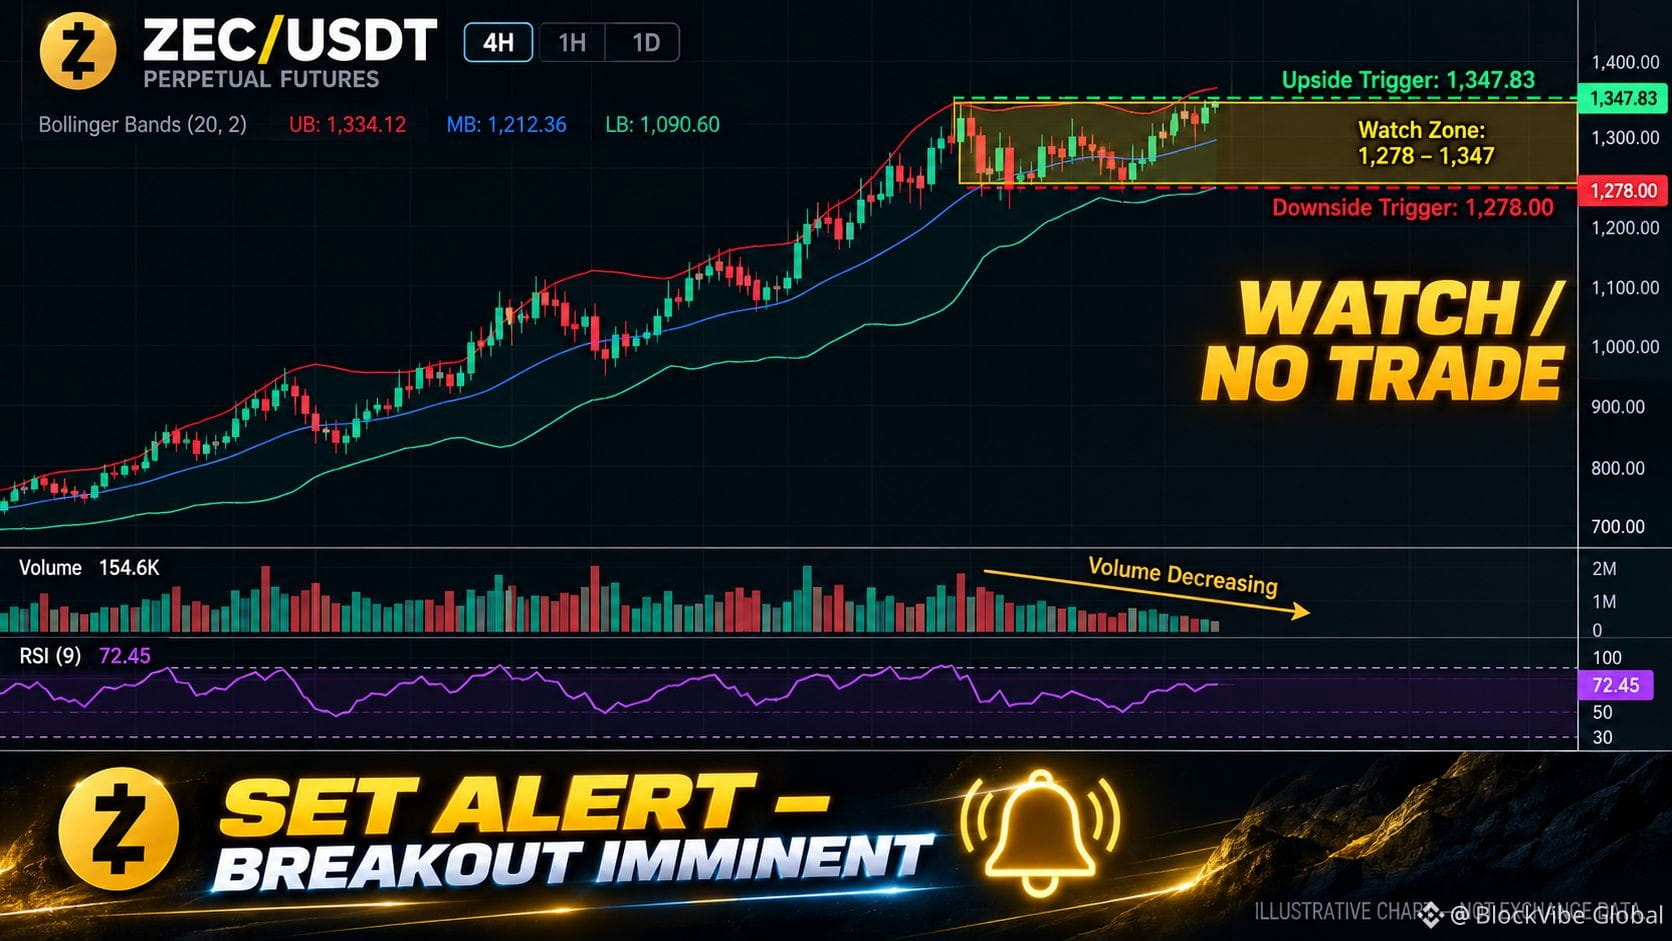
ZEC is overbought, but the trend is not broken — wait for the trigger
🟡 WATCH $ZEC/USDT — NO TRADE
Bias: NEUTRAL · No Trade
Current Price: $1,304.00
Upside Trigger: 4H close above $1,347.83 with expanding volume
Downside Trigger: 4H close below $1,278.00 with expanding volume
Why NO TRADE? Technical evidence is conflicting.
• The 4H EMA5–EMA30 stack is fully bullish, and price is riding the upper Bollinger band near $1,334 — trend structure is intact.
• RSI9 at 72.45 and KDJ J-value at 94.55 are both in overbought territory, and volume is contracting on the high-level consolidation — momentum is stretched.
• The next resistance is $1,347.83; below, the first meaningful support is $1,278.00, leaving a wide no-trade gap around current price.
Plan: no entry until either trigger confirms. A 4H close above $1,347.83 opens a continuation long toward $1,365–$1,384. A 4H close below $1,278.00 invalidates the short-term bullish structure and opens a deeper retrace. Sitting on hands inside the range is the trade.
Would you pre-position for the $1,347 break, or wait for the retest of $1,278 to fail first?
Chart with every level below.
My call. Your execution.
Click below for trade 👇
DYOR & manage risk!
$ZEC
{future}(ZECUSDT)
ZEC is overbought, but the trend is not broken — wait for the trigger
🟡 WATCH $ZEC /USDT — NO TRADE
Bias: NEUTRAL · No Trade
Current Price: $1,304.00
Upside Trigger: 4H close above $1,347.83 with expanding volume
Downside Trigger: 4H close below $1,278.00 with expanding volume
Why NO TRADE? Technical evidence is conflicting.
• The 4H EMA5–EMA30 stack is fully bullish, and price is riding the upper Bollinger band near $1,334 — trend structure is intact.
• RSI9 at 72.45 and KDJ J-value at 94.55 are both in overbought territory, and volume is contracting on the high-level consolidation — momentum is stretched.
• The next resistance is $1,347.83; below, the first meaningful support is $1,278.00, leaving a wide no-trade gap around current price.
Plan: no entry until either trigger confirms. A 4H close above $1,347.83 opens a continuation long toward $1,365–$1,384. A 4H close below $1,278.00 invalidates the short-term bullish structure and opens a deeper retrace. Sitting on hands inside the range is the trade.
Would you pre-position for the $1,347 break, or wait for the retest of $1,278 to fail first?
Chart with every level below.
My call. Your execution.
Click below for trade 👇
DYOR & manage risk!
$ZEC
1
843
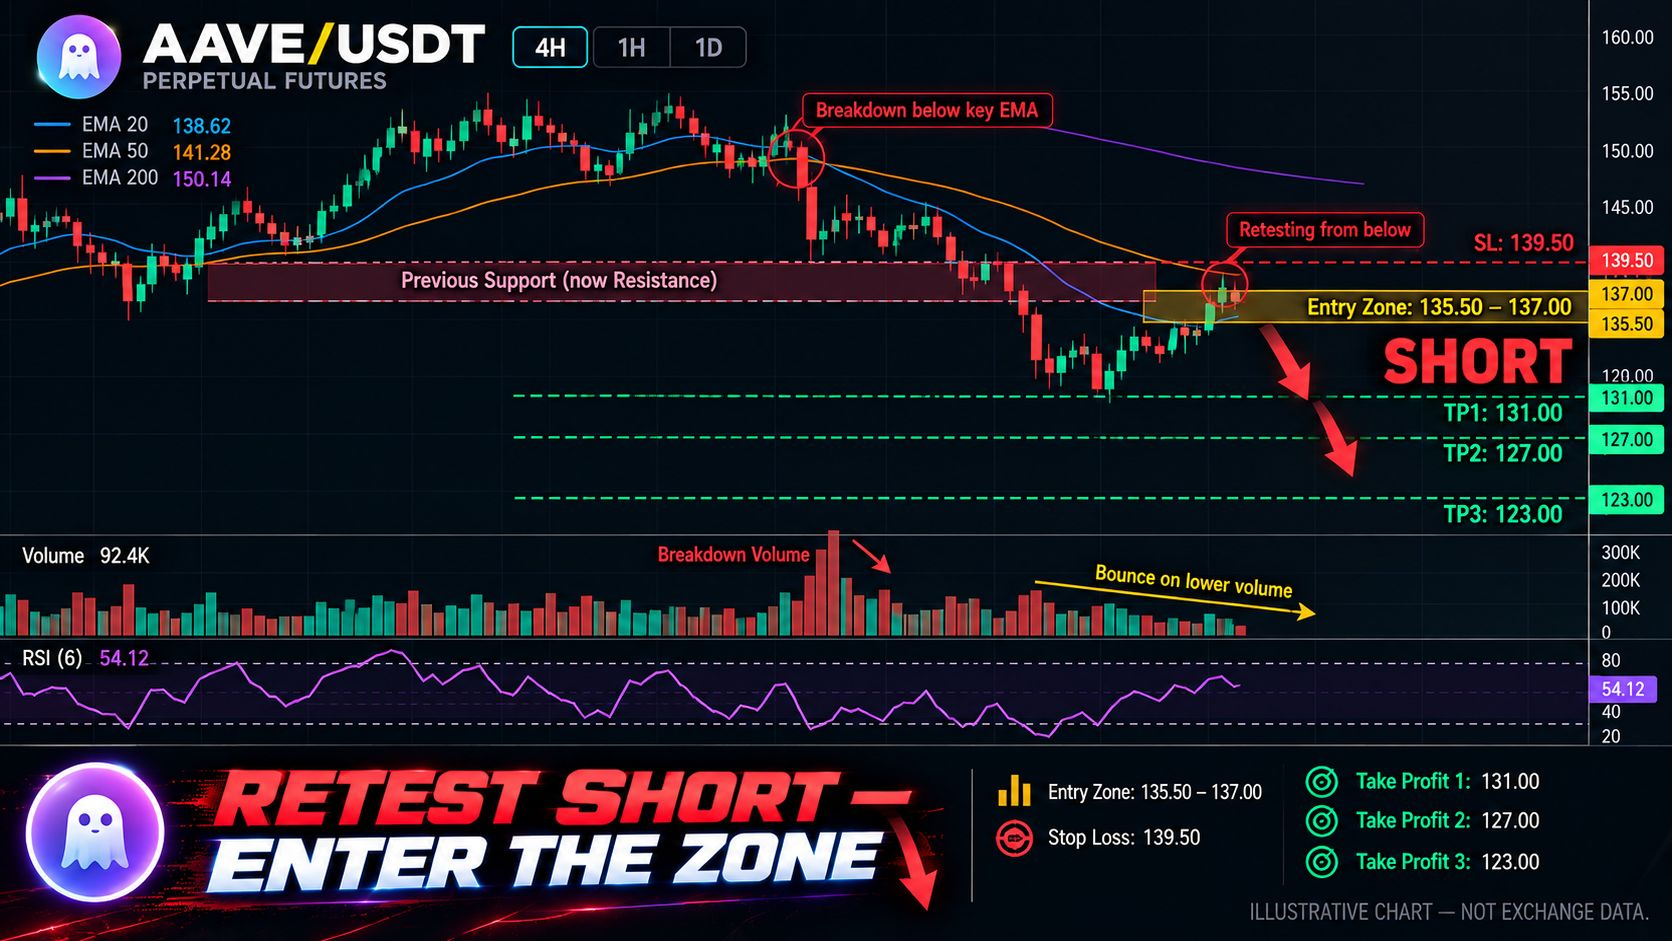
AAVE is retesting the breakdown — the short is the retest, not the flush
🔴 SHORT $AAVE/USDT: expecting price to go DOWN
Bias: SHORT · Leaning
Current Price: $135.00
Entry: $135.50 – $137.00
TP1: $131.00 (+3.11%)
TP2: $127.00 (+6.01%)
TP3: $123.00 (+8.91%)
SL: $139.50 (−2.57%)
Plan: enter only inside the zone, close 50% at TP1, 25% at TP2, 25% at TP3, and consider moving the stop to entry after TP1. Moderate conviction only, keep size light.
Why SHORT? 3/5 signals agree, 2 against.
• Price is below the key EMA that was broken on the way down, and the $135.50–$137.00 zone is the retest of that breakdown.
• RSI6 has recovered from 18.8 to 54.7, which is a dead-cat bounce profile — momentum is improving inside a broken structure, not reversing it.
• The $131 handle is the first liquidity shelf below; a loss there exposes the $127–$123 range.
The setup is a retest short, not a breakdown chase. Price is already at the lower end of the entry zone, so the risk is defined. If buyers reclaim $139.50 on a closing basis, the breakdown has failed and the short is wrong.
Would you take the retest at $135.50, or wait for a rejection wick at $137 to confirm supply?
Full setup on the chart below.
My call. Your execution.
Click below for trade 👇
DYOR & manage risk!
$AAVE
{future}(AAVEUSDT)
AAVE is retesting the breakdown — the short is the retest, not the flush
🔴 SHORT $AAVE /USDT: expecting price to go DOWN
Bias: SHORT · Leaning
Current Price: $135.00
Entry: $135.50 – $137.00
TP1: $131.00 (+3.11%)
TP2: $127.00 (+6.01%)
TP3: $123.00 (+8.91%)
SL: $139.50 (−2.57%)
Plan: enter only inside the zone, close 50% at TP1, 25% at TP2, 25% at TP3, and consider moving the stop to entry after TP1. Moderate conviction only, keep size light.
Why SHORT? 3/5 signals agree, 2 against.
• Price is below the key EMA that was broken on the way down, and the $135.50–$137.00 zone is the retest of that breakdown.
• RSI6 has recovered from 18.8 to 54.7, which is a dead-cat bounce profile — momentum is improving inside a broken structure, not reversing it.
• The $131 handle is the first liquidity shelf below; a loss there exposes the $127–$123 range.
The setup is a retest short, not a breakdown chase. Price is already at the lower end of the entry zone, so the risk is defined. If buyers reclaim $139.50 on a closing basis, the breakdown has failed and the short is wrong.
Would you take the retest at $135.50, or wait for a rejection wick at $137 to confirm supply?
Full setup on the chart below.
My call. Your execution.
Click below for trade 👇
DYOR & manage risk!
$AAVE
2
396
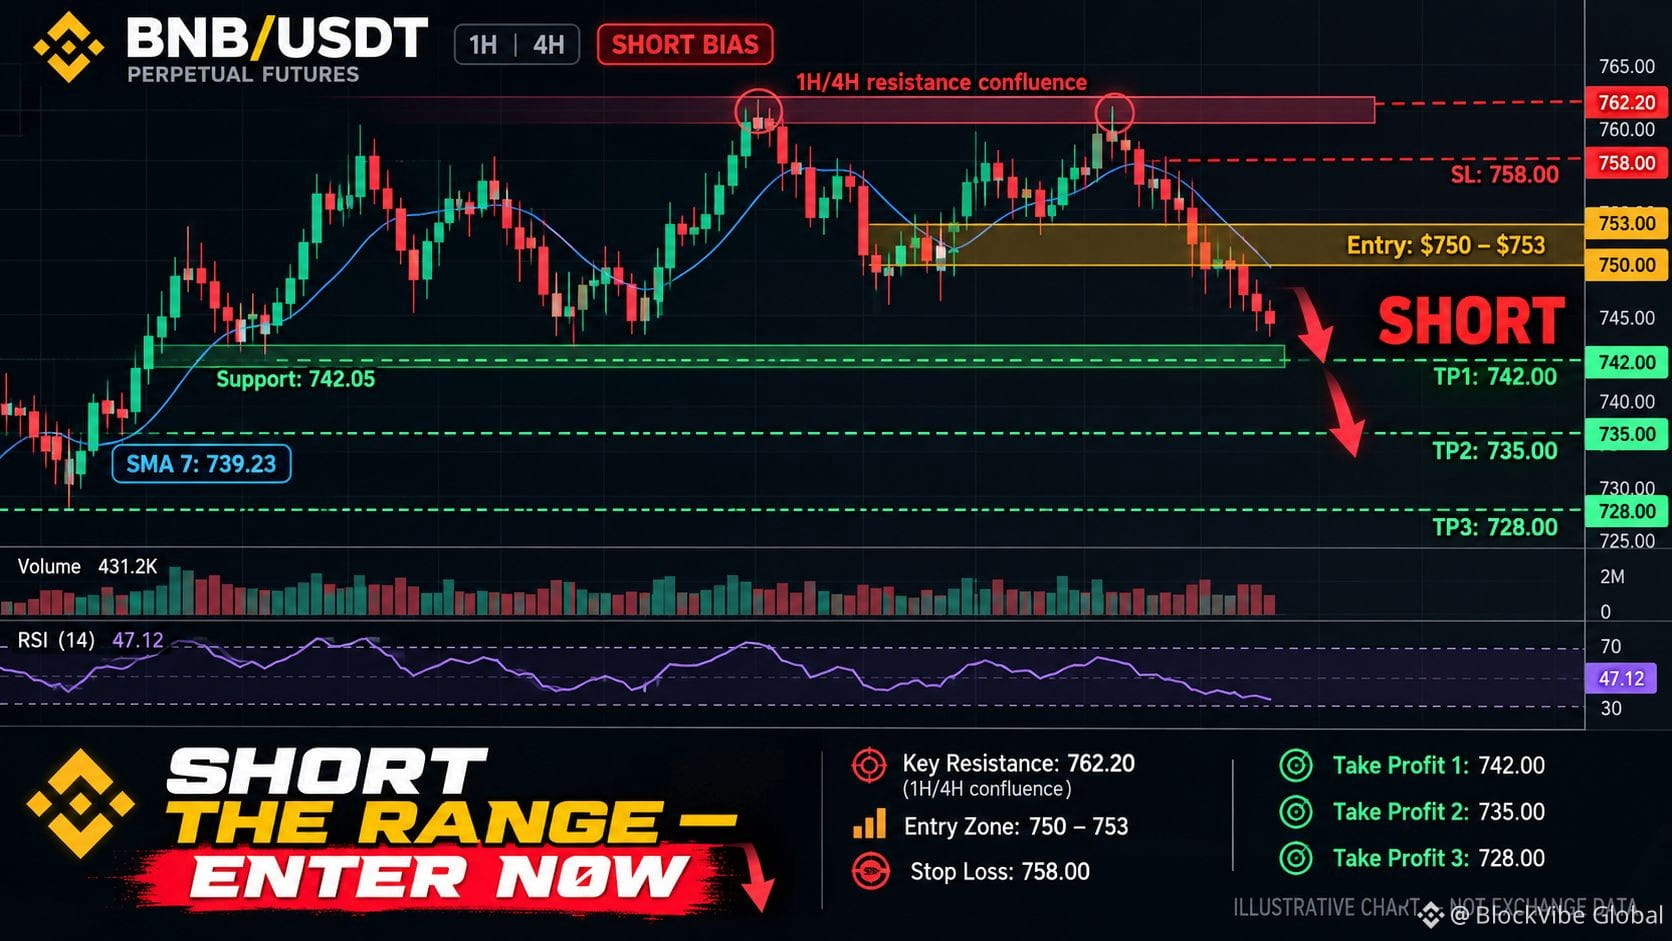
BNB is pinned under a flat 50-day SMA — the range is the trade
🔴 SHORT $BNB/USDT: expecting price to go DOWN
Bias: SHORT · Leaning
Current Price: $749.00
Entry: $750.00 – $753.00
TP1: $742.00 (+1.33%)
TP2: $735.00 (+2.26%)
TP3: $728.00 (+3.19%)
SL: $758.00 (−0.93%)
Plan: enter only inside the zone, close 50% at TP1, 25% at TP2, 25% at TP3, and consider moving the stop to entry after TP1. Moderate conviction only, keep size light.
Why SHORT? 4/6 signals agree, 2 against.
• The 1H and 4H resistance converge at $762.20, and the 7-day SMA at $739.23 is the only immediate buffer below price; a break there exposes $732.45.
• Daily RSI at 47.06 remains below the 50 midline, keeping momentum neutral-to-weak rather than bullish.
• The 50-day SMA at $749.80 sits almost exactly at current price — a flat, non-trending ceiling that has rejected price repeatedly.
The tape shows a defined range with a heavy offer at $762. If buyers cannot absorb that level on a closing basis, the path of least resistance is a rotation back into the $742–$732 demand shelf. The opposing risk is a volume breakout above $762.20, which would flip the short-term bias.
Does $BNB sweep $732.45 before it closes above $762.20?
Full setup on the chart below.
My call. Your execution.
Click below for trade 👇
DYOR & manage risk!
$BNB
{future}(BNBUSDT)
BNB is pinned under a flat 50-day SMA — the range is the trade
🔴 SHORT $BNB /USDT: expecting price to go DOWN
Bias: SHORT · Leaning
Current Price: $749.00
Entry: $750.00 – $753.00
TP1: $742.00 (+1.33%)
TP2: $735.00 (+2.26%)
TP3: $728.00 (+3.19%)
SL: $758.00 (−0.93%)
Plan: enter only inside the zone, close 50% at TP1, 25% at TP2, 25% at TP3, and consider moving the stop to entry after TP1. Moderate conviction only, keep size light.
Why SHORT? 4/6 signals agree, 2 against.
• The 1H and 4H resistance converge at $762.20, and the 7-day SMA at $739.23 is the only immediate buffer below price; a break there exposes $732.45.
• Daily RSI at 47.06 remains below the 50 midline, keeping momentum neutral-to-weak rather than bullish.
• The 50-day SMA at $749.80 sits almost exactly at current price — a flat, non-trending ceiling that has rejected price repeatedly.
The tape shows a defined range with a heavy offer at $762. If buyers cannot absorb that level on a closing basis, the path of least resistance is a rotation back into the $742–$732 demand shelf. The opposing risk is a volume breakout above $762.20, which would flip the short-term bias.
Does $BNB sweep $732.45 before it closes above $762.20?
Full setup on the chart below.
My call. Your execution.
Click below for trade 👇
DYOR & manage risk!
$BNB
1
2
480
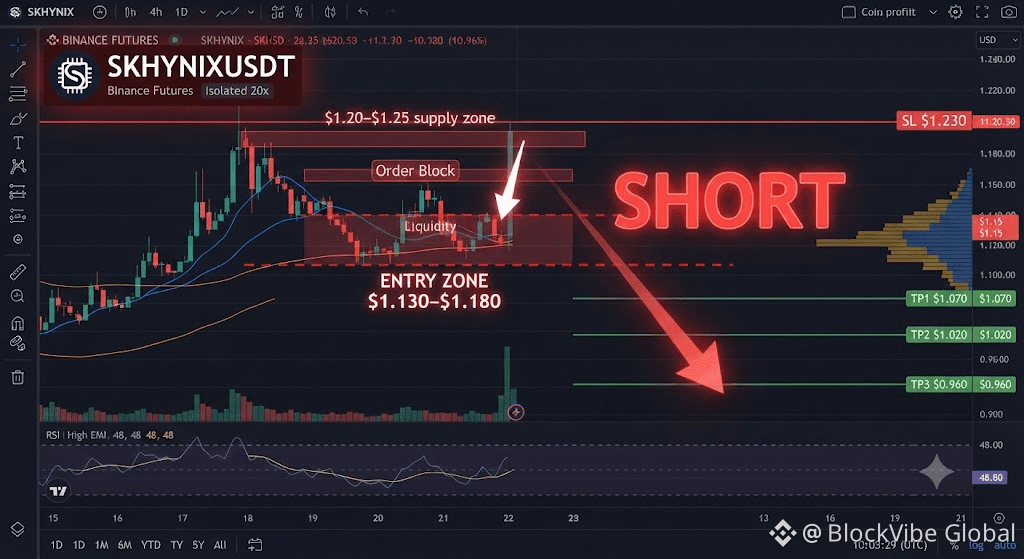
The rally had no volume. The rejection is the tell.
🔴 $SKHYNIX - SHORT
This isn’t a watchlist idea—I’m already positioned and following this exact roadmap.
Trade Plan:
Current Price: ~$1.132
Entry Zone: $1.130 – $1.180
SL: $1.230
TP1: $1.070 | TP2: $1.020 | TP3: $0.960
Why this setup?
4H structure: SKHYNIX rejected hard from the $1.20–$1.25 supply zone after a vertical move from $0.95 to $1.25, and is now rolling over beneath the $1.15 breakdown level. The retest of $1.13–$1.18 is a high-probability short.
15m RSI is printing a lower high near 48 as price re-enters the entry zone, confirming that the bounce off the highs is corrective, not impulsive.
15m volume on the bounce into $1.18 is 0.6x average, while the rejection candle volume was 2.1x — sellers are in control of the tape.
If $1.07 breaks, does the $1.02 target get hit before the next bounce, or does the market need to see $0.96 first?
Click below for trade 👇
DYOR & manage risk!
$SKHYNIX
{future}(SKHYNIXUSDT)
The rally had no volume. The rejection is the tell.
🔴 $SKHYNIX - SHORT
This isn’t a watchlist idea—I’m already positioned and following this exact roadmap.
Trade Plan:
Current Price: ~$1.132
Entry Zone: $1.130 – $1.180
SL: $1.230
TP1: $1.070 | TP2: $1.020 | TP3: $0.960
Why this setup?
4H structure: SKHYNIX rejected hard from the $1.20–$1.25 supply zone after a vertical move from $0.95 to $1.25, and is now rolling over beneath the $1.15 breakdown level. The retest of $1.13–$1.18 is a high-probability short.
15m RSI is printing a lower high near 48 as price re-enters the entry zone, confirming that the bounce off the highs is corrective, not impulsive.
15m volume on the bounce into $1.18 is 0.6x average, while the rejection candle volume was 2.1x — sellers are in control of the tape.
If $1.07 breaks, does the $1.02 target get hit before the next bounce, or does the market need to see $0.96 first?
Click below for trade 👇
DYOR & manage risk!
$SKHYNIX
1
575
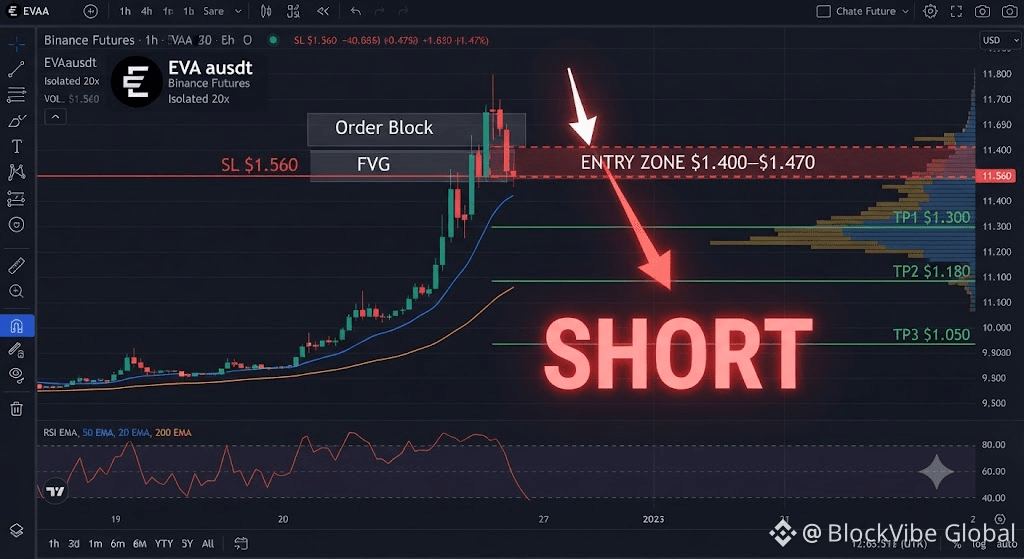
A 156% pump into resistance. The easy money is already made.
🔴 $EVAA - SHORT
This isn’t a watchlist idea—I’m already positioned and following this exact roadmap.
Trade Plan:
Current Price: ~$1.41
Entry Zone: $1.400 – $1.470
SL: $1.560
TP1: $1.300 | TP2: $1.180 | TP3: $1.050
Why this setup?
4H structure: EVAA has gone parabolic with a 156% 24-hour move and is now stalling at the $1.47–$1.50 resistance after failing to hold above it on the 15m chart. Parabolic advances into defined resistance without consolidation are distribution zones.
15m RSI is already curling lower from deeply overbought territory as price tests the entry zone — momentum exhaustion is visible in real time.
15m volume on the final push into $1.47 is fading versus the earlier impulse legs, while sell-side volume is picking up. Buyers who drove the move are using the liquidity to exit.
If $1.30 breaks, does EVAA retrace to $1.18 in a straight line, or does the first bounce trap more late longs?
Click below for trade 👇
DYOR & manage risk!
$EVAA
{future}(EVAAUSDT)
A 156% pump into resistance. The easy money is already made.
🔴 $EVAA - SHORT
This isn’t a watchlist idea—I’m already positioned and following this exact roadmap.
Trade Plan:
Current Price: ~$1.41
Entry Zone: $1.400 – $1.470
SL: $1.560
TP1: $1.300 | TP2: $1.180 | TP3: $1.050
Why this setup?
4H structure: EVAA has gone parabolic with a 156% 24-hour move and is now stalling at the $1.47–$1.50 resistance after failing to hold above it on the 15m chart. Parabolic advances into defined resistance without consolidation are distribution zones.
15m RSI is already curling lower from deeply overbought territory as price tests the entry zone — momentum exhaustion is visible in real time.
15m volume on the final push into $1.47 is fading versus the earlier impulse legs, while sell-side volume is picking up. Buyers who drove the move are using the liquidity to exit.
If $1.30 breaks, does EVAA retrace to $1.18 in a straight line, or does the first bounce trap more late longs?
Click below for trade 👇
DYOR & manage risk!
$EVAA
468
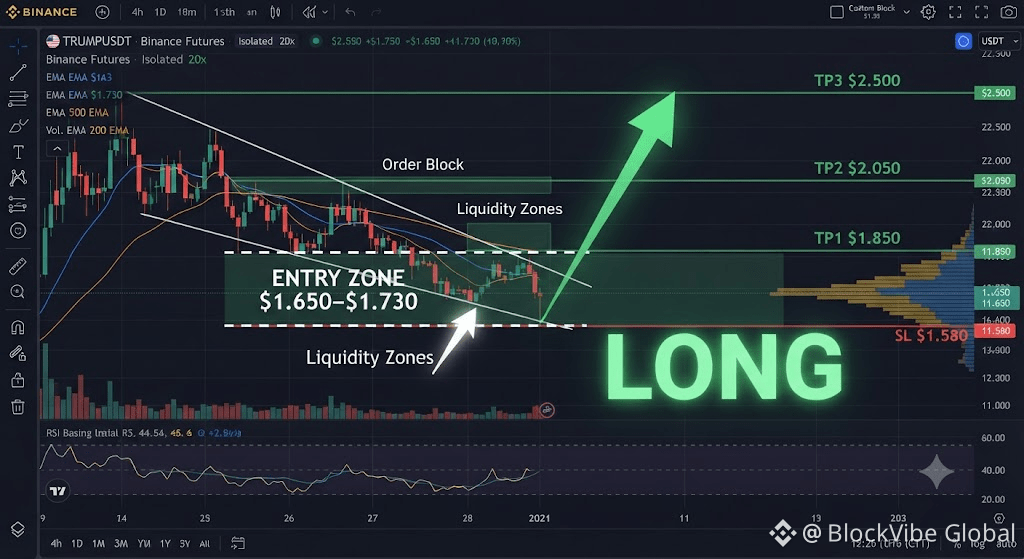
The wedge is compressing. The crowd is still bearish.
🟢 $TRUMP - LONG
This isn’t a watchlist idea—I’m already positioned and following this exact roadmap.
Trade Plan:
Current Price: ~$1.705
Entry Zone: $1.650 – $1.730
SL: $1.580
TP1: $1.850 | TP2: $2.050 | TP3: $2.500
Why this setup?
4H structure: TRUMP is coiling inside a descending wedge with lower highs and lower lows compressing into the $1.60–$1.65 key support. A confirmed 4H close above $1.85–$1.90 opens the path toward $2.50.
15m RSI is basing in the 40–45 zone and turning higher while price holds the lower wedge boundary — momentum is quietly shifting before the breakout.
15m volume on the recent taps of $1.65 is 1.6x average, showing buyers are actively defending the wedge support rather than letting it leak.
If $1.85 breaks with volume, do we run straight to $2.05, or does the market need one more fakeout below $1.65 first?
Click below for trade 👇
DYOR & manage risk!
$TRUMP
{future}(TRUMPUSDT)
The wedge is compressing. The crowd is still bearish.
🟢 $TRUMP - LONG
This isn’t a watchlist idea—I’m already positioned and following this exact roadmap.
Trade Plan:
Current Price: ~$1.705
Entry Zone: $1.650 – $1.730
SL: $1.580
TP1: $1.850 | TP2: $2.050 | TP3: $2.500
Why this setup?
4H structure: TRUMP is coiling inside a descending wedge with lower highs and lower lows compressing into the $1.60–$1.65 key support. A confirmed 4H close above $1.85–$1.90 opens the path toward $2.50.
15m RSI is basing in the 40–45 zone and turning higher while price holds the lower wedge boundary — momentum is quietly shifting before the breakout.
15m volume on the recent taps of $1.65 is 1.6x average, showing buyers are actively defending the wedge support rather than letting it leak.
If $1.85 breaks with volume, do we run straight to $2.05, or does the market need one more fakeout below $1.65 first?
Click below for trade 👇
DYOR & manage risk!
$TRUMP
4
842
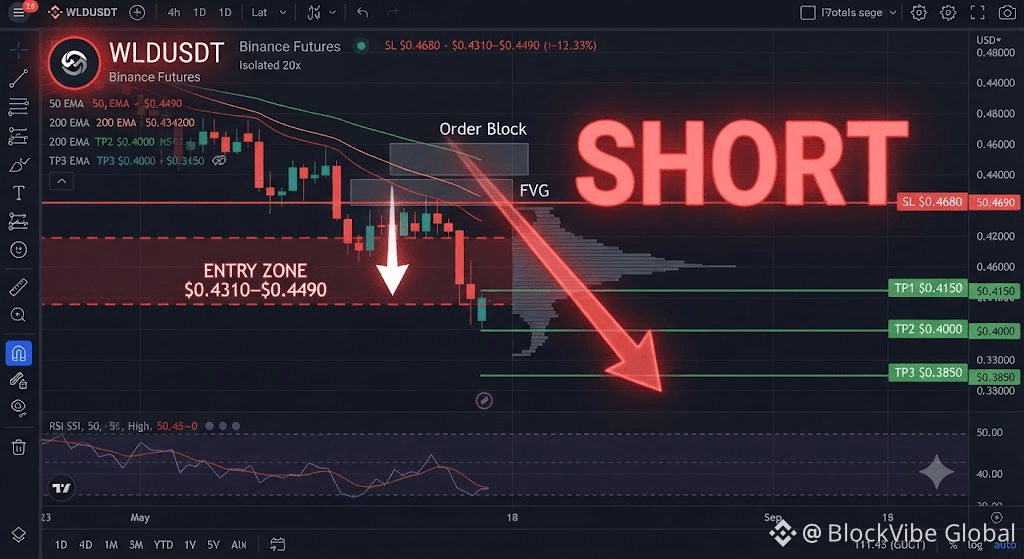
Price is holding. Participation is dying. That’s not strength.
🔴 $WLD - SHORT
This isn’t a watchlist idea—I’m already positioned and following this exact roadmap.
Trade Plan:
Current Price: ~$0.4315
Entry Zone: $0.4310 – $0.4490
SL: $0.4680
TP1: $0.4150 | TP2: $0.4000 | TP3: $0.3850
Why this setup?
4H structure: WLD remains below the $0.4742 4H resistance and is pinned between $0.4150 support and $0.4490 resistance. The 4H trend is still weak — this is a bounce inside a downtrend, not a reversal.
15m RSI is rolling over from the high-50s as price enters the entry zone, showing the bounce is already losing momentum before it can challenge real supply.
15m volume participation is running at 0.17x the average — one of the lowest readings on the board. A move with this little volume behind it is a trap, not a trend.
If $0.4150 gives way, does WLD freefall to $0.4000, or does the low-volume bounce get one more squeeze first?
Click below for trade 👇
DYOR & manage risk!
$WLD
{future}(WLDUSDT)
Price is holding. Participation is dying. That’s not strength.
🔴 $WLD - SHORT
This isn’t a watchlist idea—I’m already positioned and following this exact roadmap.
Trade Plan:
Current Price: ~$0.4315
Entry Zone: $0.4310 – $0.4490
SL: $0.4680
TP1: $0.4150 | TP2: $0.4000 | TP3: $0.3850
Why this setup?
4H structure: WLD remains below the $0.4742 4H resistance and is pinned between $0.4150 support and $0.4490 resistance. The 4H trend is still weak — this is a bounce inside a downtrend, not a reversal.
15m RSI is rolling over from the high-50s as price enters the entry zone, showing the bounce is already losing momentum before it can challenge real supply.
15m volume participation is running at 0.17x the average — one of the lowest readings on the board. A move with this little volume behind it is a trap, not a trend.
If $0.4150 gives way, does WLD freefall to $0.4000, or does the low-volume bounce get one more squeeze first?
Click below for trade 👇
DYOR & manage risk!
$WLD
945
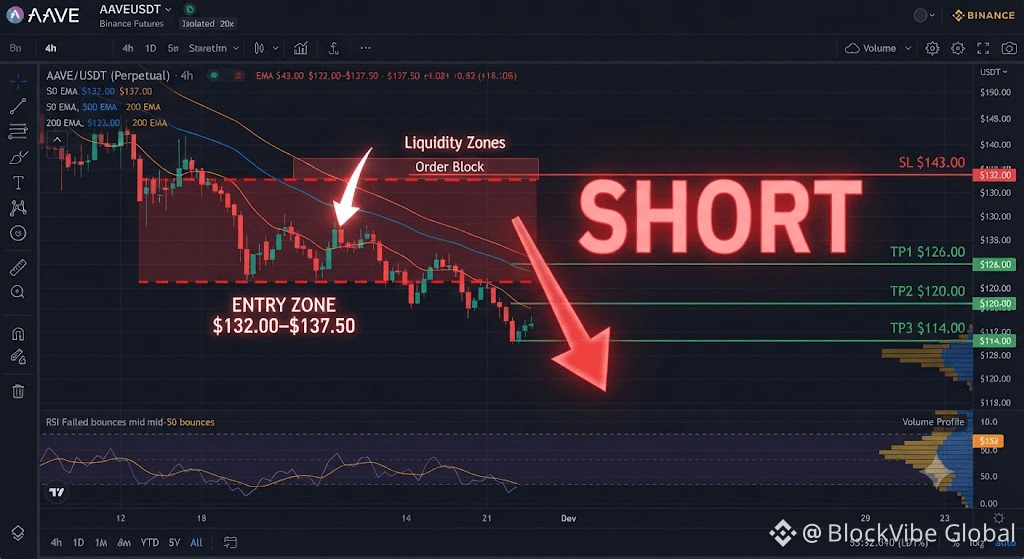
The whale deposit isn’t the trade. The reaction to it is.
🔴 $AAVE - SHORT
This isn’t a watchlist idea—I’m already positioned and following this exact roadmap.
Trade Plan:
Current Price: ~$132
Entry Zone: $132.00 – $137.50
SL: $143.00
TP1: $126.00 | TP2: $120.00 | TP3: $114.00
Why this setup?
4H structure: AAVE has lost the $140 handle and is retesting $132–$137.50 from below after failing at $140. The $126–$128 zone has been tested repeatedly, which makes it a distribution shelf, not a clean accumulation base.
15m RSI is failing in the mid-50s on each bounce, unable to reach overbought territory even as price tests the entry zone — weak hands are selling the rips.
15m volume on the intraday bounce is 0.5x average, while sell-side volume spikes are running above 1.8x. The tape is being controlled by supply.
If $126 breaks, does the $120 target get hit in one candle, or do we see a dead-cat bounce first?
Click below for trade 👇
DYOR & manage risk!
$AAVE
{future}(AAVEUSDT)
The whale deposit isn’t the trade. The reaction to it is.
🔴 $AAVE - SHORT
This isn’t a watchlist idea—I’m already positioned and following this exact roadmap.
Trade Plan:
Current Price: ~$132
Entry Zone: $132.00 – $137.50
SL: $143.00
TP1: $126.00 | TP2: $120.00 | TP3: $114.00
Why this setup?
4H structure: AAVE has lost the $140 handle and is retesting $132–$137.50 from below after failing at $140. The $126–$128 zone has been tested repeatedly, which makes it a distribution shelf, not a clean accumulation base.
15m RSI is failing in the mid-50s on each bounce, unable to reach overbought territory even as price tests the entry zone — weak hands are selling the rips.
15m volume on the intraday bounce is 0.5x average, while sell-side volume spikes are running above 1.8x. The tape is being controlled by supply.
If $126 breaks, does the $120 target get hit in one candle, or do we see a dead-cat bounce first?
Click below for trade 👇
DYOR & manage risk!
$AAVE
3
497
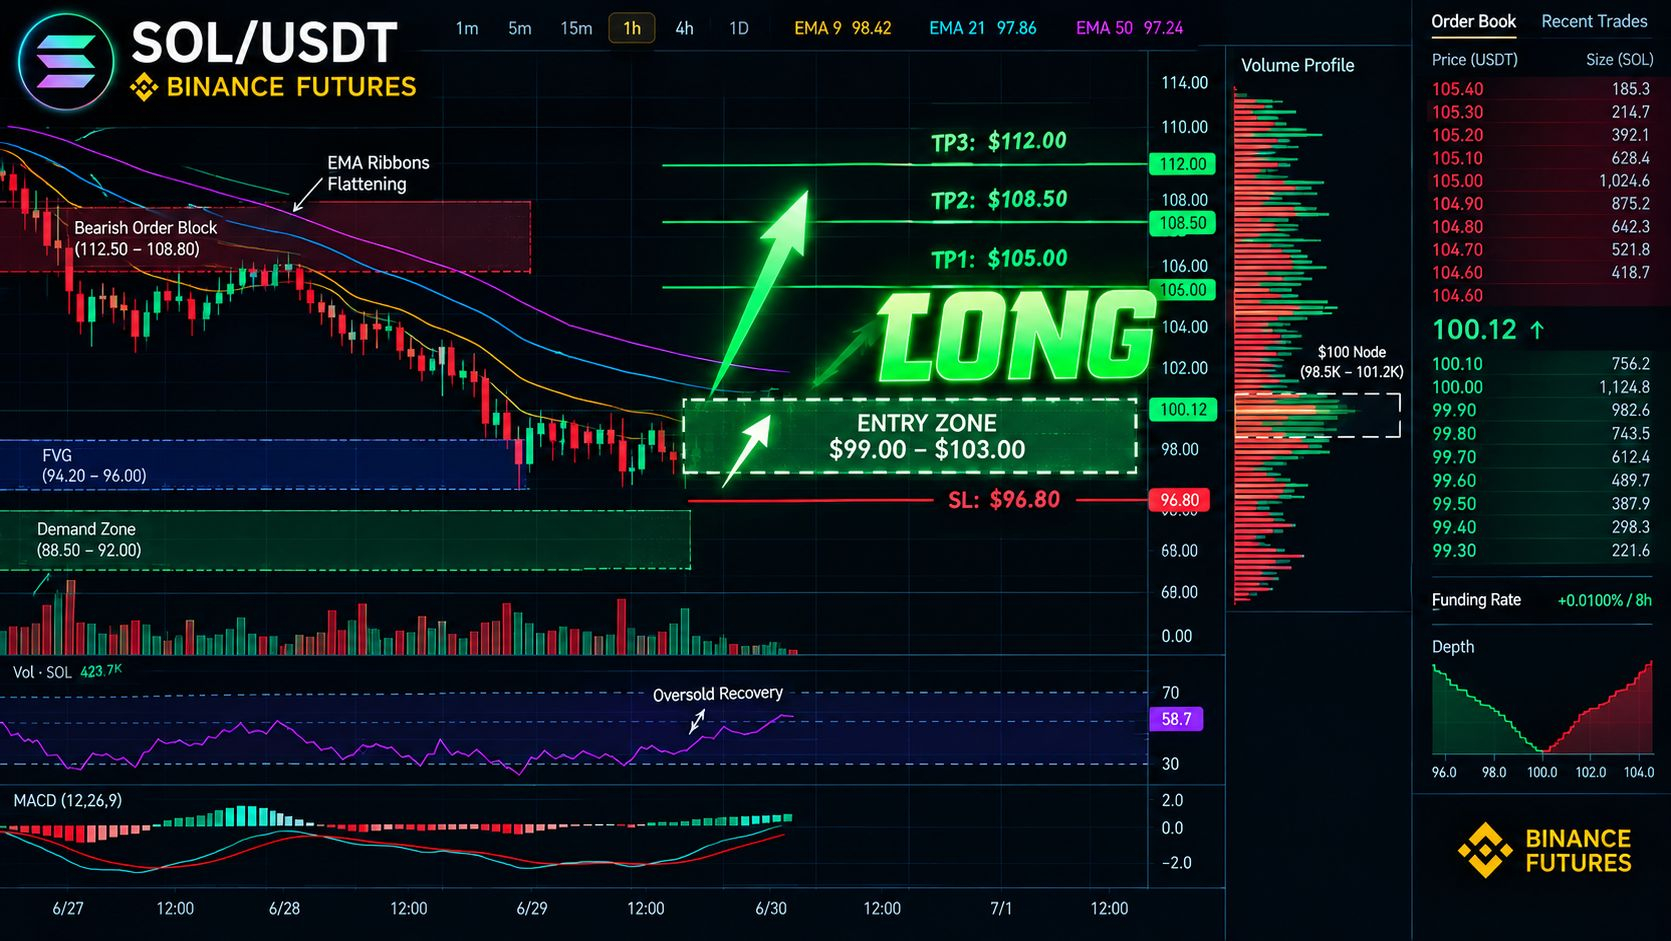
The crowd is shorting the $100 handle. I’m buying the flush.
🟢 $SOL - LONG
This isn’t a watchlist idea—I’m already positioned and following this exact roadmap.
Trade Plan:
Current Price: ~$101
Entry Zone: $99.00 – $103.00
SL: $96.80
TP1: $105.00 | TP2: $108.50 | TP3: $112.00
Why this setup?
4H structure: SOL is holding above the $99.94 immediate support and the $98.51 critical floor, with the Stochastic %K crossing above %D below the 30 level — an early-recovery configuration from oversold territory.
15m RSI has recovered from the mid-20s into the 45–50 zone while price holds the $100 psychological level, showing sellers losing the ability to press the tape lower.
15m volume on the recovery leg is 1.4x the average — real participation stepping in at the demand shelf, not just a low-liquidity drift.
If SOL reclaims $105, does the $108.50 resistance break cleanly, or do we get one more shakeout below $100 first?
Click below for trade 👇
DYOR & manage risk!
$SOL
{future}(SOLUSDT)
The crowd is shorting the $100 handle. I’m buying the flush.
🟢 $SOL - LONG
This isn’t a watchlist idea—I’m already positioned and following this exact roadmap.
Trade Plan:
Current Price: ~$101
Entry Zone: $99.00 – $103.00
SL: $96.80
TP1: $105.00 | TP2: $108.50 | TP3: $112.00
Why this setup?
4H structure: SOL is holding above the $99.94 immediate support and the $98.51 critical floor, with the Stochastic %K crossing above %D below the 30 level — an early-recovery configuration from oversold territory.
15m RSI has recovered from the mid-20s into the 45–50 zone while price holds the $100 psychological level, showing sellers losing the ability to press the tape lower.
15m volume on the recovery leg is 1.4x the average — real participation stepping in at the demand shelf, not just a low-liquidity drift.
If SOL reclaims $105, does the $108.50 resistance break cleanly, or do we get one more shakeout below $100 first?
Click below for trade 👇
DYOR & manage risk!
$SOL
1.1k
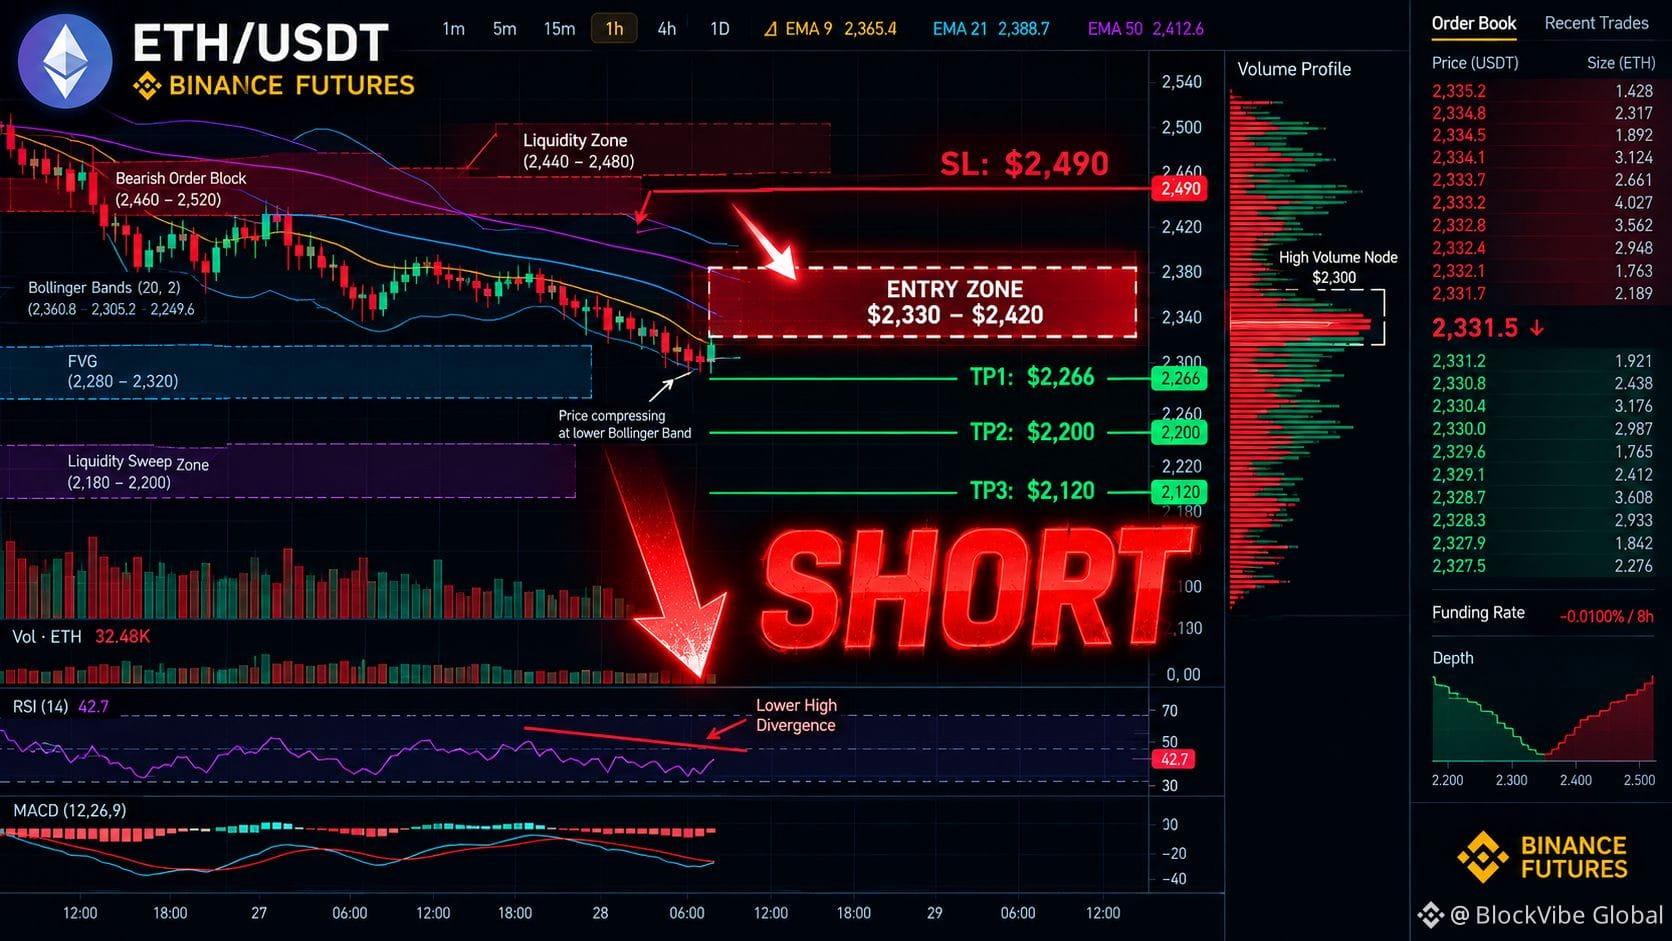
Oversold is not a buy signal when every average is a ceiling.
🔴 $ETH - SHORT
This isn’t a watchlist idea—I’m already positioned and following this exact roadmap.
Trade Plan:
Current Price: ~$2,336
Entry Zone: $2,330 – $2,420
SL: $2,490
TP1: $2,266 | TP2: $2,200 | TP3: $2,120
Why this setup?
4H structure: ETH is compressing against the lower Bollinger band near $2,300 while the short-to-medium moving average stack sits overhead as resistance. Band-walks lower are more common than clean reversals from this position.
15m RSI is printing a lower high near 42 while price makes a marginal higher high into the entry zone — a clean bearish divergence at the point of maximum friction.
15m volume on the bounce is 0.6x average. Sellers are letting the market drift up into their limit orders; there is no aggressive bid absorbing supply.
If $2,266 breaks, does the 200-day near $2,159 become the real battlefield, or does $2,200 front-run it?
Click below for trade 👇
DYOR & manage risk!
$ETH
{future}(ETHUSDT)
Oversold is not a buy signal when every average is a ceiling.
🔴 $ETH - SHORT
This isn’t a watchlist idea—I’m already positioned and following this exact roadmap.
Trade Plan:
Current Price: ~$2,336
Entry Zone: $2,330 – $2,420
SL: $2,490
TP1: $2,266 | TP2: $2,200 | TP3: $2,120
Why this setup?
4H structure: ETH is compressing against the lower Bollinger band near $2,300 while the short-to-medium moving average stack sits overhead as resistance. Band-walks lower are more common than clean reversals from this position.
15m RSI is printing a lower high near 42 while price makes a marginal higher high into the entry zone — a clean bearish divergence at the point of maximum friction.
15m volume on the bounce is 0.6x average. Sellers are letting the market drift up into their limit orders; there is no aggressive bid absorbing supply.
If $2,266 breaks, does the 200-day near $2,159 become the real battlefield, or does $2,200 front-run it?
Click below for trade 👇
DYOR & manage risk!
$ETH
2
1.1k
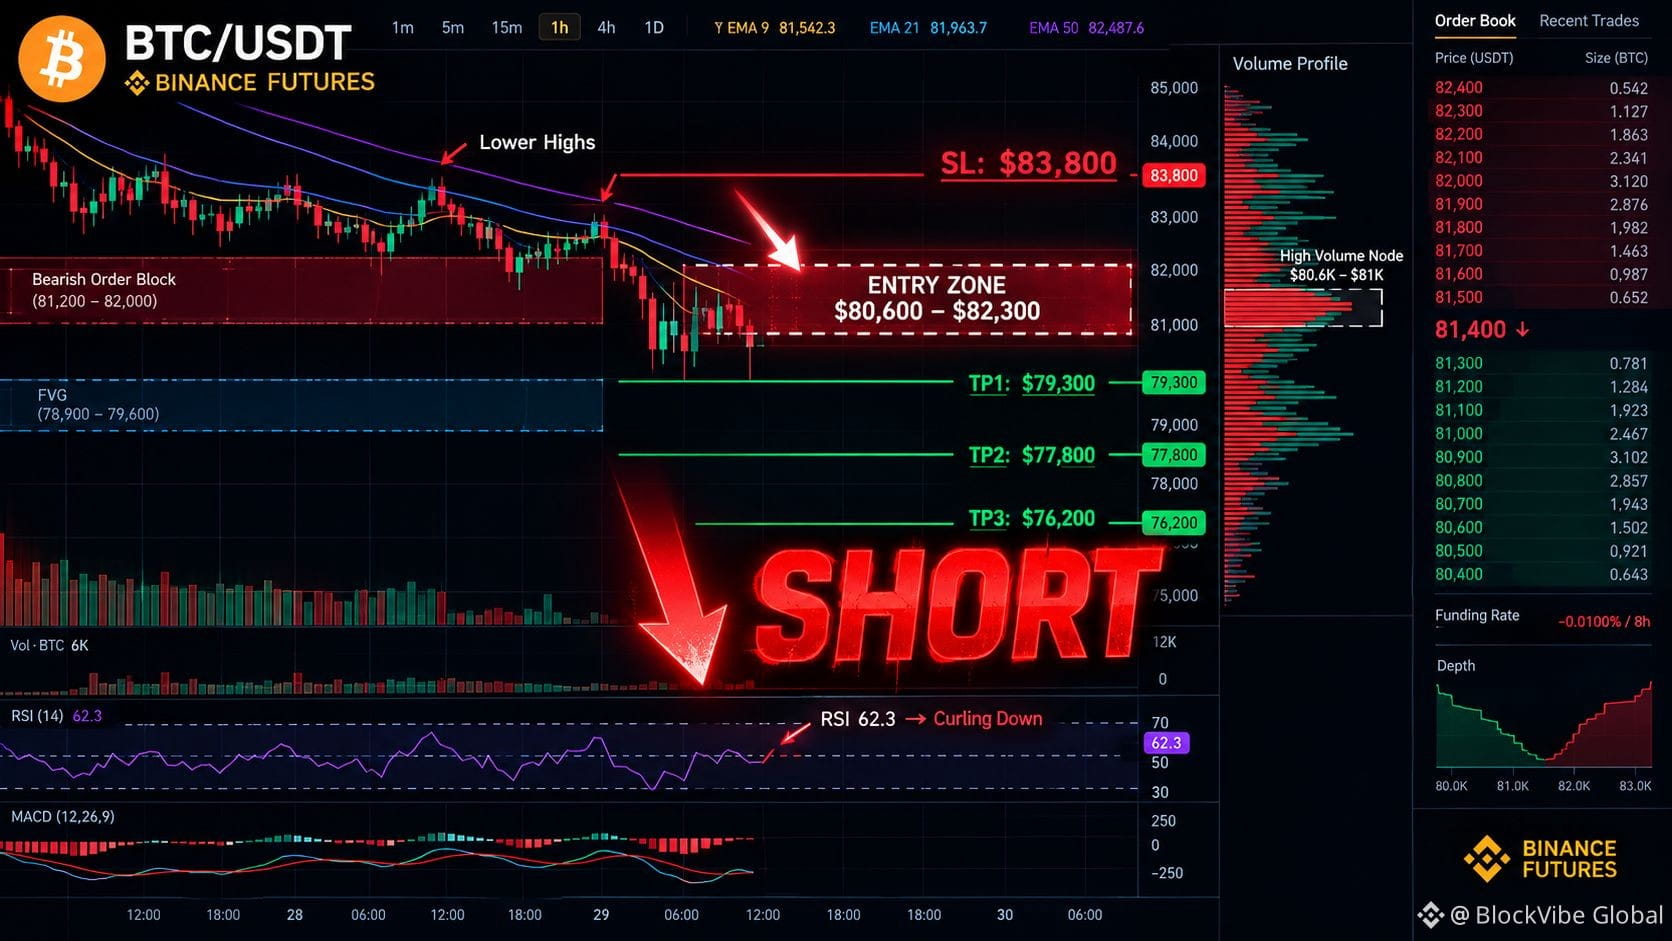
Everyone’s long the bounce. I’m fading the old floor.
🔴 $BTC - SHORT
This isn’t a watchlist idea—I’m already positioned and following this exact roadmap.
Trade Plan:
Current Price: ~$80,661
Entry Zone: $80,600 – $82,300
SL: $83,800
TP1: $79,300 | TP2: $77,800 | TP3: $76,200
Why this setup?
4H structure: BTC is retesting the broken $80,600–$81,000 floor, now acting as a supply shelf after failing to reclaim the $82K handle. This is a support-turned-resistance retest, not a breakout.
15m RSI is curling lower from the low-60s as price presses into the entry zone, showing momentum stalling at the decision point rather than accelerating.
15m volume on the push into $81K–$82K is running at only 0.7x the 20-bar average — a low-participation probe, not real demand.
If BTC gets rejected here once more, does the $79,300 shelf actually hold, or is it just the next liquidity magnet?
Click below for trade 👇
DYOR & manage risk!
$BTC
{future}(BTCUSDT)
Everyone’s long the bounce. I’m fading the old floor.
🔴 $BTC - SHORT
This isn’t a watchlist idea—I’m already positioned and following this exact roadmap.
Trade Plan:
Current Price: ~$80,661
Entry Zone: $80,600 – $82,300
SL: $83,800
TP1: $79,300 | TP2: $77,800 | TP3: $76,200
Why this setup?
4H structure: BTC is retesting the broken $80,600–$81,000 floor, now acting as a supply shelf after failing to reclaim the $82K handle. This is a support-turned-resistance retest, not a breakout.
15m RSI is curling lower from the low-60s as price presses into the entry zone, showing momentum stalling at the decision point rather than accelerating.
15m volume on the push into $81K–$82K is running at only 0.7x the 20-bar average — a low-participation probe, not real demand.
If BTC gets rejected here once more, does the $79,300 shelf actually hold, or is it just the next liquidity magnet?
Click below for trade 👇
DYOR & manage risk!
$BTC
1
4
1.7k
Log in to explore more content
Join global crypto users on Binance Square
⚡️ Get latest and useful information about crypto.
💬 Trusted by the world’s largest crypto exchange.
👍 Discover real insights from verified creators.
Email / Phone number
Trending Topics
FedWatch
16.4M views
39,718 Discussing
🚨 🇺🇸 PETER SCHIFF JUST THREW A BIG WARNING AT THE FED!
Peter Schiff is calling Kevin Warsh’s tough talk on inflation a “bluff,” and his prediction could have major implications for the markets.
Schiff believes the Fed could eventually return to money printing through quantitative easing (QE) and even cut interest rates next year, despite inflation continuing to rise.
Think about that for a moment.
🔥 Inflation could remain a problem. 🔥 The Fed could still move toward easier monetary policy. 🔥 More liquidity could flow into financial markets.
If this scenario plays out, it could create a very different market environment for stocks, gold, Bitcoin, and the wider crypto market.
But there’s a catch: if inflation stays high, the Fed could face a difficult choice between fighting rising prices and supporting the economy.
Will Warsh stick to a tough inflation policy, or will the Fed eventually change direction?
The next move could matter a lot for investors.
#FedWatch #EarningsSeason #USMidtermElections #BrazilCryptoExchangesMustApplyForLicensesByFriday #StanDruckenmillerBecomesInvestorInTradeXYZ
Jackson Liam
·4 Likes
·8.9k views
EarningsSeason
6.5M views
32,431 Discussing
USMidtermElections
60,237 views
779 Discussing