
AirTrader9
17 Posts
AirTrader9
Report
Block User
AirTrader9 crypto 📊 Crypto Trader 📊 Crypto Trader | Market Analyst |
6 Following
4 Followers
6 Liked
Posts
·
--
🚨 $BTC EXTREME FEAR — IS THE MARKET NEAR A BOTTOM?**
{spot}(BTCUSDT)
$BTC is holding the $63K–$64.5K range, while the Fear & Greed Index sits at just **11 (Extreme Fear)**. Meanwhile, Russia is opening regulated crypto access for retail investors, Binance faces a reported $6.5B freeze order while planning expansion into five Asian markets in 2027, and institutions continue accumulating through BTC ETFs.
📊 **The big question:** Is this extreme fear creating a generational buying opportunity, or is more downside still ahead?
Markets are uncertain, so watch key support levels, ETF flows, and institutional activity before making a decision.
👇 What do you think — BTC bottom or more pain?
#bitcoin #BTCRemainsUnderPressureAfterHawkishFOMCMinutes #Binance #CryptoNews #BitcoinETF
🚨 $BTC EXTREME FEAR — IS THE MARKET NEAR A BOTTOM?**
$BTC is holding the $63K–$64.5K range, while the Fear & Greed Index sits at just **11 (Extreme Fear)**. Meanwhile, Russia is opening regulated crypto access for retail investors, Binance faces a reported $6.5B freeze order while planning expansion into five Asian markets in 2027, and institutions continue accumulating through BTC ETFs.
📊 **The big question:** Is this extreme fear creating a generational buying opportunity, or is more downside still ahead?
Markets are uncertain, so watch key support levels, ETF flows, and institutional activity before making a decision.
👇 What do you think — BTC bottom or more pain?
#bitcoin #BTCRemainsUnderPressureAfterHawkishFOMCMinutes #Binance #CryptoNews #BitcoinETF
$BTC is holding the $63K–$64.5K range, while the Fear & Greed Index sits at just **11 (Extreme Fear)**. Meanwhile, Russia is opening regulated crypto access for retail investors, Binance faces a reported $6.5B freeze order while planning expansion into five Asian markets in 2027, and institutions continue accumulating through BTC ETFs.
📊 **The big question:** Is this extreme fear creating a generational buying opportunity, or is more downside still ahead?
Markets are uncertain, so watch key support levels, ETF flows, and institutional activity before making a decision.
👇 What do you think — BTC bottom or more pain?
#bitcoin #BTCRemainsUnderPressureAfterHawkishFOMCMinutes #Binance #CryptoNews #BitcoinETF

74
·
--
Bullish
🚀 $MMT : Bulls Are Fighting Back! Is Another Rally Coming?**
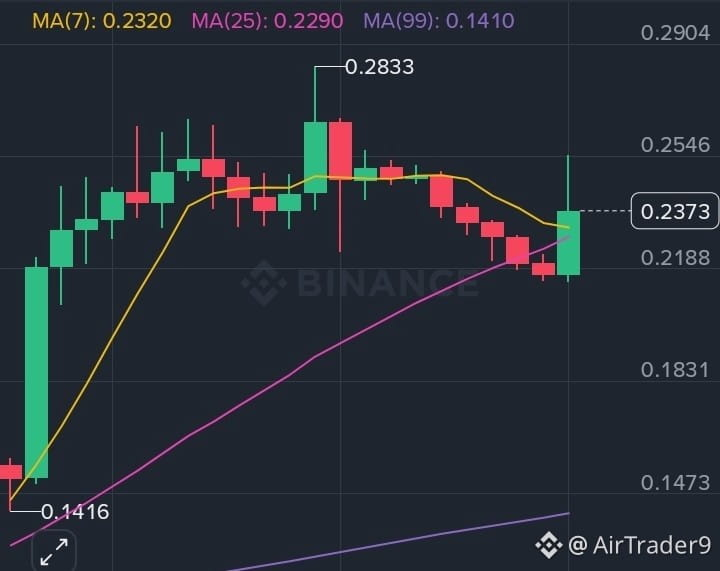
$MMT is showing fresh signs of strength after a short-term correction. The price has bounced back to **$0.2373**, with a massive 24-hour gain of **67.70%**.
📊 **What the chart is telling us:**
The latest 1-hour candle shows a strong bullish recovery, supported by a noticeable increase in trading volume.
The RSI has recovered to around 54.78, suggesting that buying momentum is gradually returning.
🔑 **Important levels to watch:**
🟢 Support: $0.2290 – $0.2188
🚀 Resistance: $0.2450 – $0.2550
🎯 Major Target: $0.2833
If buyers manage to push MMT above $0.2450 and hold that level, we could see another attempt toward $0.2550 and potentially the previous high of $0.2833.
However, losing the $0.2188 support could bring renewed selling pressure.
**My Take:** MMT looks promising in the short term, but I would prefer to see a confirmed 1H breakout with strong volume before chasing the price.
Remember, momentum can change quickly after a massive rally. Manage your risk and trade wisely!
What do you think? Can MMT break $0.2833 again? 👀
NOT: do you on research
#MMT #MMTUSDT #CryptoAnalysis" #BinanceSquare #Altcoins!
{spot}(MMTUSDT)
🚀 $MMT : Bulls Are Fighting Back! Is Another Rally Coming?**
$MMT is showing fresh signs of strength after a short-term correction. The price has bounced back to **$0.2373**, with a massive 24-hour gain of **67.70%**.
📊 **What the chart is telling us:**
The latest 1-hour candle shows a strong bullish recovery, supported by a noticeable increase in trading volume.
The RSI has recovered to around 54.78, suggesting that buying momentum is gradually returning.
🔑 **Important levels to watch:**
🟢 Support: $0.2290 – $0.2188
🚀 Resistance: $0.2450 – $0.2550
🎯 Major Target: $0.2833
If buyers manage to push MMT above $0.2450 and hold that level, we could see another attempt toward $0.2550 and potentially the previous high of $0.2833.
However, losing the $0.2188 support could bring renewed selling pressure.
**My Take:** MMT looks promising in the short term, but I would prefer to see a confirmed 1H breakout with strong volume before chasing the price.
Remember, momentum can change quickly after a massive rally. Manage your risk and trade wisely!
What do you think? Can MMT break $0.2833 again? 👀
NOT: do you on research
#MMT #MMTUSDT #CryptoAnalysis" #BinanceSquare #Altcoins!
$MMT is showing fresh signs of strength after a short-term correction. The price has bounced back to **$0.2373**, with a massive 24-hour gain of **67.70%**.
📊 **What the chart is telling us:**
The latest 1-hour candle shows a strong bullish recovery, supported by a noticeable increase in trading volume.
The RSI has recovered to around 54.78, suggesting that buying momentum is gradually returning.
🔑 **Important levels to watch:**
🟢 Support: $0.2290 – $0.2188
🚀 Resistance: $0.2450 – $0.2550
🎯 Major Target: $0.2833
If buyers manage to push MMT above $0.2450 and hold that level, we could see another attempt toward $0.2550 and potentially the previous high of $0.2833.
However, losing the $0.2188 support could bring renewed selling pressure.
**My Take:** MMT looks promising in the short term, but I would prefer to see a confirmed 1H breakout with strong volume before chasing the price.
Remember, momentum can change quickly after a massive rally. Manage your risk and trade wisely!
What do you think? Can MMT break $0.2833 again? 👀
NOT: do you on research
#MMT #MMTUSDT #CryptoAnalysis" #BinanceSquare #Altcoins!
200
·
--
Bullish
{spot}(XRPUSDT)
🚀 $XRP : Bulls Are Still in the Game, But Can Buyers Push Higher?**
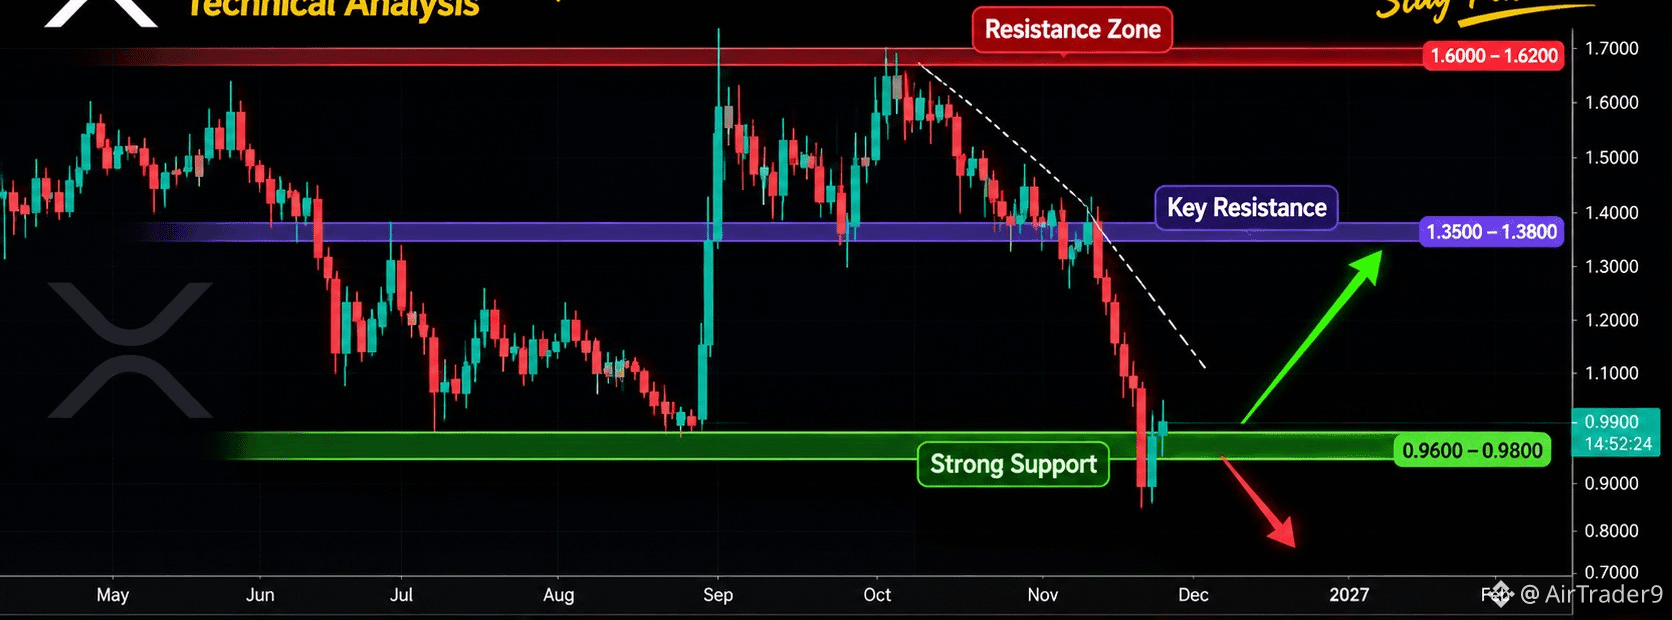
$XRP is currently trading around **$0.9898**, up approximately 2.81%, after making a strong move toward $1.0078.
Looking at the 1-hour chart, the overall structure remains encouraging. However, XRP is facing some short-term selling pressure after its recent rally.
📊 **Key Technical Levels:**
🔹 Resistance: $0.9972
🔹 Major Resistance: $1.0078
🔹 Support: $0.9835
🔹 Stronger Support: $0.9774
The moving averages still favor the bullish structure, with MA(25) at $0.9774 and MA(99) at $0.9630.
Meanwhile, RSI is near 50.98, suggesting momentum has cooled down rather than showing strong buying pressure.
**My Market Outlook:**
If XRP reclaims $0.9972 with strong volume, another attempt toward $1.0078 could be possible.
However, if support at $0.9835 breaks, we may see a deeper correction.
I'm watching the next 1H candle closely. No need to rush into a trade without confirmation.
**Trade smart, stay patient, and manage your risk.** 📈
NOT do you on research
#XRP’ #XRPUSDT #CryptoAnalysis #BinanceSquare #TechnicalAnalysis
🚀 $XRP : Bulls Are Still in the Game, But Can Buyers Push Higher?**
$XRP is currently trading around **$0.9898**, up approximately 2.81%, after making a strong move toward $1.0078.
Looking at the 1-hour chart, the overall structure remains encouraging. However, XRP is facing some short-term selling pressure after its recent rally.
📊 **Key Technical Levels:**
🔹 Resistance: $0.9972
🔹 Major Resistance: $1.0078
🔹 Support: $0.9835
🔹 Stronger Support: $0.9774
The moving averages still favor the bullish structure, with MA(25) at $0.9774 and MA(99) at $0.9630.
Meanwhile, RSI is near 50.98, suggesting momentum has cooled down rather than showing strong buying pressure.
**My Market Outlook:**
If XRP reclaims $0.9972 with strong volume, another attempt toward $1.0078 could be possible.
However, if support at $0.9835 breaks, we may see a deeper correction.
I'm watching the next 1H candle closely. No need to rush into a trade without confirmation.
**Trade smart, stay patient, and manage your risk.** 📈
NOT do you on research
#XRP’ #XRPUSDT #CryptoAnalysis #BinanceSquare #TechnicalAnalysis
$XRP is currently trading around **$0.9898**, up approximately 2.81%, after making a strong move toward $1.0078.
Looking at the 1-hour chart, the overall structure remains encouraging. However, XRP is facing some short-term selling pressure after its recent rally.
📊 **Key Technical Levels:**
🔹 Resistance: $0.9972
🔹 Major Resistance: $1.0078
🔹 Support: $0.9835
🔹 Stronger Support: $0.9774
The moving averages still favor the bullish structure, with MA(25) at $0.9774 and MA(99) at $0.9630.
Meanwhile, RSI is near 50.98, suggesting momentum has cooled down rather than showing strong buying pressure.
**My Market Outlook:**
If XRP reclaims $0.9972 with strong volume, another attempt toward $1.0078 could be possible.
However, if support at $0.9835 breaks, we may see a deeper correction.
I'm watching the next 1H candle closely. No need to rush into a trade without confirmation.
**Trade smart, stay patient, and manage your risk.** 📈
NOT do you on research
#XRP’ #XRPUSDT #CryptoAnalysis #BinanceSquare #TechnicalAnalysis
1
278
·
--
Bullish
{spot}(TRUMPUSDT)
🚀 $TRUMP : Buyers Are Slowly Taking Control!**
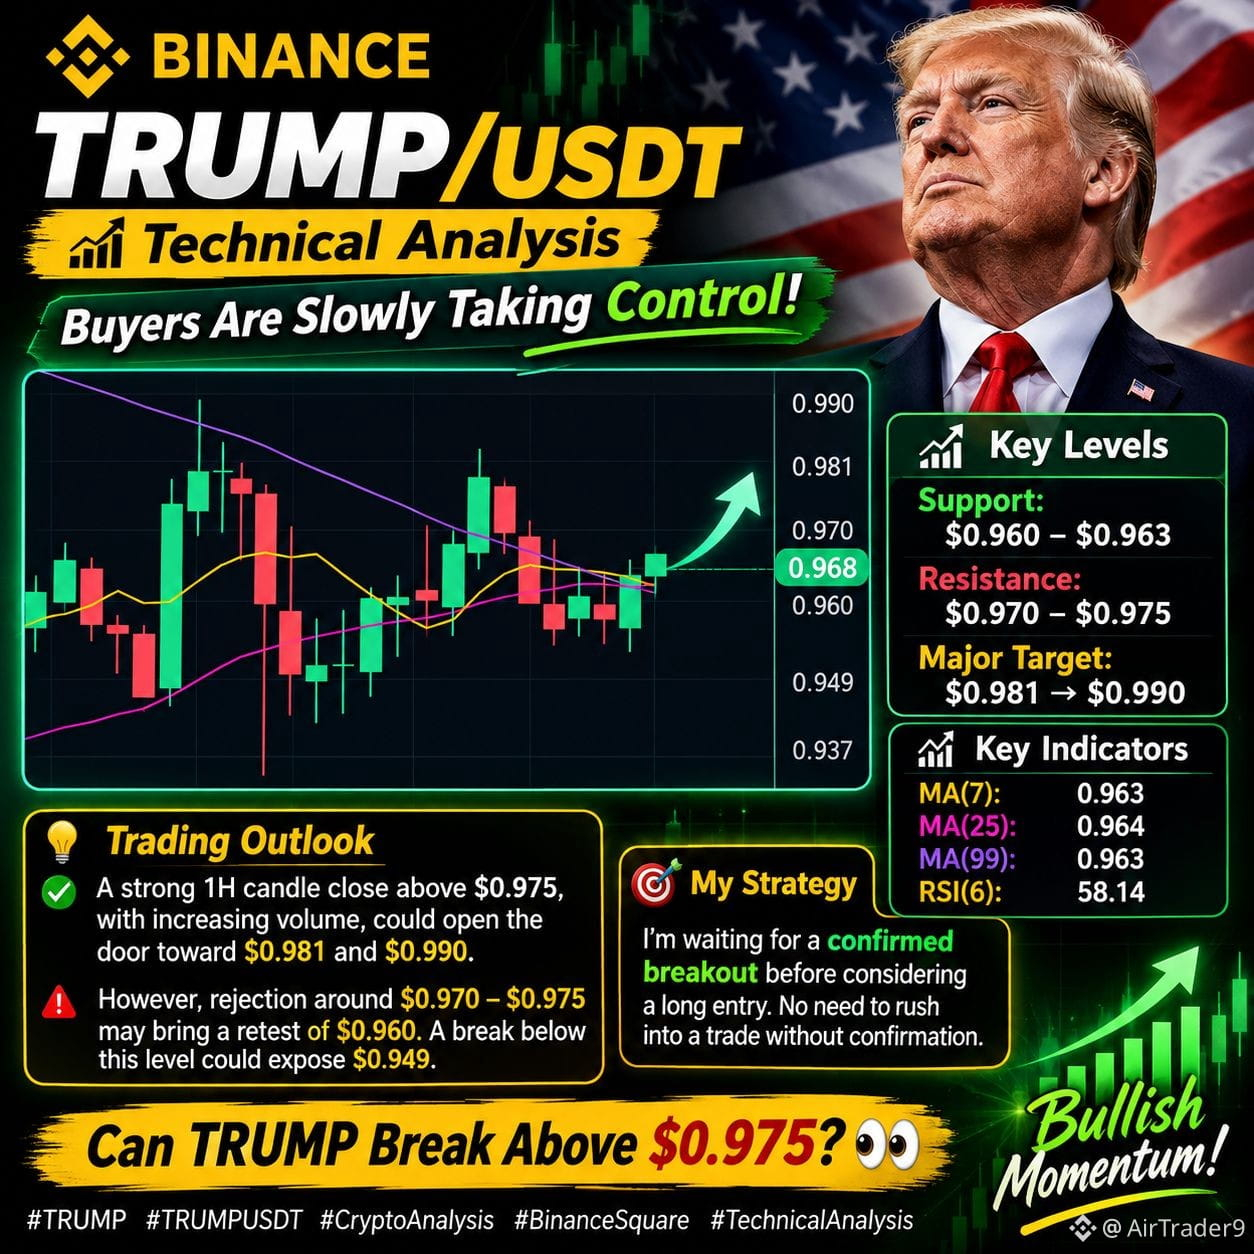
$TRUMP is currently trading around **$0.968**, showing a gradual recovery after bouncing from the $0.940 support level.
Looking at the 1-hour chart, the price is holding above MA(7), MA(25), and MA(99). RSI is around 58, indicating improving bullish momentum.
📊 **Key Levels to Watch:**
🟢 Support: $0.960–$0.963
🔴 Resistance: $0.970–$0.975
🎯 Upside Targets: $0.981 → $0.990
If buyers manage to break above $0.975 with strong volume, we could see another upward move.
However, a rejection near resistance could push the price back toward $0.960.
**My Strategy:** I'm watching for a confirmed breakout before considering a long entry. No need to rush into a trade without confirmation.
What do you think? Can TRUMP break above $0.975? 👀
do you research
#TRUMP #trumpusdt #CryptoAnalysis #CanNvidia’sDataCenterGrowthContinue? #CryptoAnalysis"
🚀 $TRUMP : Buyers Are Slowly Taking Control!**
$TRUMP is currently trading around **$0.968**, showing a gradual recovery after bouncing from the $0.940 support level.
Looking at the 1-hour chart, the price is holding above MA(7), MA(25), and MA(99). RSI is around 58, indicating improving bullish momentum.
📊 **Key Levels to Watch:**
🟢 Support: $0.960–$0.963
🔴 Resistance: $0.970–$0.975
🎯 Upside Targets: $0.981 → $0.990
If buyers manage to break above $0.975 with strong volume, we could see another upward move.
However, a rejection near resistance could push the price back toward $0.960.
**My Strategy:** I'm watching for a confirmed breakout before considering a long entry. No need to rush into a trade without confirmation.
What do you think? Can TRUMP break above $0.975? 👀
do you research
#TRUMP #trumpusdt #CryptoAnalysis #CanNvidia’sDataCenterGrowthContinue? #CryptoAnalysis"
$TRUMP is currently trading around **$0.968**, showing a gradual recovery after bouncing from the $0.940 support level.
Looking at the 1-hour chart, the price is holding above MA(7), MA(25), and MA(99). RSI is around 58, indicating improving bullish momentum.
📊 **Key Levels to Watch:**
🟢 Support: $0.960–$0.963
🔴 Resistance: $0.970–$0.975
🎯 Upside Targets: $0.981 → $0.990
If buyers manage to break above $0.975 with strong volume, we could see another upward move.
However, a rejection near resistance could push the price back toward $0.960.
**My Strategy:** I'm watching for a confirmed breakout before considering a long entry. No need to rush into a trade without confirmation.
What do you think? Can TRUMP break above $0.975? 👀
do you research
#TRUMP #trumpusdt #CryptoAnalysis #CanNvidia’sDataCenterGrowthContinue? #CryptoAnalysis"
163
·
--
Bullish
{spot}(BREVUSDT)
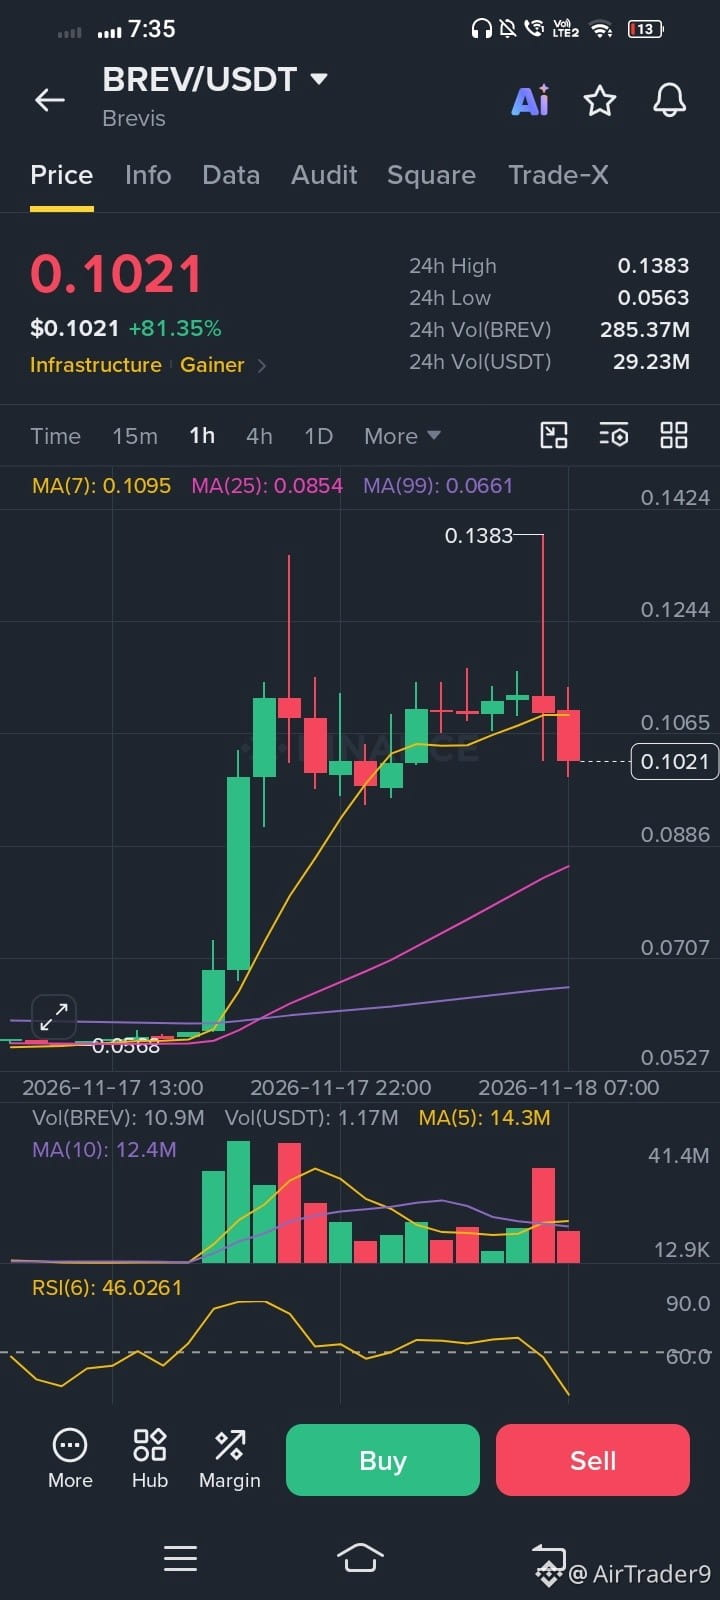
🚀 $BREV Is Another Bullish Move Coming?
$BREV has caught the market's attention after an impressive rally of more than 80% in 24 hours! 🔥
Looking at the 1H chart, the price is currently trading around $0.1021 after facing rejection near $0.1383.
📊 Technical Outlook:
Price is consolidating after a strong pump.
RSI is around 46, showing that bullish momentum has cooled down.
Short-term resistance sits around $0.1065–$0.1100.
Immediate support is around $0.0980–$0.1000.
🎯 My Trading Plan:
If BREW reclaims $0.1100 with strong volume, we could see another attempt toward $0.1200 and potentially $0.1383.
However, losing the $0.0980 support could bring further downside toward $0.0900.
I'm watching for confirmation instead of chasing the pump. Patience is key after such a massive move!
What do you think? Is BREW preparing for another breakout or a deeper correction? 👀
i do your on research ?
#CanNvidia’sDataCenterGrowthContinue? #BREWUSDT #NvidiaBoardNotConsideringHuang’sReturnasCEO #CryptoAnalysis"
🚀 $BREV Is Another Bullish Move Coming?
$BREV has caught the market's attention after an impressive rally of more than 80% in 24 hours! 🔥
Looking at the 1H chart, the price is currently trading around $0.1021 after facing rejection near $0.1383.
📊 Technical Outlook:
Price is consolidating after a strong pump.
RSI is around 46, showing that bullish momentum has cooled down.
Short-term resistance sits around $0.1065–$0.1100.
Immediate support is around $0.0980–$0.1000.
🎯 My Trading Plan:
If BREW reclaims $0.1100 with strong volume, we could see another attempt toward $0.1200 and potentially $0.1383.
However, losing the $0.0980 support could bring further downside toward $0.0900.
I'm watching for confirmation instead of chasing the pump. Patience is key after such a massive move!
What do you think? Is BREW preparing for another breakout or a deeper correction? 👀
i do your on research ?
#CanNvidia’sDataCenterGrowthContinue? #BREWUSDT #NvidiaBoardNotConsideringHuang’sReturnasCEO #CryptoAnalysis"
$BREV has caught the market's attention after an impressive rally of more than 80% in 24 hours! 🔥
Looking at the 1H chart, the price is currently trading around $0.1021 after facing rejection near $0.1383.
📊 Technical Outlook:
Price is consolidating after a strong pump.
RSI is around 46, showing that bullish momentum has cooled down.
Short-term resistance sits around $0.1065–$0.1100.
Immediate support is around $0.0980–$0.1000.
🎯 My Trading Plan:
If BREW reclaims $0.1100 with strong volume, we could see another attempt toward $0.1200 and potentially $0.1383.
However, losing the $0.0980 support could bring further downside toward $0.0900.
I'm watching for confirmation instead of chasing the pump. Patience is key after such a massive move!
What do you think? Is BREW preparing for another breakout or a deeper correction? 👀
i do your on research ?
#CanNvidia’sDataCenterGrowthContinue? #BREWUSDT #NvidiaBoardNotConsideringHuang’sReturnasCEO #CryptoAnalysis"
1
544
·
--
Bullish
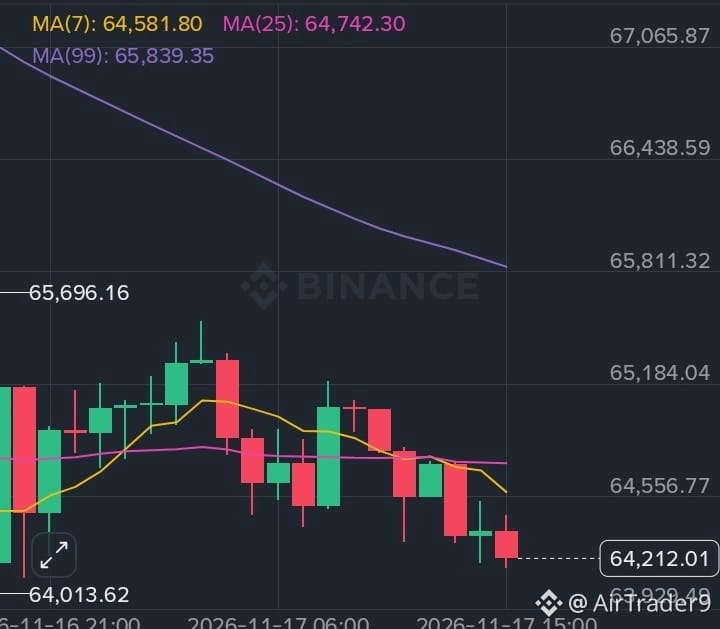
$BTC is on fire follow My instructions to get profit .
Entry: $63,950–$64,100 after bullish confirmation.
Target 1: $64,550
Target 2: $64,750
Stop Loss: Below $63,750
Important: Don't buy immediately. $BTC is below all three moving averages, so the trend is bearish. Wait for a bullish candle and confirmation around support.
Not do your on research:
#BTC #AnthropicIPOTestsInvestorAppetiteForAI #btcanlaysis #InvescoStablecoinReservesFundLaunchesOnEthereum
{spot}(BTCUSDT)
$BTC is on fire follow My instructions to get profit .
Entry: $63,950–$64,100 after bullish confirmation.
Target 1: $64,550
Target 2: $64,750
Stop Loss: Below $63,750
Important: Don't buy immediately. $BTC is below all three moving averages, so the trend is bearish. Wait for a bullish candle and confirmation around support.
Not do your on research:
#BTC #AnthropicIPOTestsInvestorAppetiteForAI #btcanlaysis #InvescoStablecoinReservesFundLaunchesOnEthereum
Entry: $63,950–$64,100 after bullish confirmation.
Target 1: $64,550
Target 2: $64,750
Stop Loss: Below $63,750
Important: Don't buy immediately. $BTC is below all three moving averages, so the trend is bearish. Wait for a bullish candle and confirmation around support.
Not do your on research:
#BTC #AnthropicIPOTestsInvestorAppetiteForAI #btcanlaysis #InvescoStablecoinReservesFundLaunchesOnEthereum
22
·
--
Bullish
{spot}(SOLUSDT)
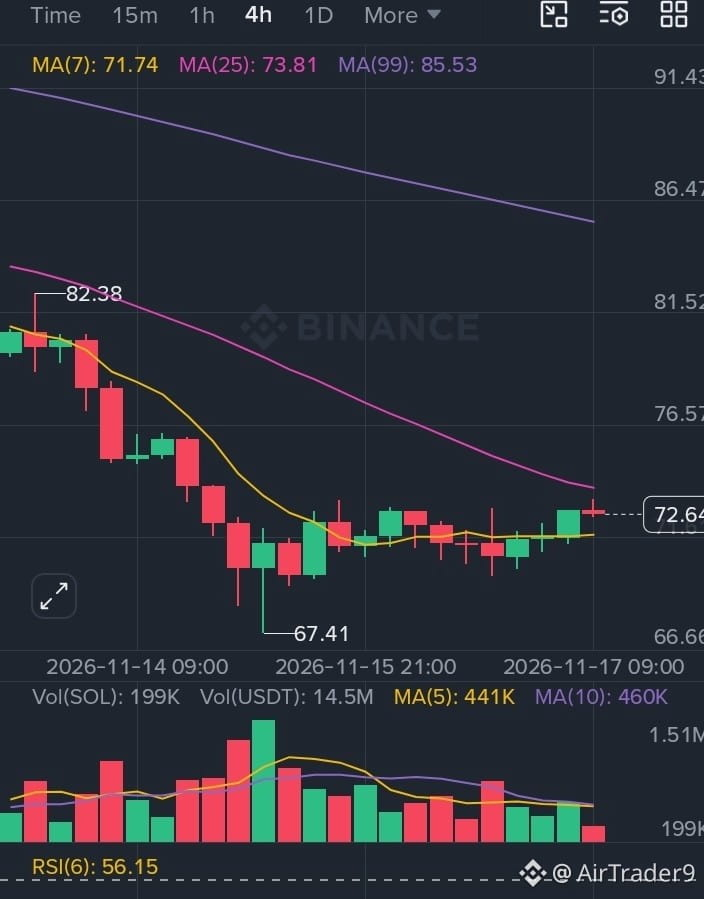
$SOL IS SHOWING SIGNS OF RECOVERY
$SOL is currently trading around $72.64, and the 4H chart is starting to look interesting.
After dropping toward $67.41, Solana has managed to recover and is now holding above its short-term moving average. RSI is also sitting around 56, suggesting buyers are slowly gaining some momentum.
But there is one important level to watch: $73.30–$73.80
If SOL breaks above this resistance with strong volume, we could see a move toward $76.50.
However, rejection from this zone could bring another retest of $71 or even $69.90.
I'm watching this level closely before making any big move. No need to rush—confirmation is everything
What do you think? Can SOL break $74 and continue higher
#AnthropicIPOTestsInvestorAppetiteForAI #SolanaStrong #NvidiaBoardNotConsideringHuang’sReturnasCEO #solanAnalysis
$SOL IS SHOWING SIGNS OF RECOVERY
$SOL is currently trading around $72.64, and the 4H chart is starting to look interesting.
After dropping toward $67.41, Solana has managed to recover and is now holding above its short-term moving average. RSI is also sitting around 56, suggesting buyers are slowly gaining some momentum.
But there is one important level to watch: $73.30–$73.80
If SOL breaks above this resistance with strong volume, we could see a move toward $76.50.
However, rejection from this zone could bring another retest of $71 or even $69.90.
I'm watching this level closely before making any big move. No need to rush—confirmation is everything
What do you think? Can SOL break $74 and continue higher
#AnthropicIPOTestsInvestorAppetiteForAI #SolanaStrong #NvidiaBoardNotConsideringHuang’sReturnasCEO #solanAnalysis
$SOL is currently trading around $72.64, and the 4H chart is starting to look interesting.
After dropping toward $67.41, Solana has managed to recover and is now holding above its short-term moving average. RSI is also sitting around 56, suggesting buyers are slowly gaining some momentum.
But there is one important level to watch: $73.30–$73.80
If SOL breaks above this resistance with strong volume, we could see a move toward $76.50.
However, rejection from this zone could bring another retest of $71 or even $69.90.
I'm watching this level closely before making any big move. No need to rush—confirmation is everything
What do you think? Can SOL break $74 and continue higher
#AnthropicIPOTestsInvestorAppetiteForAI #SolanaStrong #NvidiaBoardNotConsideringHuang’sReturnasCEO #solanAnalysis
71
·
--
{spot}(HUMAUSDT)
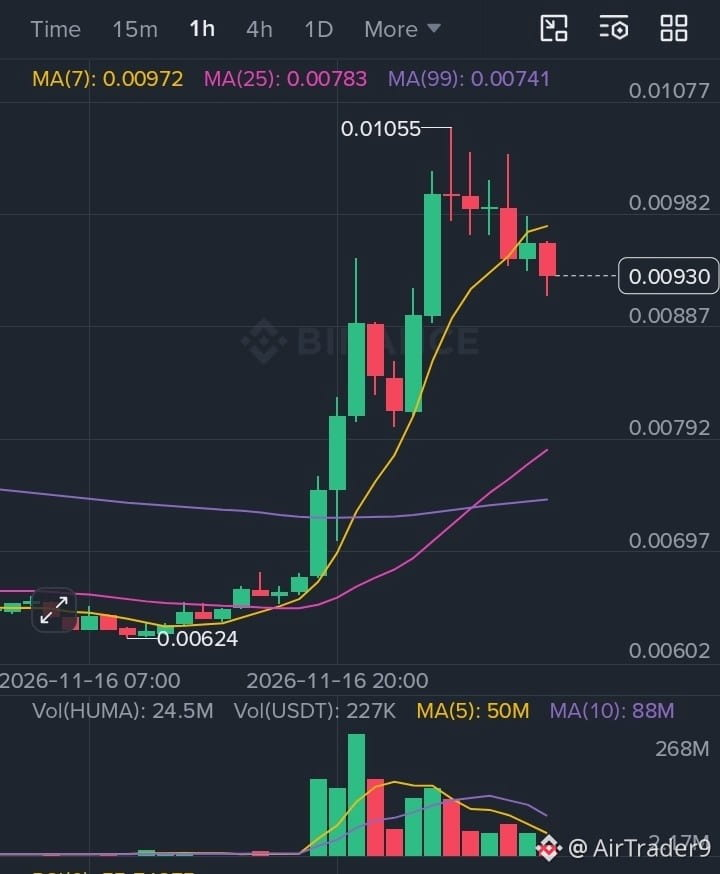
$HUMA has already made a strong move, gaining over 44%, but we're now seeing some selling pressure.
The price is struggling near $0.00980, while $0.00887 is an important support level to watch.
If buyers push above $0.00980, we could see another move toward $0.01055. However, a break below $0.00887 may lead to further downside.
My strategy: I'm waiting for confirmation rather than chasing the pump. Patience is key.
#AnthropicIPOTestsInvestorAppetiteForAI #Humauadt #BitcoinExtendsLosingStreakToSixWeeks
$HUMA has already made a strong move, gaining over 44%, but we're now seeing some selling pressure.
The price is struggling near $0.00980, while $0.00887 is an important support level to watch.
If buyers push above $0.00980, we could see another move toward $0.01055. However, a break below $0.00887 may lead to further downside.
My strategy: I'm waiting for confirmation rather than chasing the pump. Patience is key.
#AnthropicIPOTestsInvestorAppetiteForAI #Humauadt #BitcoinExtendsLosingStreakToSixWeeks
The price is struggling near $0.00980, while $0.00887 is an important support level to watch.
If buyers push above $0.00980, we could see another move toward $0.01055. However, a break below $0.00887 may lead to further downside.
My strategy: I'm waiting for confirmation rather than chasing the pump. Patience is key.
#AnthropicIPOTestsInvestorAppetiteForAI #Humauadt #BitcoinExtendsLosingStreakToSixWeeks
149
·
--
Bullish
{spot}(PEPEUSDT)
🐸 $PEPE IS SHOWING SIGNS OF A POSSIBLE RECOVERY.
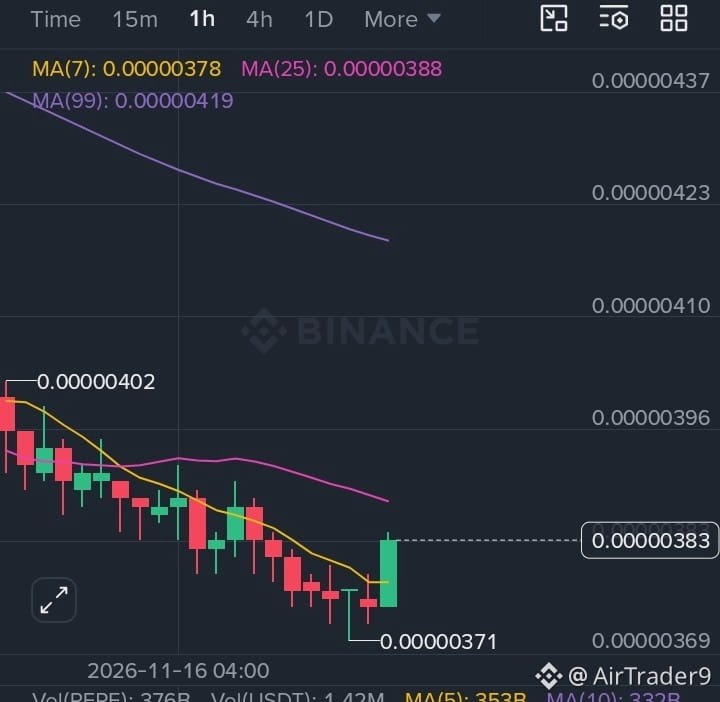
PEPE has finally shown some buying strength after dropping toward the $0.00000371 support zone.
The latest 1H candle looks encouraging, and buyers are trying to push the price higher. However, I don't think we should celebrate too early.
The first important resistance is around $0.00000388. If PEPE manages to break above this level with strong volume, we could see a move toward $0.00000396 and potentially $0.00000406.
On the downside, $0.00000371 is the key support to watch.
I'm keeping an eye on the next few candles before making any big decisions. Patience is always better than chasing a green candle
**What do you think? Is PEPE preparing for a recovery, or will sellers take control again?**
#AnthropicIPOTestsInvestorAppetiteForAI #PEPEUSDT #HuangReportedlyConsidersReturnToNvidia
🐸 $PEPE IS SHOWING SIGNS OF A POSSIBLE RECOVERY.
PEPE has finally shown some buying strength after dropping toward the $0.00000371 support zone.
The latest 1H candle looks encouraging, and buyers are trying to push the price higher. However, I don't think we should celebrate too early.
The first important resistance is around $0.00000388. If PEPE manages to break above this level with strong volume, we could see a move toward $0.00000396 and potentially $0.00000406.
On the downside, $0.00000371 is the key support to watch.
I'm keeping an eye on the next few candles before making any big decisions. Patience is always better than chasing a green candle
**What do you think? Is PEPE preparing for a recovery, or will sellers take control again?**
#AnthropicIPOTestsInvestorAppetiteForAI #PEPEUSDT #HuangReportedlyConsidersReturnToNvidia
PEPE has finally shown some buying strength after dropping toward the $0.00000371 support zone.
The latest 1H candle looks encouraging, and buyers are trying to push the price higher. However, I don't think we should celebrate too early.
The first important resistance is around $0.00000388. If PEPE manages to break above this level with strong volume, we could see a move toward $0.00000396 and potentially $0.00000406.
On the downside, $0.00000371 is the key support to watch.
I'm keeping an eye on the next few candles before making any big decisions. Patience is always better than chasing a green candle
**What do you think? Is PEPE preparing for a recovery, or will sellers take control again?**
#AnthropicIPOTestsInvestorAppetiteForAI #PEPEUSDT #HuangReportedlyConsidersReturnToNvidia
1
1
476
·
--
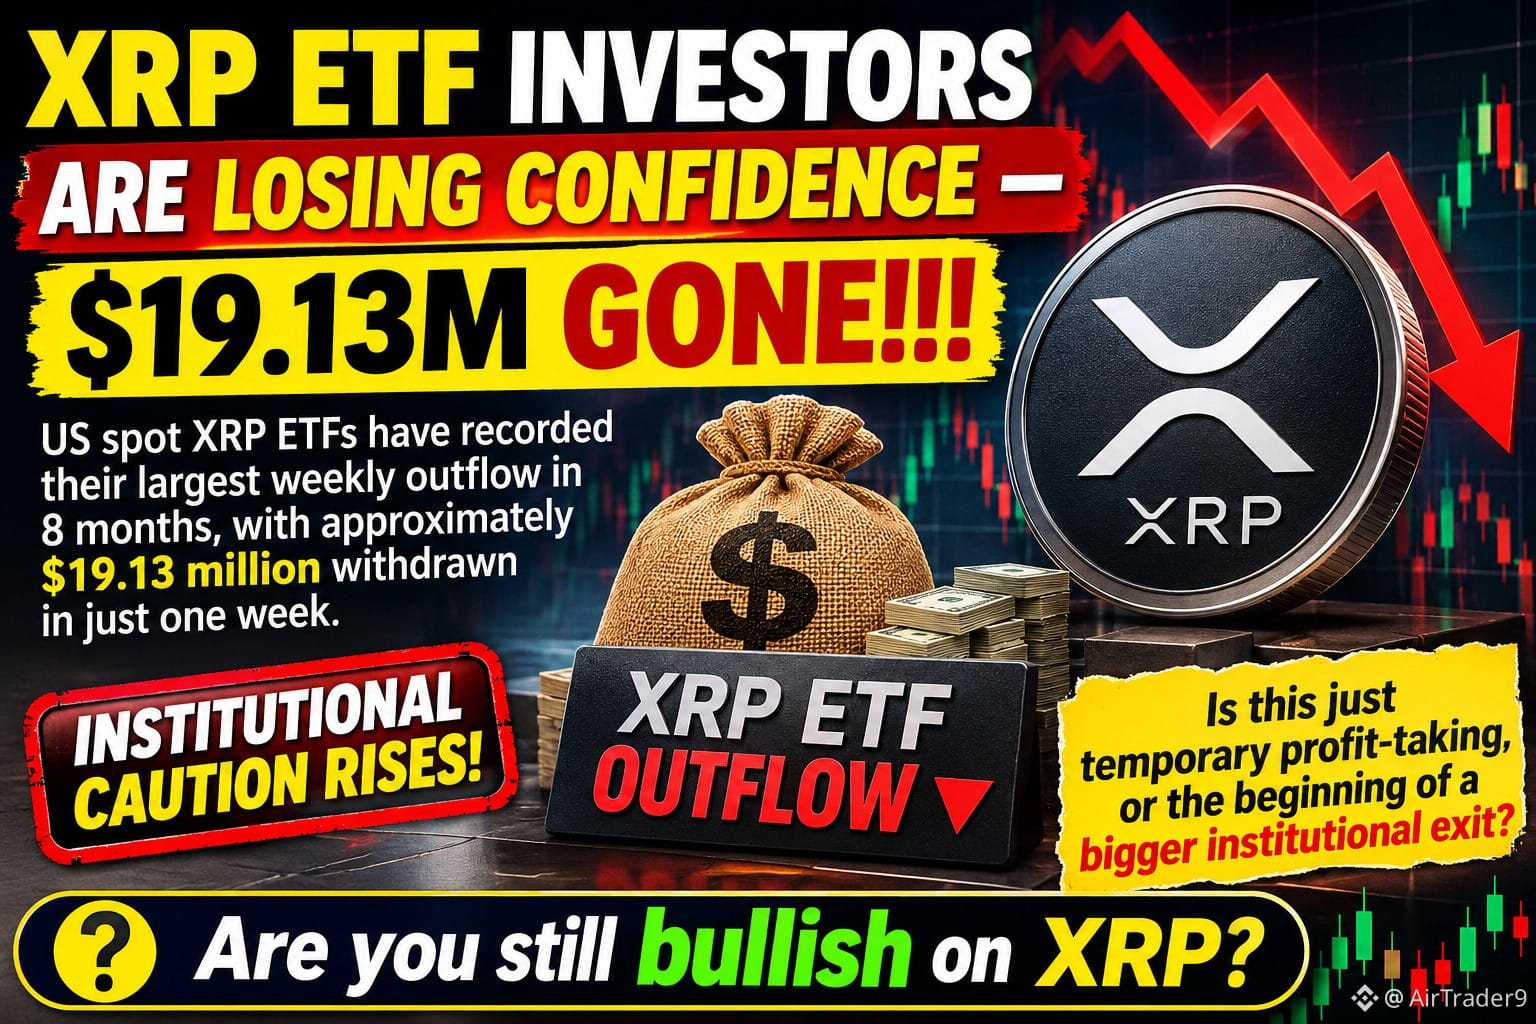
A major warning sign has appeared in the $XRP market
US spot $XRP ETFs have reportedly recorded their largest weekly outflow in 8 months, with approximately $19.13 million withdrawn in just one week!
This development raises concerns about institutional investor sentiment.
🔴 What does this mean for $XRP
Institutional money is showing signs of caution.
ETF outflows could increase selling pressure.
Market confidence may weaken if withdrawals continue.
XRP's recovery could face additional challenges.
However, one week of outflows doesn't necessarily mean institutions have abandoned XRP.
👀 The BIG question:
Is this simply temporary profit-taking, or are institutional investors preparing for a bigger exit?
I'm watching ETF flows, trading volume, and important support levels closely.
🔥 Are you still BULLISH on $XRP, or is it time to be cautious?
#XRPRealityCheck #Ripple #CryptoNews #CryptoMarket #Trading
A major warning sign has appeared in the $XRP market
US spot $XRP ETFs have reportedly recorded their largest weekly outflow in 8 months, with approximately $19.13 million withdrawn in just one week!
This development raises concerns about institutional investor sentiment.
🔴 What does this mean for $XRP
Institutional money is showing signs of caution.
ETF outflows could increase selling pressure.
Market confidence may weaken if withdrawals continue.
XRP's recovery could face additional challenges.
However, one week of outflows doesn't necessarily mean institutions have abandoned XRP.
👀 The BIG question:
Is this simply temporary profit-taking, or are institutional investors preparing for a bigger exit?
I'm watching ETF flows, trading volume, and important support levels closely.
🔥 Are you still BULLISH on $XRP , or is it time to be cautious?
#XRPRealityCheck #Ripple #CryptoNews #CryptoMarket #Trading
US spot $XRP ETFs have reportedly recorded their largest weekly outflow in 8 months, with approximately $19.13 million withdrawn in just one week!
This development raises concerns about institutional investor sentiment.
🔴 What does this mean for $XRP
Institutional money is showing signs of caution.
ETF outflows could increase selling pressure.
Market confidence may weaken if withdrawals continue.
XRP's recovery could face additional challenges.
However, one week of outflows doesn't necessarily mean institutions have abandoned XRP.
👀 The BIG question:
Is this simply temporary profit-taking, or are institutional investors preparing for a bigger exit?
I'm watching ETF flows, trading volume, and important support levels closely.
🔥 Are you still BULLISH on $XRP , or is it time to be cautious?
#XRPRealityCheck #Ripple #CryptoNews #CryptoMarket #Trading
59
·
--
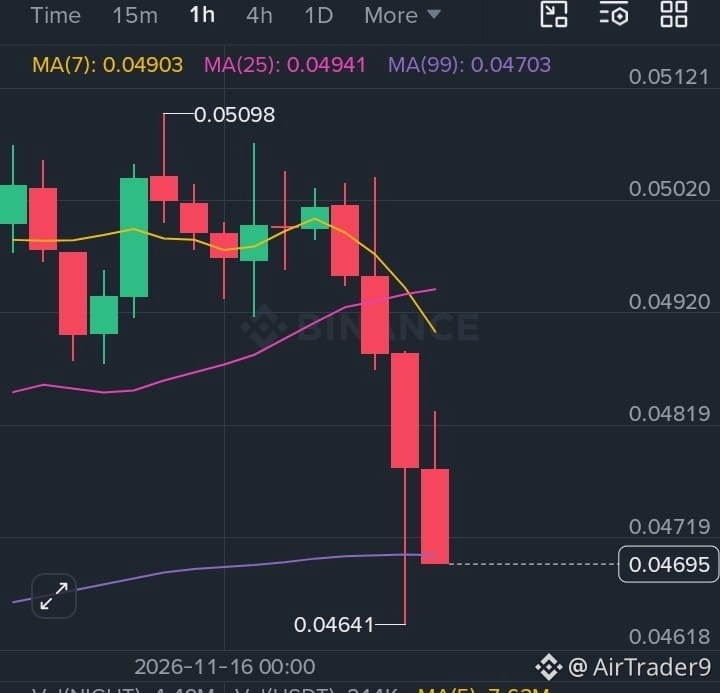
$NIGHT is facing strong selling pressure! The price is currently trading around $0.04695, showing bearish momentum on the 1-hour chart.
🔴 Market Overview:
Current Price: $0.04695
24H High: $0.05099
24H Low: $0.04641
RSI(6): 16.75 (Oversold)
MA(7): $0.04903
MA(25): $0.04941
📉 Key Support Zones:
$0.04641
$0.04618
🚀 Resistance Zones:
$0.04720
$0.04819
$0.04900–$0.04940
$NIGHT is facing strong selling pressure! The price is currently trading around $0.04695, showing bearish momentum on the 1-hour chart.
🔴 Market Overview:
Current Price: $0.04695
24H High: $0.05099
24H Low: $0.04641
RSI(6): 16.75 (Oversold)
MA(7): $0.04903
MA(25): $0.04941
📉 Key Support Zones:
$0.04641
$0.04618
🚀 Resistance Zones:
$0.04720
$0.04819
$0.04900–$0.04940
🔴 Market Overview:
Current Price: $0.04695
24H High: $0.05099
24H Low: $0.04641
RSI(6): 16.75 (Oversold)
MA(7): $0.04903
MA(25): $0.04941
📉 Key Support Zones:
$0.04641
$0.04618
🚀 Resistance Zones:
$0.04720
$0.04819
$0.04900–$0.04940
227
·
--
Bullish
{spot}(BTCUSDT)
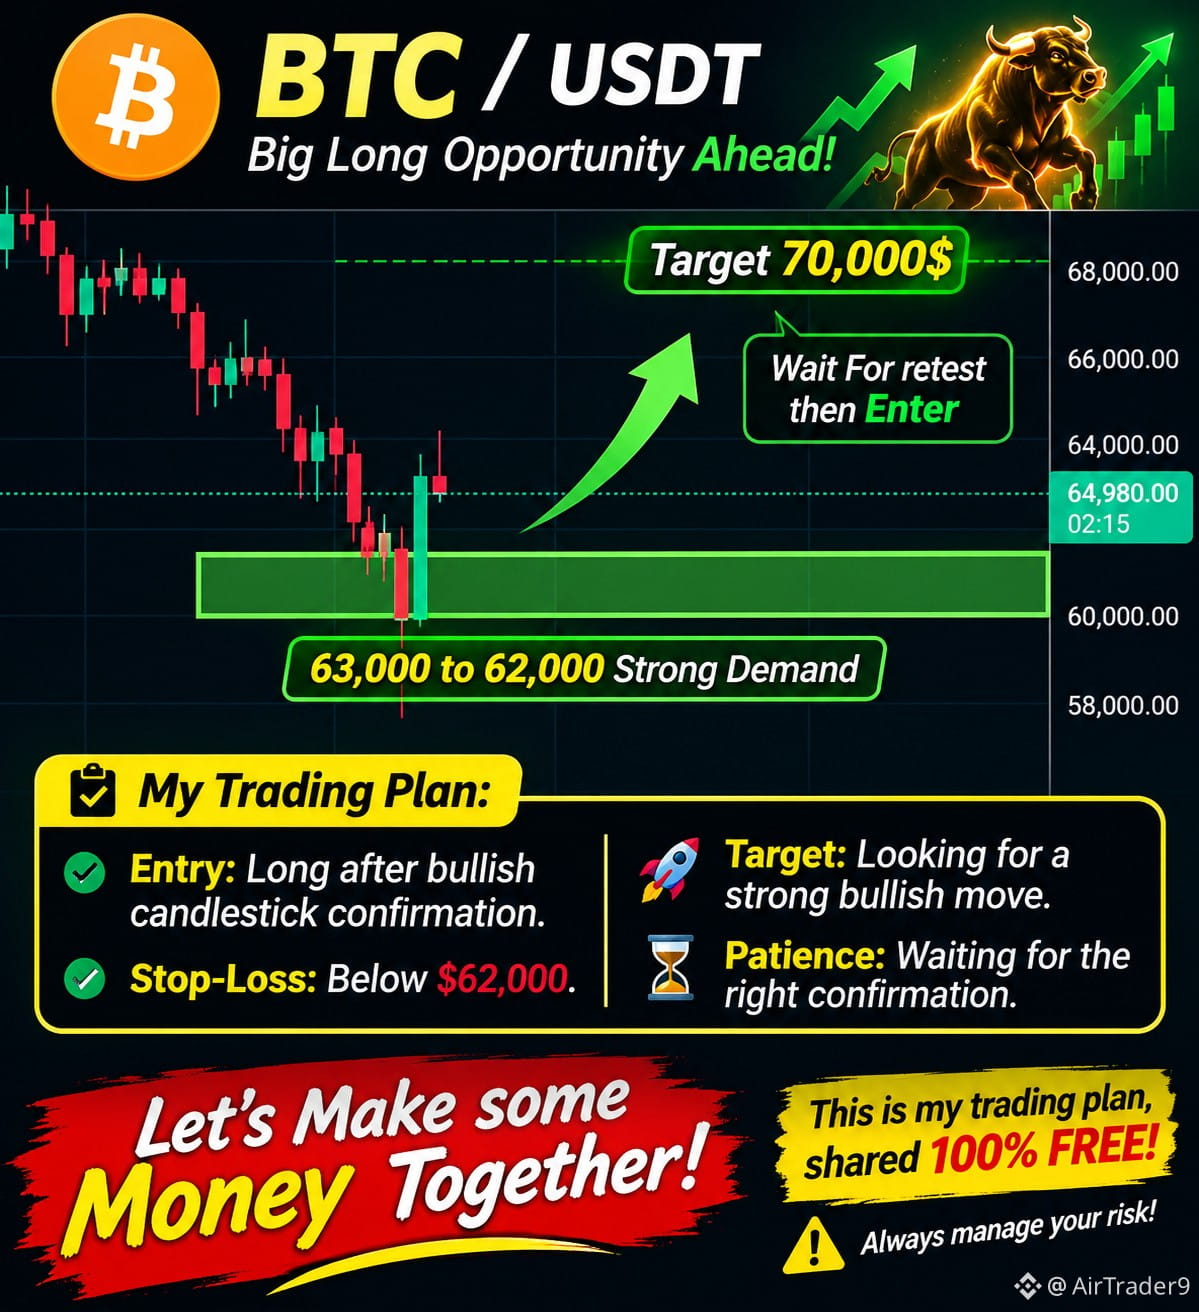
🚀 $BTC ($BTC) – BIG LONG OPPORTUNITY AHEAD!** 💰📈
I'm getting ready for another big BTC trade!
👀 Watching the **$62,000–$63,000 support zone** for a possible retest.
📊 **My Trading Strategy:**
- 🎯 Entry: Long after bullish candlestick confirmation.
- 🛑 Stop-Loss: Below $62,000.
- 📈 Target: Looking for a strong bullish move.
- ⏳ Patience: Waiting for the right confirmation before entering.
No rushing, no emotional trading — just patience, discipline, and proper risk management!
This is my trading plan, shared 100% FREE with the community. ❤️
Remember: Always manage your risk and never trade more than you can afford to lose.
**Are you ready for the next BTC move?** 🚀
#CryptoTrading #BTCanalysis #BitcoinTrading #cryptosignals #TradingStrategyLessons
🚀 $BTC ($BTC ) – BIG LONG OPPORTUNITY AHEAD!** 💰📈
I'm getting ready for another big BTC trade!
👀 Watching the **$62,000–$63,000 support zone** for a possible retest.
📊 **My Trading Strategy:**
- 🎯 Entry: Long after bullish candlestick confirmation.
- 🛑 Stop-Loss: Below $62,000.
- 📈 Target: Looking for a strong bullish move.
- ⏳ Patience: Waiting for the right confirmation before entering.
No rushing, no emotional trading — just patience, discipline, and proper risk management!
This is my trading plan, shared 100% FREE with the community. ❤️
Remember: Always manage your risk and never trade more than you can afford to lose.
**Are you ready for the next BTC move?** 🚀
#CryptoTrading #BTCanalysis #BitcoinTrading #cryptosignals #TradingStrategyLessons
I'm getting ready for another big BTC trade!
👀 Watching the **$62,000–$63,000 support zone** for a possible retest.
📊 **My Trading Strategy:**
- 🎯 Entry: Long after bullish candlestick confirmation.
- 🛑 Stop-Loss: Below $62,000.
- 📈 Target: Looking for a strong bullish move.
- ⏳ Patience: Waiting for the right confirmation before entering.
No rushing, no emotional trading — just patience, discipline, and proper risk management!
This is my trading plan, shared 100% FREE with the community. ❤️
Remember: Always manage your risk and never trade more than you can afford to lose.
**Are you ready for the next BTC move?** 🚀
#CryptoTrading #BTCanalysis #BitcoinTrading #cryptosignals #TradingStrategyLessons
80
·
--
Bullish
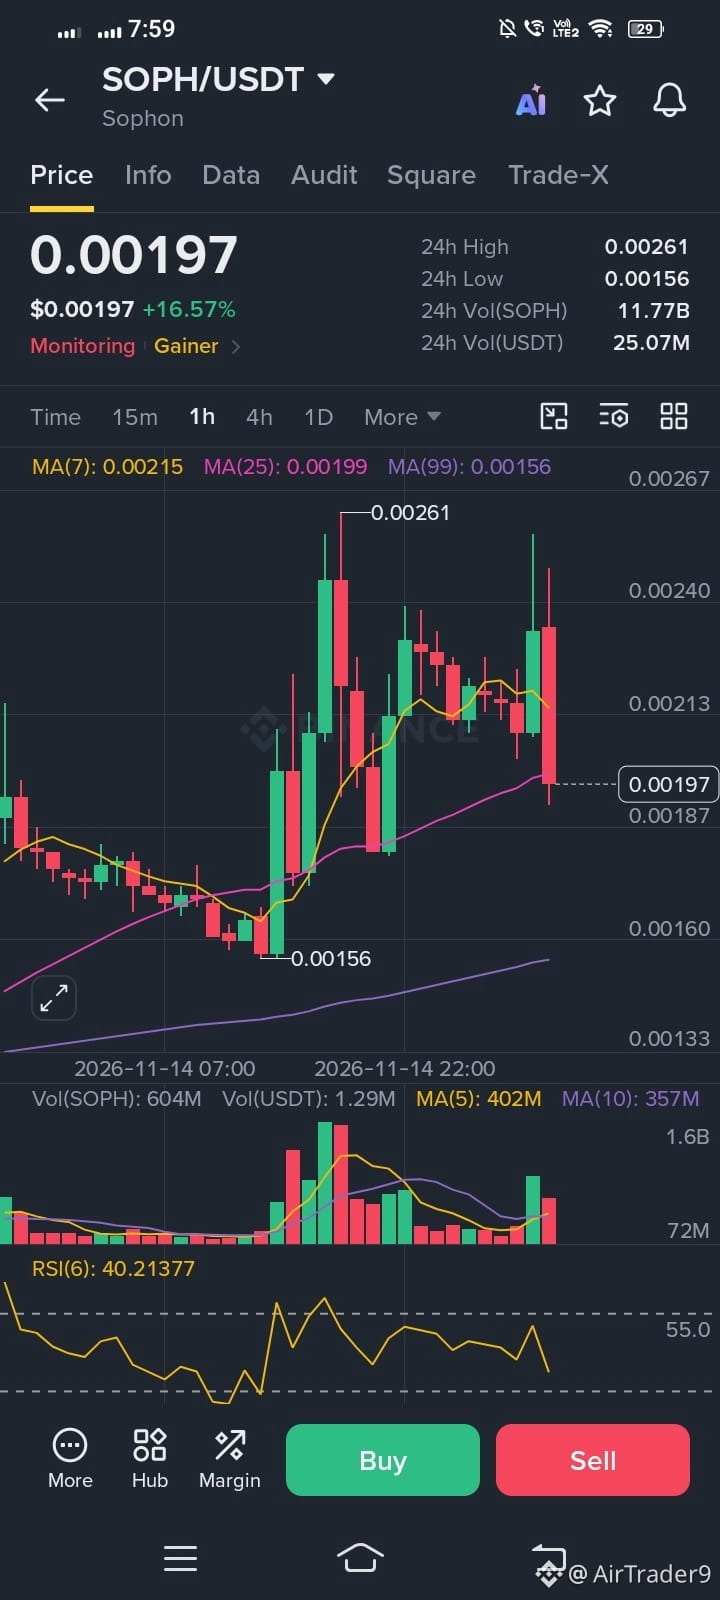
$SOPH Entry Plan (1H)
🟢 Buy: 0.00187–0.00192 (on bounce)
🔴 Sell: Below 0.00187 (on breakdown)
🎯 TP: 0.00205 / 0.00213
🛑 SL: 0.00182 (long)
My view: Wait for confirmation before entering.
Send the 15m chart for a more precise entry.
{future}(SOPHUSDT)
$SOPH Entry Plan (1H)
🟢 Buy: 0.00187–0.00192 (on bounce)
🔴 Sell: Below 0.00187 (on breakdown)
🎯 TP: 0.00205 / 0.00213
🛑 SL: 0.00182 (long)
My view: Wait for confirmation before entering.
Send the 15m chart for a more precise entry.
🟢 Buy: 0.00187–0.00192 (on bounce)
🔴 Sell: Below 0.00187 (on breakdown)
🎯 TP: 0.00205 / 0.00213
🛑 SL: 0.00182 (long)
My view: Wait for confirmation before entering.
Send the 15m chart for a more precise entry.
120
·
--
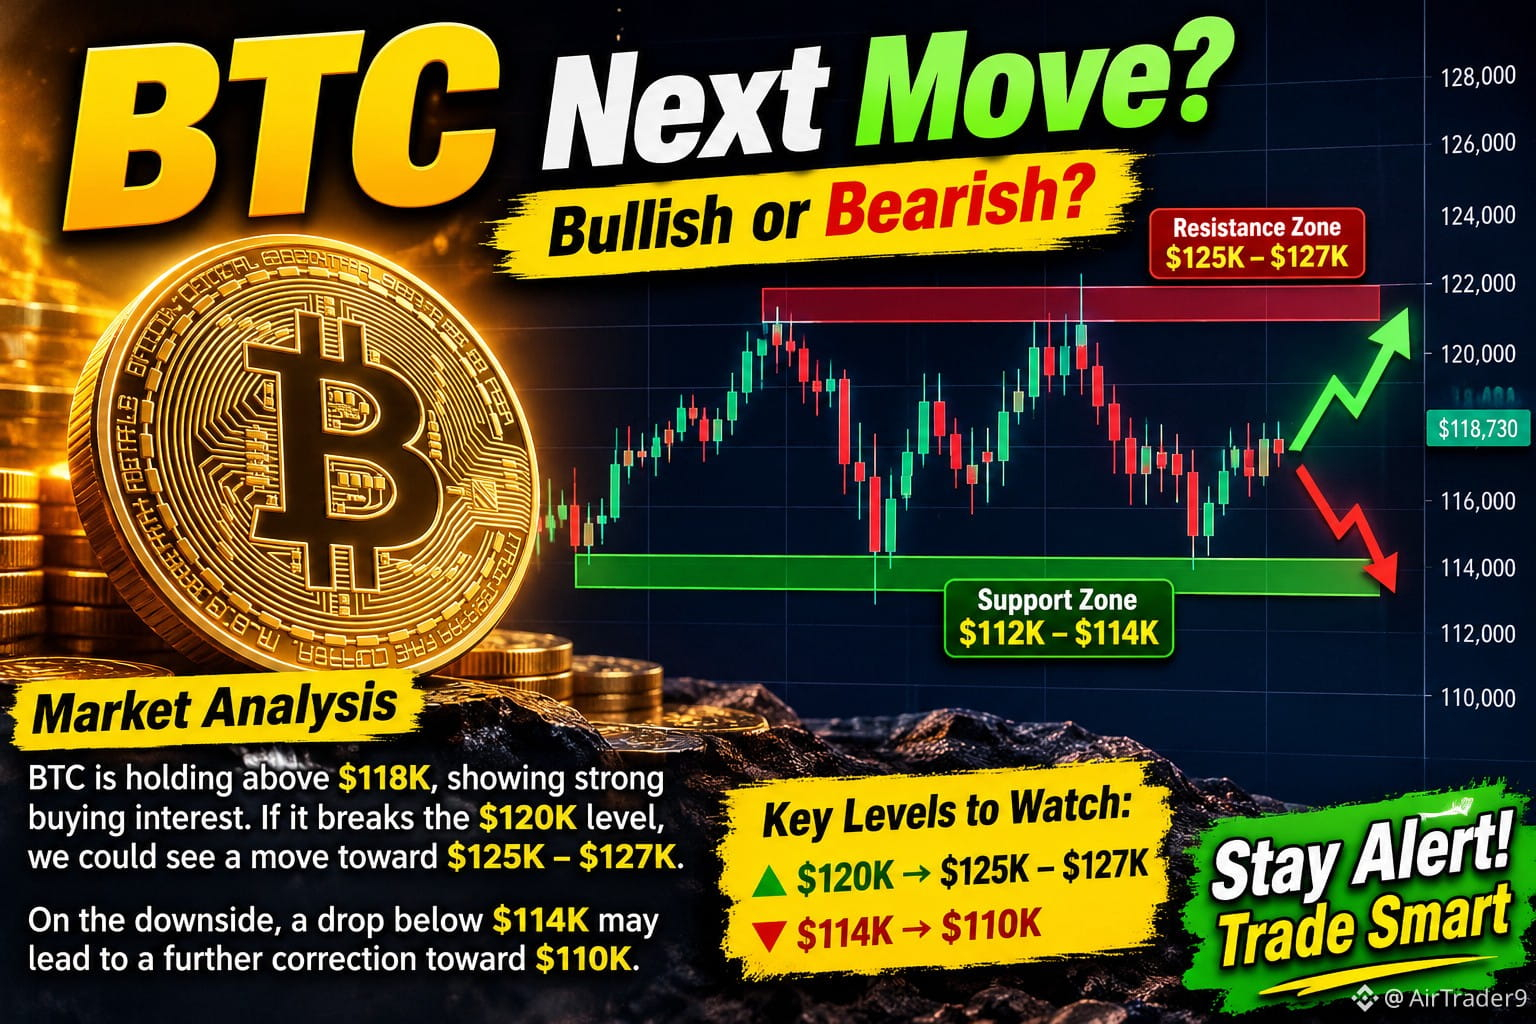
$BTC is showing interesting market activity, and the next move could be very important! 🟠
$BTC bulls are trying to regain control, but sellers are also watching the key resistance zones closely.
📊 Key Levels to Watch:
🟢 Resistance: $120,000
🚀 Bullish target: $125,000–$127,000
🔴 Support: $114,000
⚠️ Breakdown target: $110,000
My Trading View:
If BTC breaks above resistance with strong buying volume, we could see another bullish rally. However, if sellers take control and BTC loses support, a deeper correction may follow.
💡 Don't chase the market blindly. Wait for confirmation, manage your risk, and trade smart!
🔥 What do you think?
Are we going to see BTC at $125K+ or another big correction?
👇 Comment your BTC target!
#BTC #bitcoin #BitcoinAnalysis #CryptoMarket #Binance
{future}(BTCUSDT)
$BTC is showing interesting market activity, and the next move could be very important! 🟠
$BTC bulls are trying to regain control, but sellers are also watching the key resistance zones closely.
📊 Key Levels to Watch:
🟢 Resistance: $120,000
🚀 Bullish target: $125,000–$127,000
🔴 Support: $114,000
⚠️ Breakdown target: $110,000
My Trading View:
If BTC breaks above resistance with strong buying volume, we could see another bullish rally. However, if sellers take control and BTC loses support, a deeper correction may follow.
💡 Don't chase the market blindly. Wait for confirmation, manage your risk, and trade smart!
🔥 What do you think?
Are we going to see BTC at $125K+ or another big correction?
👇 Comment your BTC target!
#BTC #bitcoin #BitcoinAnalysis #CryptoMarket #Binance
$BTC bulls are trying to regain control, but sellers are also watching the key resistance zones closely.
📊 Key Levels to Watch:
🟢 Resistance: $120,000
🚀 Bullish target: $125,000–$127,000
🔴 Support: $114,000
⚠️ Breakdown target: $110,000
My Trading View:
If BTC breaks above resistance with strong buying volume, we could see another bullish rally. However, if sellers take control and BTC loses support, a deeper correction may follow.
💡 Don't chase the market blindly. Wait for confirmation, manage your risk, and trade smart!
🔥 What do you think?
Are we going to see BTC at $125K+ or another big correction?
👇 Comment your BTC target!
#BTC #bitcoin #BitcoinAnalysis #CryptoMarket #Binance
84
·
--
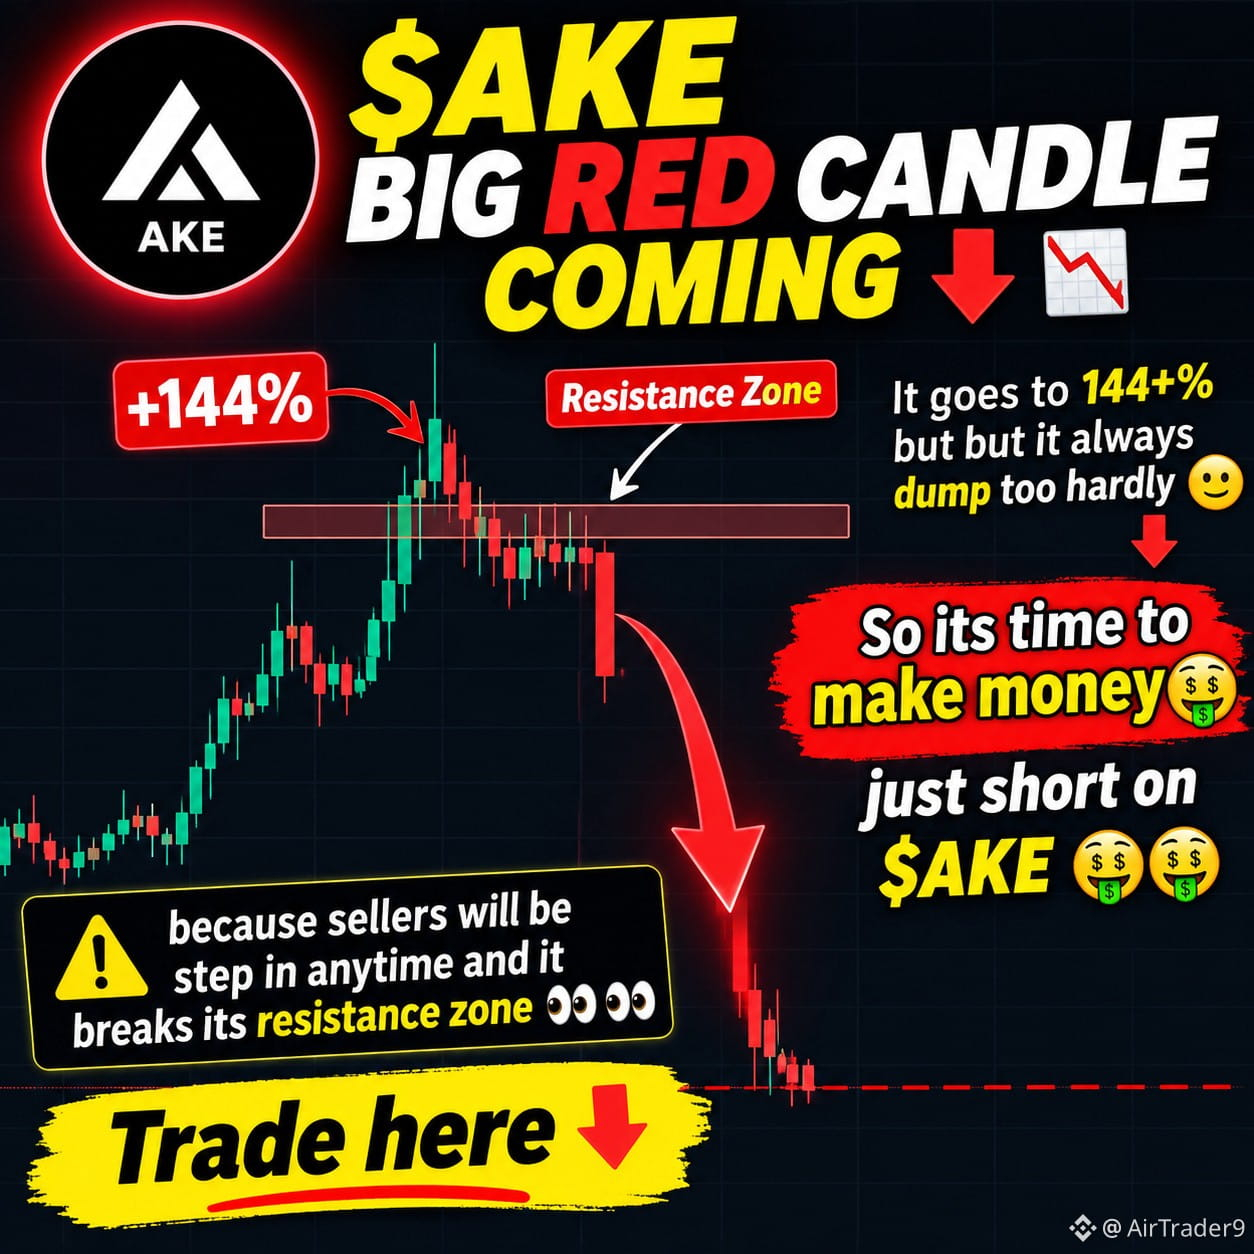
# 🚨 $AKE — Is a Big Red Candle Coming? 📉🔴
Hello traders! 👋
$AKE has made an impressive move, pumping more than **144%+** recently. 🚀 But here's the big question: can this bullish momentum continue, or are sellers preparing to take control?
After such a strong rally, profit-taking could increase, and selling pressure may appear at important resistance levels.
👀 **Things I'm watching on $AKE :**
- 🔴 A possible rejection near the resistance zone.
- 📉 Increasing selling pressure.
- ⚠️ A potential bearish breakdown.
- 📊 Trading volume and confirmation before entering a position.
If sellers step in and price confirms a breakdown, a short setup could become interesting. However, nothing is guaranteed in crypto — always use a stop-loss and manage your risk.
💬 **What's your opinion?**
Are you bullish on $AKE, or do you think a big red candle is coming?
👇 Share your thoughts!
{future}(AKEUSDT)
#AKE #crypto #trading #ShortTrading #Altcoins
# 🚨 $AKE — Is a Big Red Candle Coming? 📉🔴
Hello traders! 👋
$AKE has made an impressive move, pumping more than **144%+** recently. 🚀 But here's the big question: can this bullish momentum continue, or are sellers preparing to take control?
After such a strong rally, profit-taking could increase, and selling pressure may appear at important resistance levels.
👀 **Things I'm watching on $AKE :**
- 🔴 A possible rejection near the resistance zone.
- 📉 Increasing selling pressure.
- ⚠️ A potential bearish breakdown.
- 📊 Trading volume and confirmation before entering a position.
If sellers step in and price confirms a breakdown, a short setup could become interesting. However, nothing is guaranteed in crypto — always use a stop-loss and manage your risk.
💬 **What's your opinion?**
Are you bullish on $AKE , or do you think a big red candle is coming?
👇 Share your thoughts!
#AKE #crypto #trading #ShortTrading #Altcoins
Hello traders! 👋
$AKE has made an impressive move, pumping more than **144%+** recently. 🚀 But here's the big question: can this bullish momentum continue, or are sellers preparing to take control?
After such a strong rally, profit-taking could increase, and selling pressure may appear at important resistance levels.
👀 **Things I'm watching on $AKE :**
- 🔴 A possible rejection near the resistance zone.
- 📉 Increasing selling pressure.
- ⚠️ A potential bearish breakdown.
- 📊 Trading volume and confirmation before entering a position.
If sellers step in and price confirms a breakdown, a short setup could become interesting. However, nothing is guaranteed in crypto — always use a stop-loss and manage your risk.
💬 **What's your opinion?**
Are you bullish on $AKE , or do you think a big red candle is coming?
👇 Share your thoughts!
#AKE #crypto #trading #ShortTrading #Altcoins
373
·
--
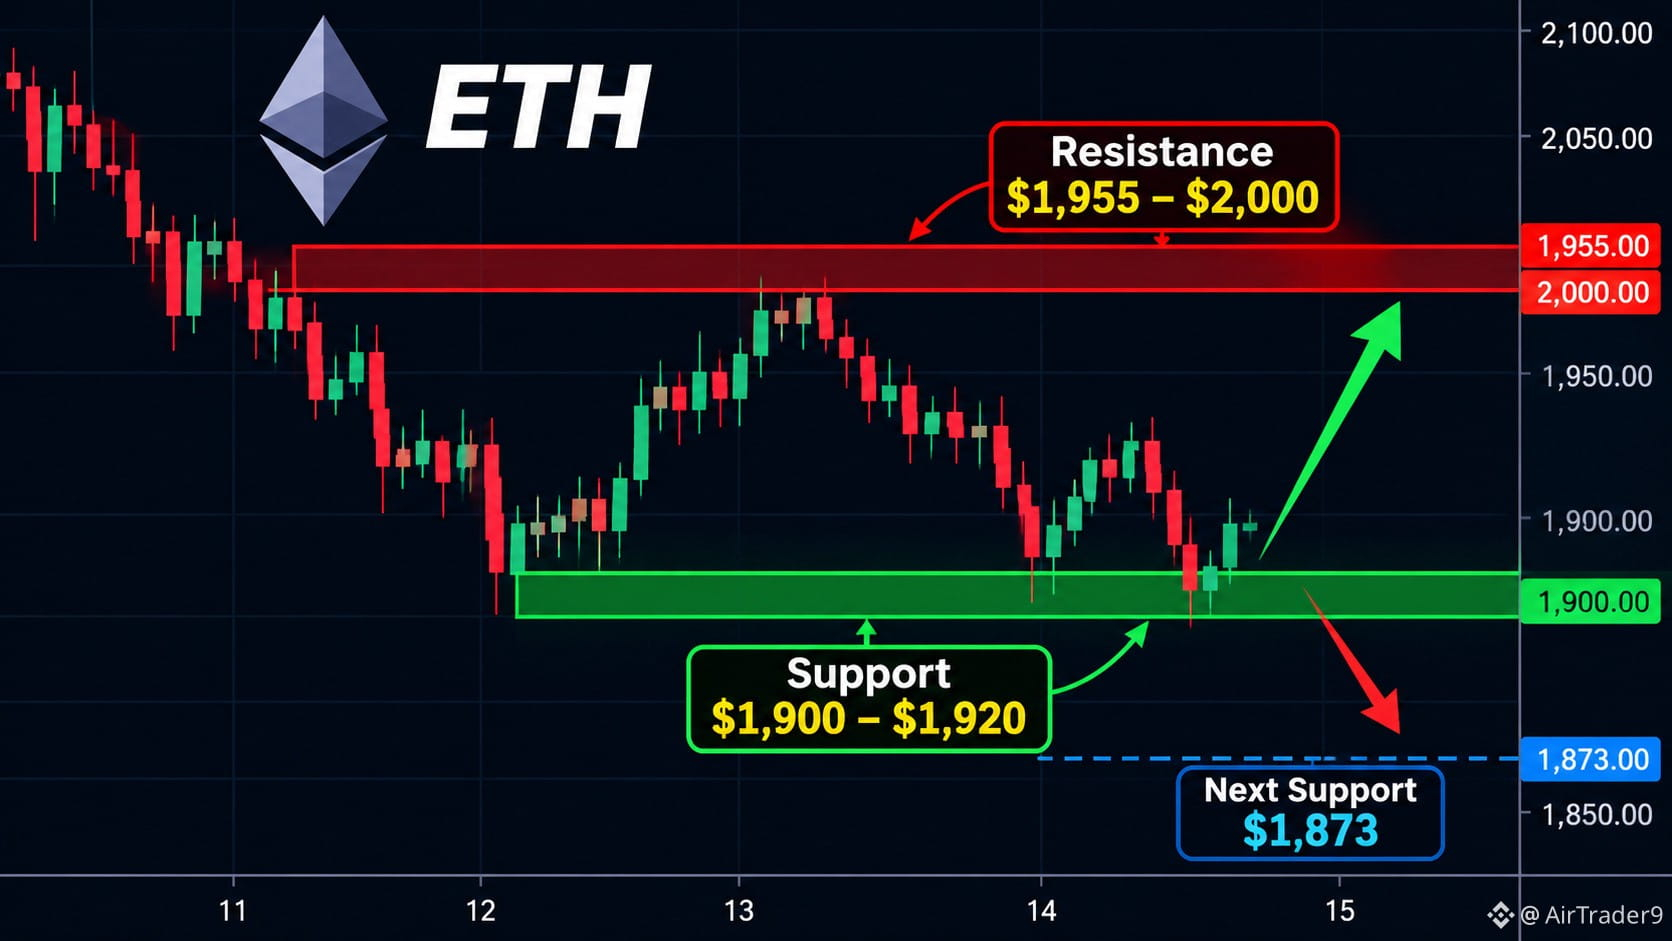
🚨 ($ETH ) LATEST MARKET ANALYSIS**
📉 $ETH is facing strong selling pressure and currently showing a bearish short-term structure.
**Key levels to watch:**
- 🟢 Support: $1,900–$1,920
- 🔵 Next support: $1,873
- 🔴 Resistance: $1,955–$2,000
**Market outlook:**
If $ETH holds the $1,900 support zone, we could see a relief bounce toward $1,955–$2,000.
However, a clean breakdown below $1,900 could trigger another downside move toward $1,873.
**My view:** Stay cautious. Wait for confirmation before entering a trade. A breakout above resistance could change the short-term trend.
#ETH #Ethereum #CryptoAnalysis #Binance #TradingSignals
{spot}(ETHUSDT)
🚨 ($ETH ) LATEST MARKET ANALYSIS**
📉 $ETH is facing strong selling pressure and currently showing a bearish short-term structure.
**Key levels to watch:**
- 🟢 Support: $1,900–$1,920
- 🔵 Next support: $1,873
- 🔴 Resistance: $1,955–$2,000
**Market outlook:**
If $ETH holds the $1,900 support zone, we could see a relief bounce toward $1,955–$2,000.
However, a clean breakdown below $1,900 could trigger another downside move toward $1,873.
**My view:** Stay cautious. Wait for confirmation before entering a trade. A breakout above resistance could change the short-term trend.
#ETH #Ethereum #CryptoAnalysis #Binance #TradingSignals
📉 $ETH is facing strong selling pressure and currently showing a bearish short-term structure.
**Key levels to watch:**
- 🟢 Support: $1,900–$1,920
- 🔵 Next support: $1,873
- 🔴 Resistance: $1,955–$2,000
**Market outlook:**
If $ETH holds the $1,900 support zone, we could see a relief bounce toward $1,955–$2,000.
However, a clean breakdown below $1,900 could trigger another downside move toward $1,873.
**My view:** Stay cautious. Wait for confirmation before entering a trade. A breakout above resistance could change the short-term trend.
#ETH #Ethereum #CryptoAnalysis #Binance #TradingSignals
123
·
--
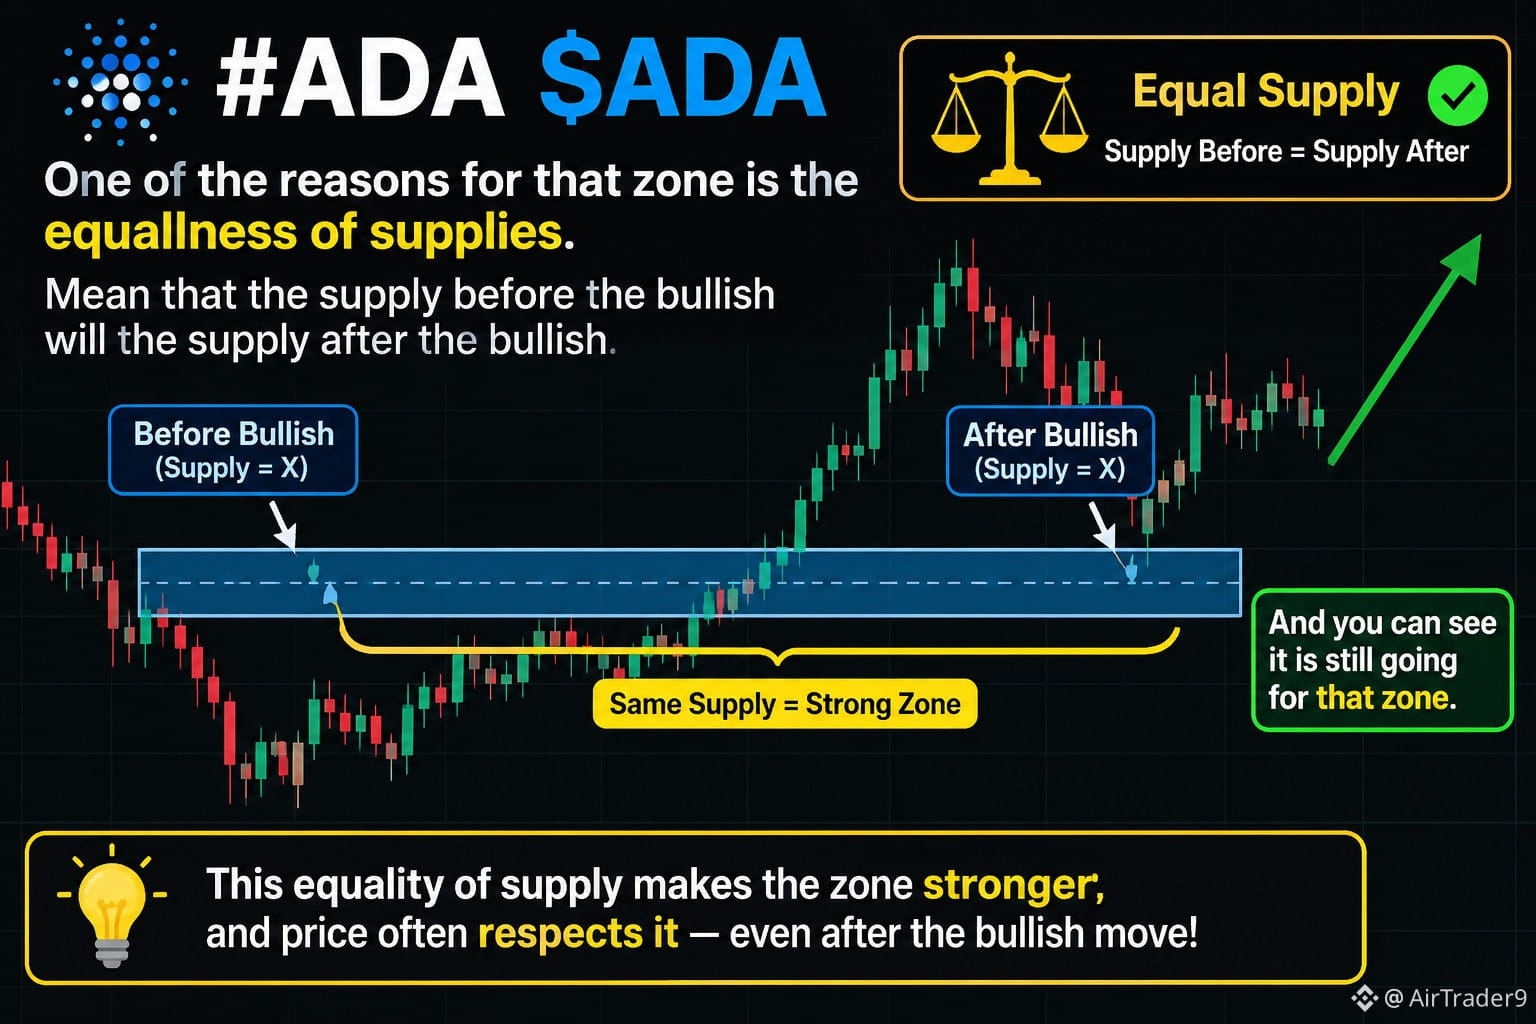
$ADA One of the key reasons behind this important zone on the **Cardano ($ADA )** chart is the equality of supply.
In simple terms, the supply before the bullish move is approximately equal to the supply after the bullish move. This creates an interesting balance in the market and makes the zone worth watching.
As we can see on the chart, $ADA is still moving toward this zone. If price respects it, it could become an important area for a potential reaction.
**Keep an eye on this level.** Market structure, volume, and price action will be important in confirming the next move.
#WhatWillDriveCryptoandStocks’NextRebound? #Anthropic’s6xIPODemandSignalsPotentialRecordRaise
{spot}(ADAUSDT)
$ADA One of the key reasons behind this important zone on the **Cardano ($ADA )** chart is the equality of supply.
In simple terms, the supply before the bullish move is approximately equal to the supply after the bullish move. This creates an interesting balance in the market and makes the zone worth watching.
As we can see on the chart, $ADA is still moving toward this zone. If price respects it, it could become an important area for a potential reaction.
**Keep an eye on this level.** Market structure, volume, and price action will be important in confirming the next move.
#WhatWillDriveCryptoandStocks’NextRebound? #Anthropic’s6xIPODemandSignalsPotentialRecordRaise
In simple terms, the supply before the bullish move is approximately equal to the supply after the bullish move. This creates an interesting balance in the market and makes the zone worth watching.
As we can see on the chart, $ADA is still moving toward this zone. If price respects it, it could become an important area for a potential reaction.
**Keep an eye on this level.** Market structure, volume, and price action will be important in confirming the next move.
#WhatWillDriveCryptoandStocks’NextRebound? #Anthropic’s6xIPODemandSignalsPotentialRecordRaise
1
3
566
Log in to explore more content
Join global crypto users on Binance Square
⚡️ Get latest and useful information about crypto.
💬 Trusted by the world’s largest crypto exchange.
👍 Discover real insights from verified creators.
Email / Phone number
Trending Topics
AnthropicToDebutAfter$83IPOPricing
15,333 views
168 Discussing
Stock Futures Hold Near Flat as Anthropic Prices IPO at $83 Ahead of Debut
Binance News
·8 Likes
·7.7k views
BTCRemainsUnderPressureAfterHawkishFOMCMinutes
57,463 views
1,358 Discussing
NvidiaBoardReportedlySplitOverHuang’sReturn
19,065 views
664 Discussing