
classical zoro
1.5k Posts

classical zoro
Report
Block User
I'm crypto Trader who Trades with Trend
Occasional Trader
1.3 Years
2 Following
648 Followers
4.5K+ Liked
Posts
All
Quotes
·
--
Bearish
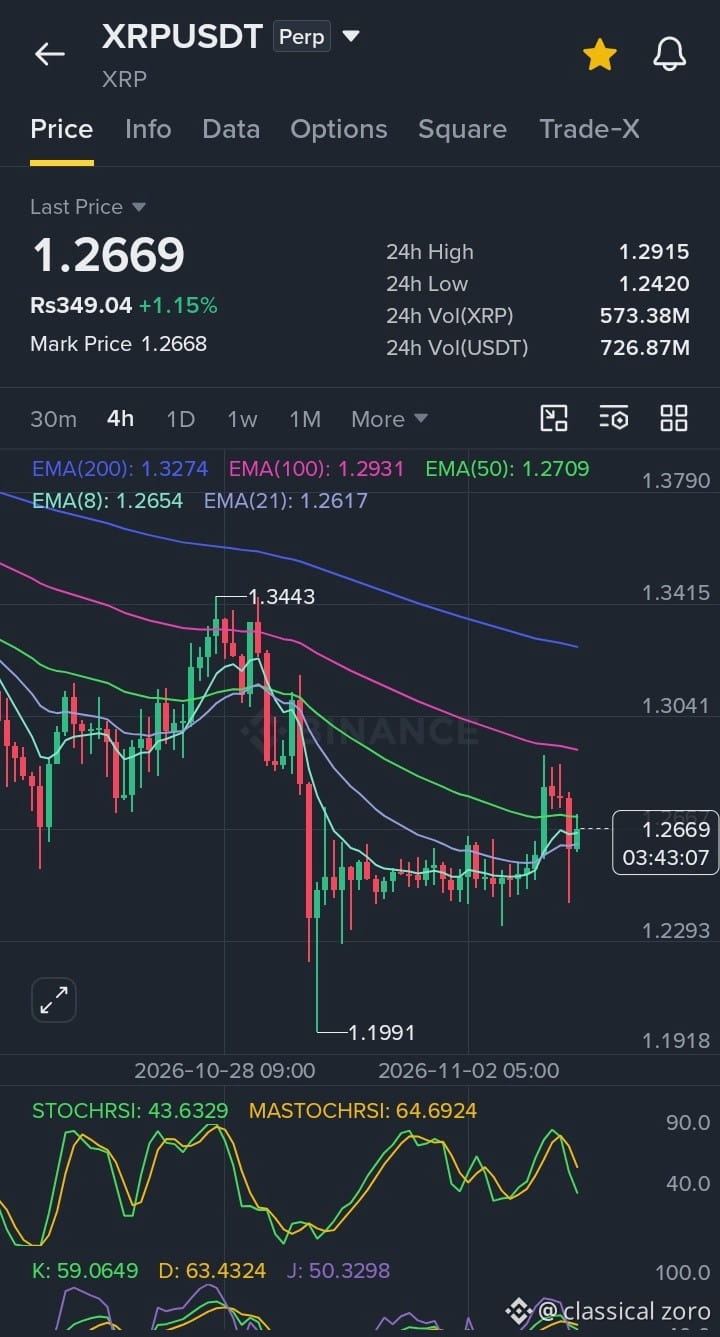
$XRP • Short Setup • 4H Timeframe
Price just rejected from the 50 EMA, which is acting as a resistance level. Price confirmed a short setup with a bearish candle close, high volume, and a Stoch RSI bearish crossover. I know the candle wick is to the downside, indicating buying pressure, so I also took confirmations from higher timeframes. Therefore, this setup is valid as long as our SL is safe.
Here is the exact setup:
Entry: 1.267
Take-Profit: 1.222
Stop-Loss: 1.293
NOTE: Don't chase the price. If the SL hits, close the trade; otherwise, you may face liquidation risk. Always use 1%-2% of your portfolio for trading to avoid liquidation risk. • Always DYOR
{future}(XRPUSDT)
#Xrp🔥🔥 #xrp #XRPUSDT🚨 #FutureTrading #BinancePick
$XRP • Short Setup • 4H Timeframe
Price just rejected from the 50 EMA, which is acting as a resistance level. Price confirmed a short setup with a bearish candle close, high volume, and a Stoch RSI bearish crossover. I know the candle wick is to the downside, indicating buying pressure, so I also took confirmations from higher timeframes. Therefore, this setup is valid as long as our SL is safe.
Here is the exact setup:
Entry: 1.267
Take-Profit: 1.222
Stop-Loss: 1.293
NOTE: Don't chase the price. If the SL hits, close the trade; otherwise, you may face liquidation risk. Always use 1%-2% of your portfolio for trading to avoid liquidation risk. • Always DYOR
#Xrp🔥🔥 #xrp #XRPUSDT🚨 #FutureTrading #BinancePick
Price just rejected from the 50 EMA, which is acting as a resistance level. Price confirmed a short setup with a bearish candle close, high volume, and a Stoch RSI bearish crossover. I know the candle wick is to the downside, indicating buying pressure, so I also took confirmations from higher timeframes. Therefore, this setup is valid as long as our SL is safe.
Here is the exact setup:
Entry: 1.267
Take-Profit: 1.222
Stop-Loss: 1.293
NOTE: Don't chase the price. If the SL hits, close the trade; otherwise, you may face liquidation risk. Always use 1%-2% of your portfolio for trading to avoid liquidation risk. • Always DYOR
#Xrp🔥🔥 #xrp #XRPUSDT🚨 #FutureTrading #BinancePick
2
121
·
--
Bearish
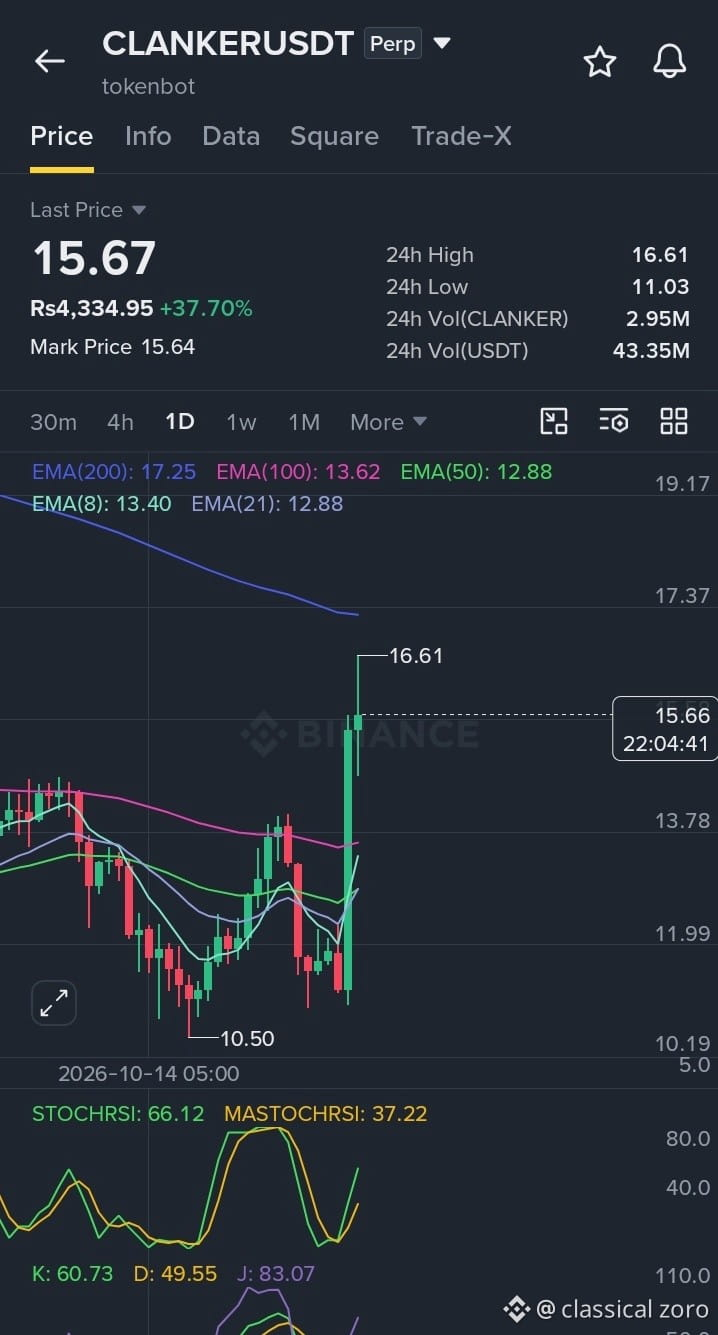
$CLANKER pumped hard. Now waiting for it to touch the 200 EMA so I can short it from there. 😉
{future}(CLANKERUSDT)
$CLANKER pumped hard. Now waiting for it to touch the 200 EMA so I can short it from there. 😉
3
380
·
--
Bullish
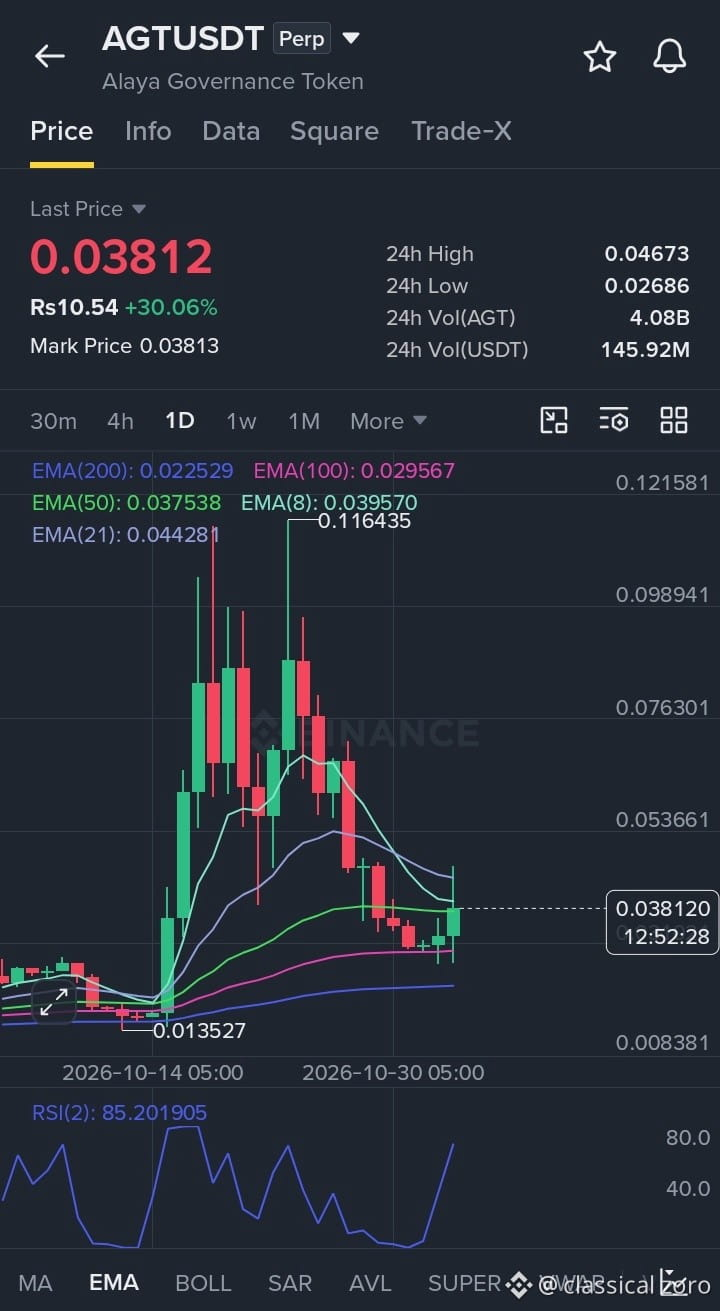
$AGT is seeing a clear bounce from its 100 EMA, which is acting as strong support. If this daily candle closes above the 8 EMA, I'll consider a long setup. 📈
{future}(AGTUSDT)
$AGT is seeing a clear bounce from its 100 EMA, which is acting as strong support. If this daily candle closes above the 8 EMA, I'll consider a long setup. 📈
1
2
732
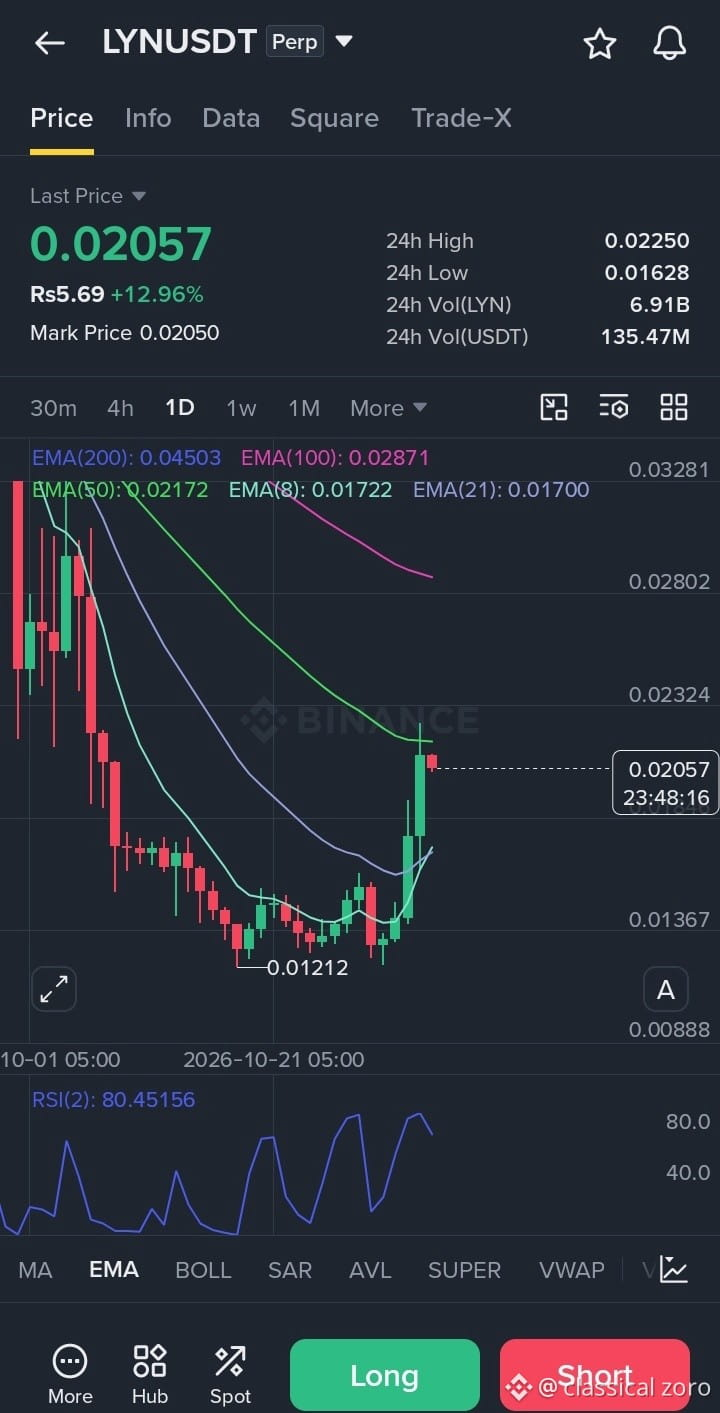
$LYN is testing the 50 EMA, which is acting as short-term resistance after that solid bullish reaction. The RSI is also rejecting from 97 down to 80.
On the daily timeframe, if you're planning a short, wait for 4H confirmation: a strong bearish candle close with higher volume than the previous two candles. That’s your signal to enter.
Are you currently holding a long, or just thinking about shorting out of FOMO? 😆
{future}(LYNUSDT)
#BinancePick #LYNUSDT
$LYN is testing the 50 EMA, which is acting as short-term resistance after that solid bullish reaction. The RSI is also rejecting from 97 down to 80.
On the daily timeframe, if you're planning a short, wait for 4H confirmation: a strong bearish candle close with higher volume than the previous two candles. That’s your signal to enter.
Are you currently holding a long, or just thinking about shorting out of FOMO? 😆
#BinancePick #LYNUSDT
On the daily timeframe, if you're planning a short, wait for 4H confirmation: a strong bearish candle close with higher volume than the previous two candles. That’s your signal to enter.
Are you currently holding a long, or just thinking about shorting out of FOMO? 😆
#BinancePick #LYNUSDT
2
3
628
·
--
Bearish
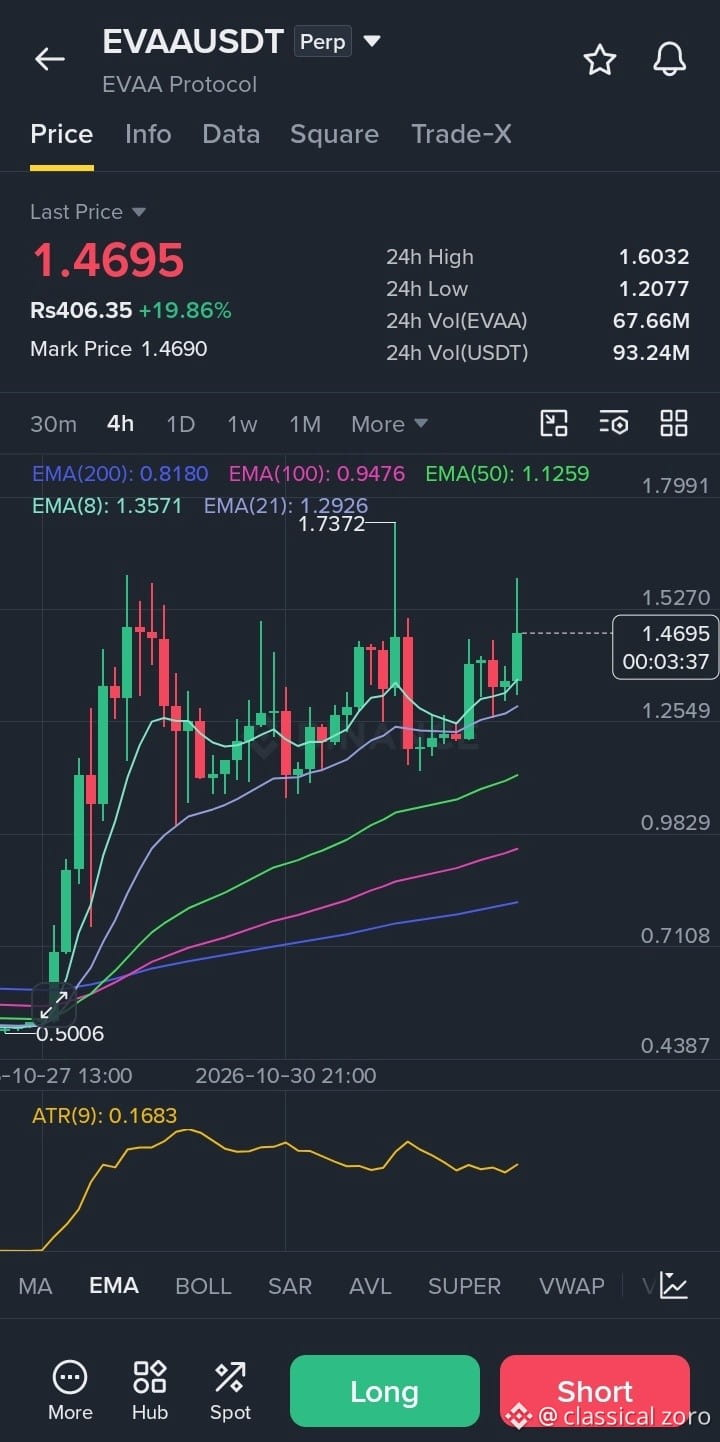
$EVAA keeps taking support from the 21 EMA, but no strong breakout of the previous 1.73 high has happened, and the trend is looking flat. The ATR is also telling us the same thing—it's looking straight. This indicates the bullish trend is tired and could turn bearish at any time. 📉
$EVAA keeps taking support from the 21 EMA, but no strong breakout of the previous 1.73 high has happened, and the trend is looking flat. The ATR is also telling us the same thing—it's looking straight. This indicates the bullish trend is tired and could turn bearish at any time. 📉
2
2
416
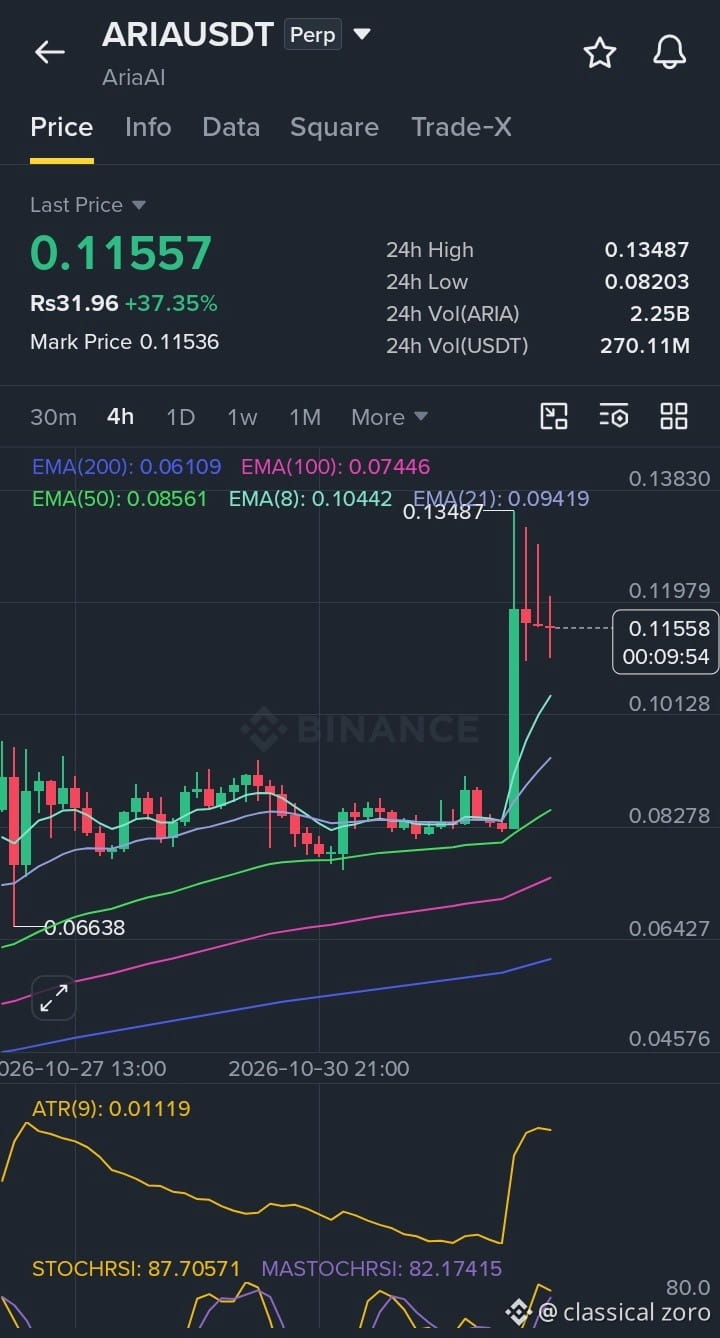
$ARIA bullish momentum is dying, but there isn't any strong bearish candle. Is this a trap, or is a downside move loading? 👀
$ARIA bullish momentum is dying, but there isn't any strong bearish candle. Is this a trap, or is a downside move loading? 👀
2
2
423
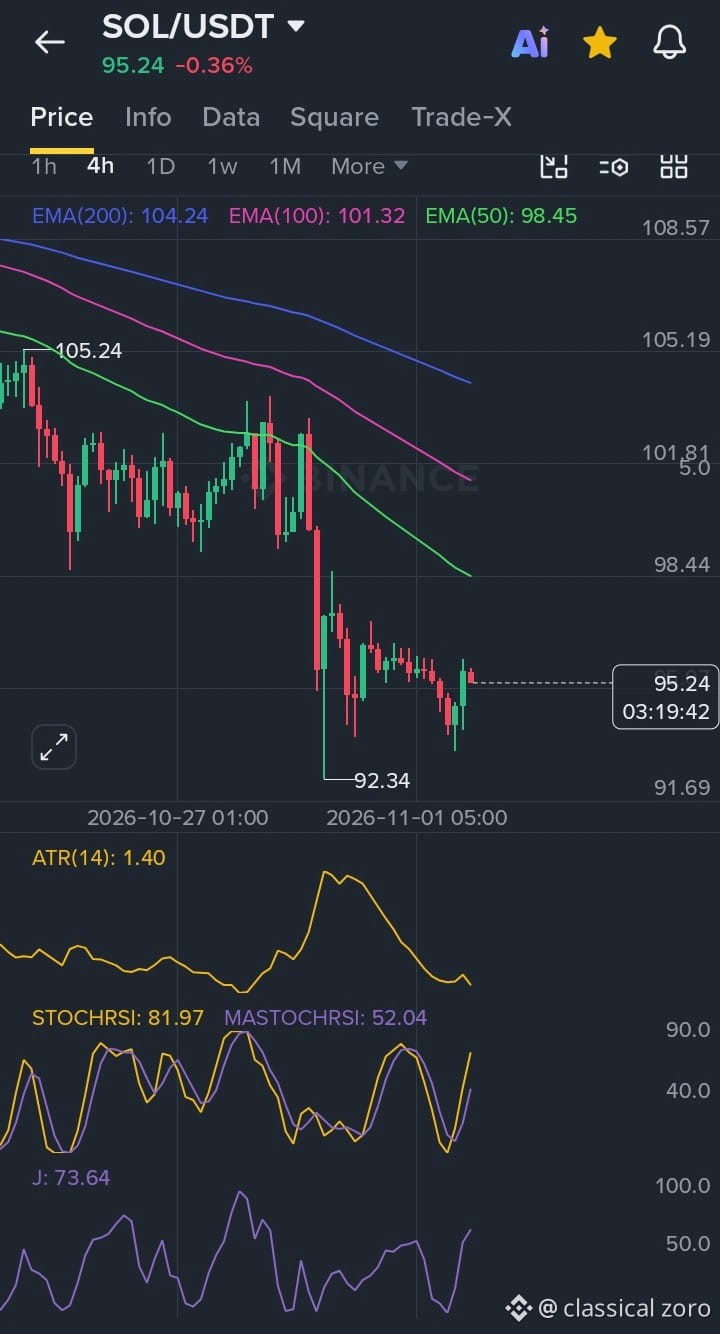
Can $SOL rise from here? The answer is yes, but the probability of this is very low since the trend is bearish. As you can see, all EMAs (200, 100, 50) are above the price. However, the Stoch RSI bullish cross is telling us that momentum is to the upside, and the J line of KDJ at 73.64 also indicates that market pressure is to the upside. Do you think a bounce will happen, or will the price keep falling?
Can $SOL rise from here? The answer is yes, but the probability of this is very low since the trend is bearish. As you can see, all EMAs (200, 100, 50) are above the price. However, the Stoch RSI bullish cross is telling us that momentum is to the upside, and the J line of KDJ at 73.64 also indicates that market pressure is to the upside. Do you think a bounce will happen, or will the price keep falling?
5
2
69
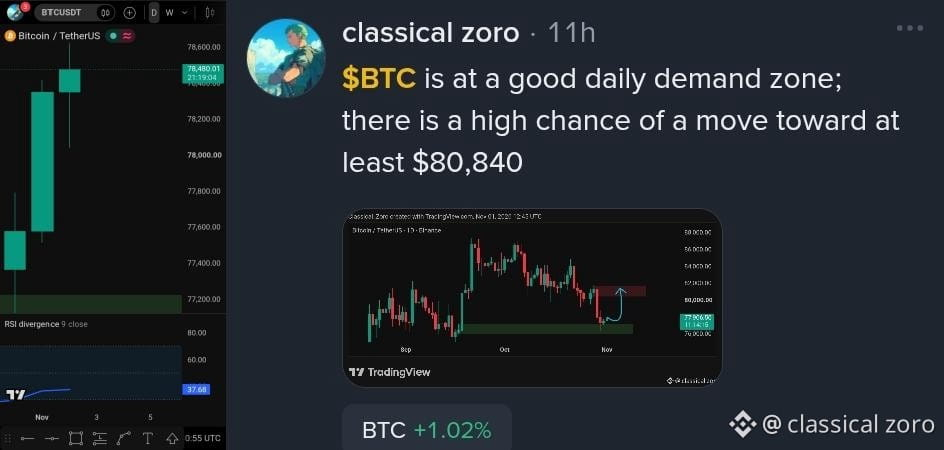
$BTC has another strong bullish daily candle close from the demand zone, which increases the probability that my analysis is correct $BTC
#BinancePick #EarningsSeason
$BTC has another strong bullish daily candle close from the demand zone, which increases the probability that my analysis is correct $BTC
#BinancePick #EarningsSeason
#BinancePick #EarningsSeason

Best Wishes!
From classical zoro
3
43
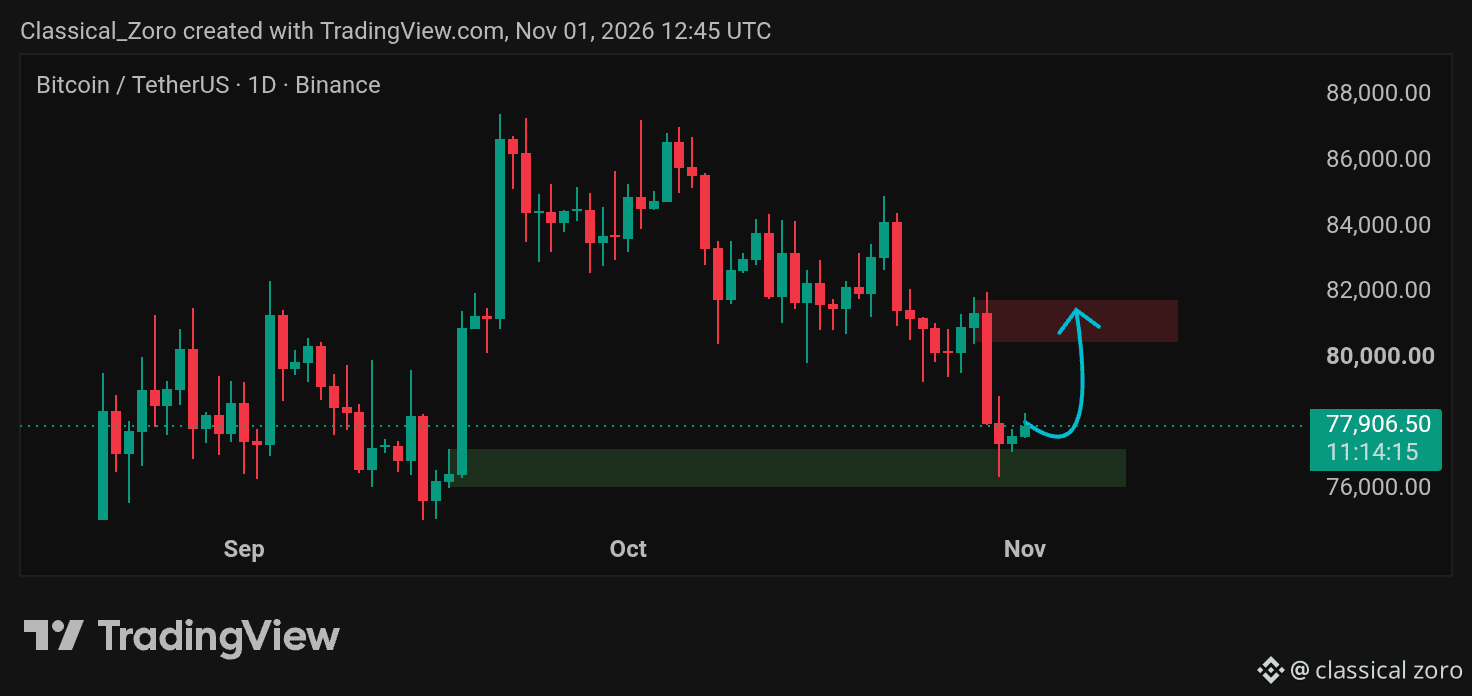
$BTC is at a good daily demand zone; there is a high chance of a move toward at least $80,840
$BTC is at a good daily demand zone; there is a high chance of a move toward at least $80,840
2
107
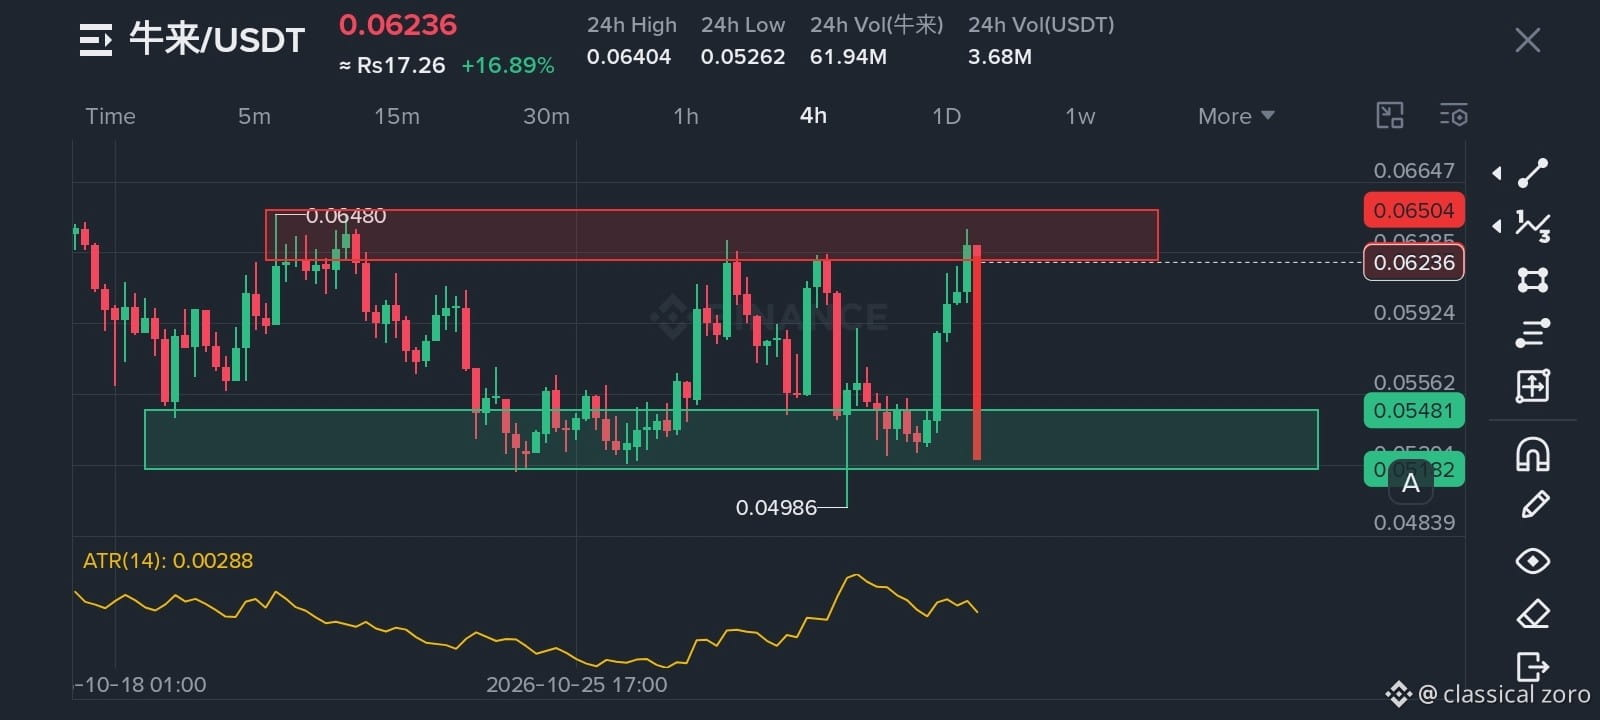
Be alert with your buying position because $牛来 is at the supply zone and is consolidating between the demand zone and the supply zone, so it may move next from this supply zone toward the demand zone.
{spot}(牛来USDT)
Be alert with your buying position because $牛来 is at the supply zone and is consolidating between the demand zone and the supply zone, so it may move next from this supply zone toward the demand zone.
1
108
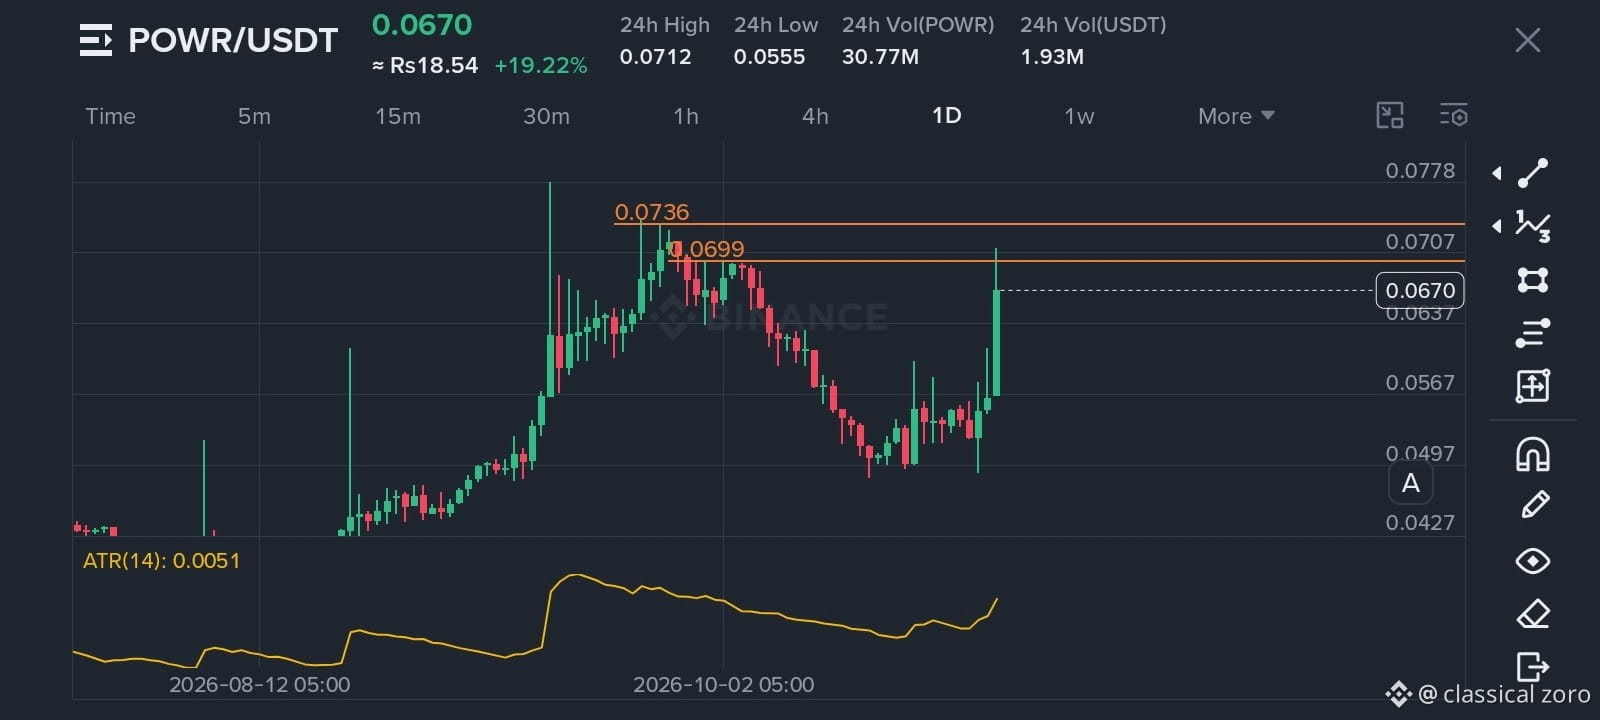
Now, from here, I think we'll see a bearish reaction at $POWER .
Now, from here, I think we'll see a bearish reaction at $POWER .
1
126
Binance Pick is great because you don’t have to spend any money. Just claim your daily rewards for free and use your score in the Prediction option to earn even more points. If you make it onto the leaderboard, you’ll also get a share of the one-million-dollar prize. So what are you waiting for? Go now and claim today’s rewards!
#BinancePick $MSFTB $AMZNB $GOOGLB #EarningsSeason
Binance Pick is great because you don’t have to spend any money. Just claim your daily rewards for free and use your score in the Prediction option to earn even more points. If you make it onto the leaderboard, you’ll also get a share of the one-million-dollar prize. So what are you waiting for? Go now and claim today’s rewards!
#BinancePick $MSFTB $AMZNB $GOOGLB #EarningsSeason
#BinancePick $MSFTB $AMZNB $GOOGLB #EarningsSeason
1
9
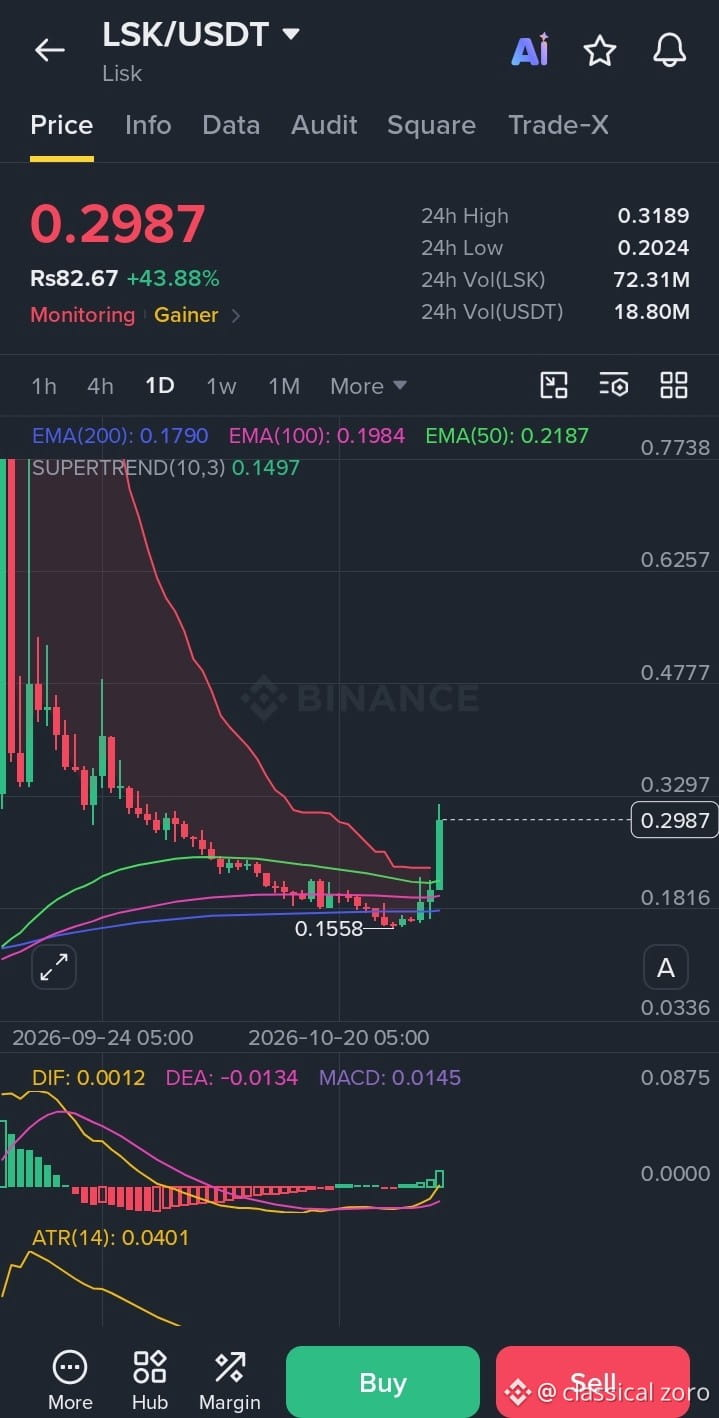
$LSK has moved up after getting good support from EMS, and MACD is also showing a bullish crossover. But the question now is: how much higher will it go? Can you tell?
{spot}(LSKUSDT)
$LSK has moved up after getting good support from EMS, and MACD is also showing a bullish crossover. But the question now is: how much higher will it go? Can you tell?
1
89
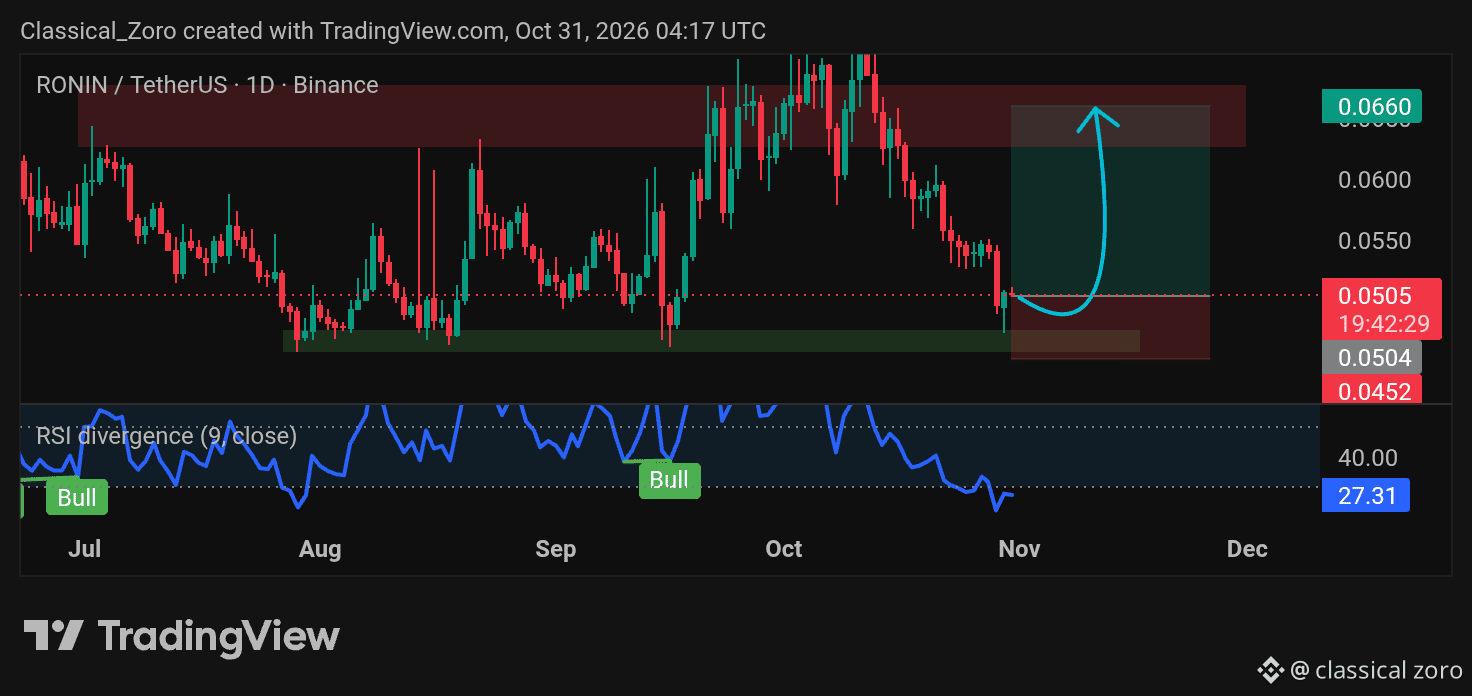
🚨 Sellers just got trapped in $RONIN . 🩸
Retail is panic selling the bottom, and smart money is happily taking their bags.
Look closely at the daily chart.
Price tapped the major demand zone, the RSI crashed to a deeply oversold 27.31, and we just got a confirmed bullish candle close.
That’s not a coincidence. That is a textbook liquidity grab. The bounce is officially in motion.
🟢 Upside Target:
The path of least resistance is up. The next major target is the supply zone sitting right up at 0.0660.
🔴 Risk / Invalidation:
If we lose the 0.0452 level, the setup is dead and we go lower. Spot only, no leverage.
Most traders will wait for a green daily candle to buy at 0.0600. The smart ones are clicking buy right here on the confirmation.
Did you catch this bounce, or did you get shaken out by the drop? Let me know below. 👇👀
🚨 Sellers just got trapped in $RONIN . 🩸
Retail is panic selling the bottom, and smart money is happily taking their bags.
Look closely at the daily chart.
Price tapped the major demand zone, the RSI crashed to a deeply oversold 27.31, and we just got a confirmed bullish candle close.
That’s not a coincidence. That is a textbook liquidity grab. The bounce is officially in motion.
🟢 Upside Target:
The path of least resistance is up. The next major target is the supply zone sitting right up at 0.0660.
🔴 Risk / Invalidation:
If we lose the 0.0452 level, the setup is dead and we go lower. Spot only, no leverage.
Most traders will wait for a green daily candle to buy at 0.0600. The smart ones are clicking buy right here on the confirmation.
Did you catch this bounce, or did you get shaken out by the drop? Let me know below. 👇👀
Retail is panic selling the bottom, and smart money is happily taking their bags.
Look closely at the daily chart.
Price tapped the major demand zone, the RSI crashed to a deeply oversold 27.31, and we just got a confirmed bullish candle close.
That’s not a coincidence. That is a textbook liquidity grab. The bounce is officially in motion.
🟢 Upside Target:
The path of least resistance is up. The next major target is the supply zone sitting right up at 0.0660.
🔴 Risk / Invalidation:
If we lose the 0.0452 level, the setup is dead and we go lower. Spot only, no leverage.
Most traders will wait for a green daily candle to buy at 0.0600. The smart ones are clicking buy right here on the confirmation.
Did you catch this bounce, or did you get shaken out by the drop? Let me know below. 👇👀
3
147
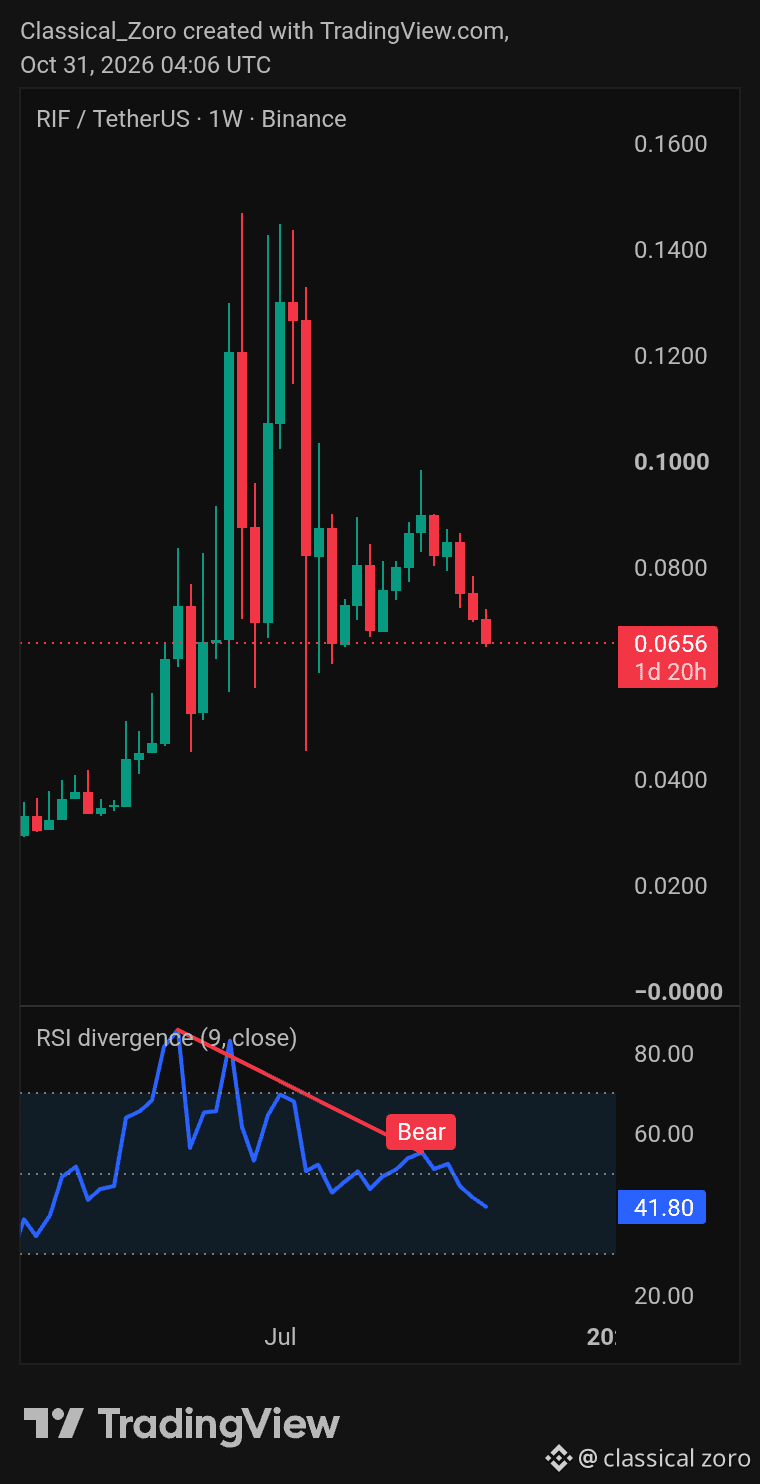
🚨 Retail is about to get absolutely destroyed trying to catch this falling knife in $RIF . 🩸
Look at the weekly chart. Everyone is buying this dip, thinking it’s a massive discount. But they are completely blind to what the RSI is screaming at them.
Look at that massive Bearish Divergence. As the price was pushing up, the momentum (RSI) was making lower highs. The smart money has been quietly distributing their bags this entire time.
The weekly timeframe doesn't lie. Momentum is dying.
Price is currently hovering at 0.0656, but this isn't a support floor—it's a trapdoor. If the RSI continues to break down, it’s a straight flush down to the next major structural support around 0.0400.
🟢 The Play:
Do not catch this falling knife. Wait for the price to actually reach the 0.0400 zone and print a confirmed reversal candle before even thinking about a long.
🔴 The Trap:
If you buy now because it "looks cheap," you are providing exit liquidity for the whales.
Are you buying this weekly dip, or are you waiting for the real bottom? Let me know below. 👇👀
🚨 Retail is about to get absolutely destroyed trying to catch this falling knife in $RIF . 🩸
Look at the weekly chart. Everyone is buying this dip, thinking it’s a massive discount. But they are completely blind to what the RSI is screaming at them.
Look at that massive Bearish Divergence. As the price was pushing up, the momentum (RSI) was making lower highs. The smart money has been quietly distributing their bags this entire time.
The weekly timeframe doesn't lie. Momentum is dying.
Price is currently hovering at 0.0656, but this isn't a support floor—it's a trapdoor. If the RSI continues to break down, it’s a straight flush down to the next major structural support around 0.0400.
🟢 The Play:
Do not catch this falling knife. Wait for the price to actually reach the 0.0400 zone and print a confirmed reversal candle before even thinking about a long.
🔴 The Trap:
If you buy now because it "looks cheap," you are providing exit liquidity for the whales.
Are you buying this weekly dip, or are you waiting for the real bottom? Let me know below. 👇👀
Look at the weekly chart. Everyone is buying this dip, thinking it’s a massive discount. But they are completely blind to what the RSI is screaming at them.
Look at that massive Bearish Divergence. As the price was pushing up, the momentum (RSI) was making lower highs. The smart money has been quietly distributing their bags this entire time.
The weekly timeframe doesn't lie. Momentum is dying.
Price is currently hovering at 0.0656, but this isn't a support floor—it's a trapdoor. If the RSI continues to break down, it’s a straight flush down to the next major structural support around 0.0400.
🟢 The Play:
Do not catch this falling knife. Wait for the price to actually reach the 0.0400 zone and print a confirmed reversal candle before even thinking about a long.
🔴 The Trap:
If you buy now because it "looks cheap," you are providing exit liquidity for the whales.
Are you buying this weekly dip, or are you waiting for the real bottom? Let me know below. 👇👀
2
2
354
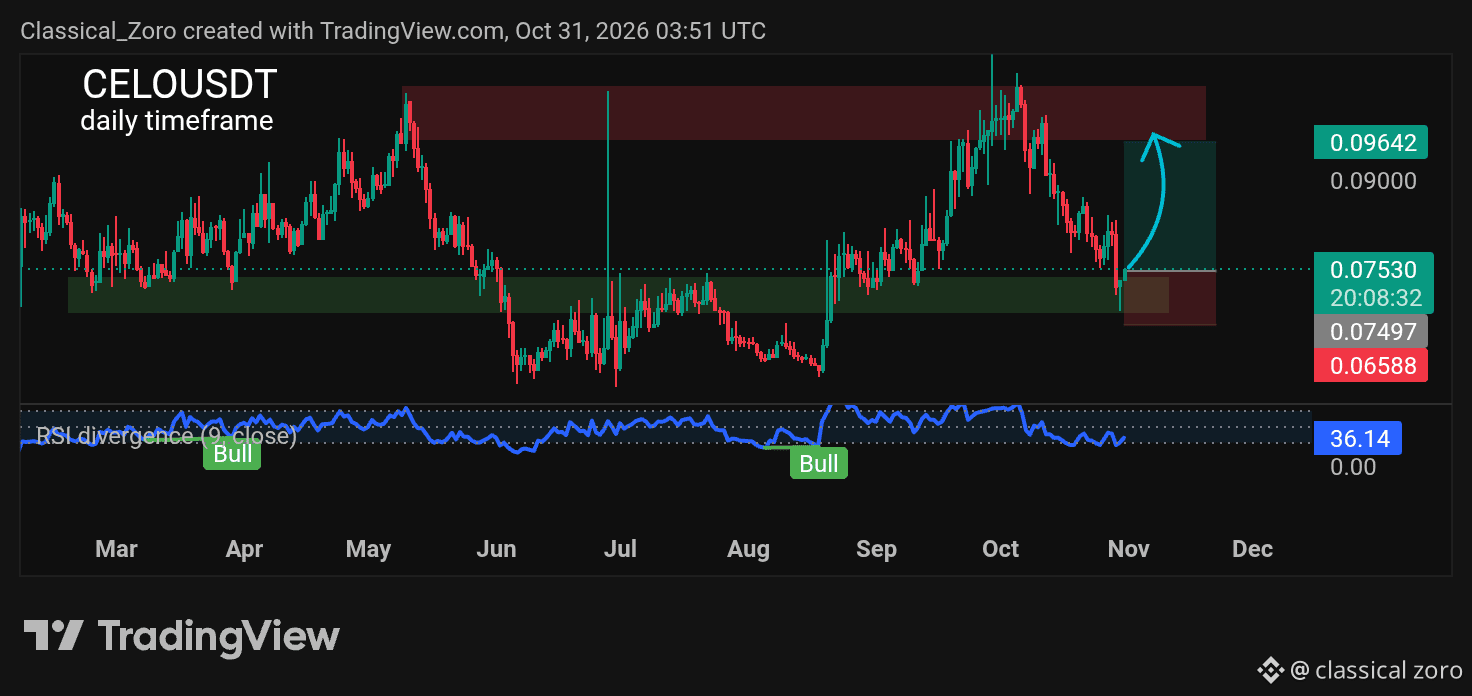
🤫 Nobody is talking about what $CELO is doing right now.
While the rest of the market is bleeding, the daily chart is printing an absolute textbook setup that most traders are completely missing.
The price has tapped the major demand zone at 0.06769-0.074, and the reaction is already confirmed with a solid bullish candle close.
Look at the RSI. It’s sitting deep in oversold territory at 36.14. Sellers are completely out of gas.
This is a textbook spring-loading phase before the next leg up.
If this demand zone holds, we are looking at a massive rally straight back up to the 0.09642 supply zone.
❌ But if we lose the 0.06588 level, the structure is dead.
Most traders will wait and chase the pump at 0.09. The smart ones are clicking the buy button right here on this confirmed bounce.
Who is taking this spot trade with me? 👇
{spot}(CELOUSDT)
🤫 Nobody is talking about what $CELO is doing right now.
While the rest of the market is bleeding, the daily chart is printing an absolute textbook setup that most traders are completely missing.
The price has tapped the major demand zone at 0.06769-0.074, and the reaction is already confirmed with a solid bullish candle close.
Look at the RSI. It’s sitting deep in oversold territory at 36.14. Sellers are completely out of gas.
This is a textbook spring-loading phase before the next leg up.
If this demand zone holds, we are looking at a massive rally straight back up to the 0.09642 supply zone.
❌ But if we lose the 0.06588 level, the structure is dead.
Most traders will wait and chase the pump at 0.09. The smart ones are clicking the buy button right here on this confirmed bounce.
Who is taking this spot trade with me? 👇
While the rest of the market is bleeding, the daily chart is printing an absolute textbook setup that most traders are completely missing.
The price has tapped the major demand zone at 0.06769-0.074, and the reaction is already confirmed with a solid bullish candle close.
Look at the RSI. It’s sitting deep in oversold territory at 36.14. Sellers are completely out of gas.
This is a textbook spring-loading phase before the next leg up.
If this demand zone holds, we are looking at a massive rally straight back up to the 0.09642 supply zone.
❌ But if we lose the 0.06588 level, the structure is dead.
Most traders will wait and chase the pump at 0.09. The smart ones are clicking the buy button right here on this confirmed bounce.
Who is taking this spot trade with me? 👇
Best Wishes!
From classical zoro
2
142
Why Binance Pick is Best?
Binance Pick is the best because it respects your intelligence. It does not treat you like a lottery player; it treats you like a predictor and a trader. With a massive, scalable prize pool, multiple reward streams (Seasonal, Weekly, and Participation), and a system that rewards both trading volume and community engagement, it is the most comprehensive and lucrative campaign Binance has launched in 2026. #BinancePick #EarningsSeason $MSFTB
{spot}(MSFTBUSDT)
Why Binance Pick is Best?
Binance Pick is the best because it respects your intelligence. It does not treat you like a lottery player; it treats you like a predictor and a trader. With a massive, scalable prize pool, multiple reward streams (Seasonal, Weekly, and Participation), and a system that rewards both trading volume and community engagement, it is the most comprehensive and lucrative campaign Binance has launched in 2026. #BinancePick #EarningsSeason $MSFTB
Binance Pick is the best because it respects your intelligence. It does not treat you like a lottery player; it treats you like a predictor and a trader. With a massive, scalable prize pool, multiple reward streams (Seasonal, Weekly, and Participation), and a system that rewards both trading volume and community engagement, it is the most comprehensive and lucrative campaign Binance has launched in 2026. #BinancePick #EarningsSeason $MSFTB
2
105
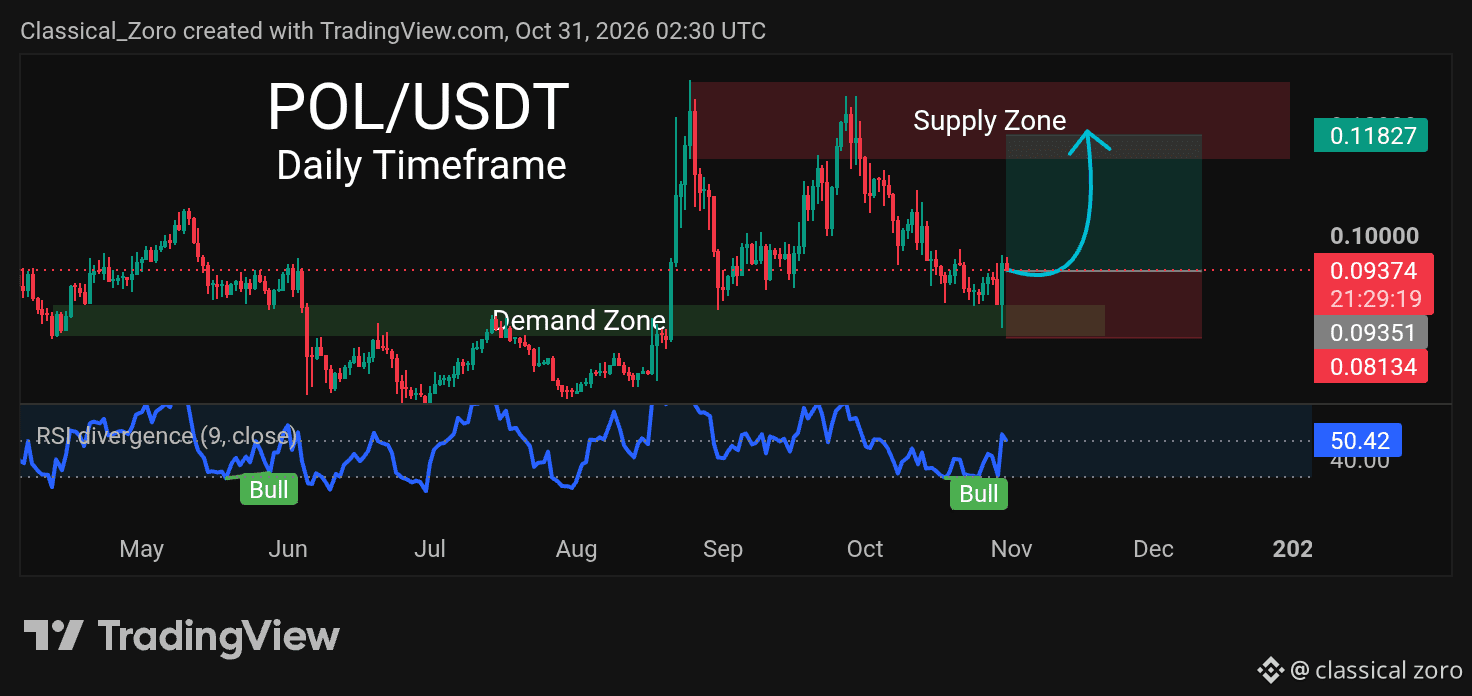
🚨 Retail is about to get trapped in $POL right now. 🩸
Take a look at the daily chart. Price just got brutally rejected from the top supply zone, and everyone is panic selling.
But look closer. We have tapped the daily demand zone perfectly.
Notice the RSI? It just printed a hidden bullish divergence and is curling back up past 50. Sellers are completely exhausted.
This is exactly how smart money operates. They let retail panic sell the bottom so they can scoop up the liquidity at a discount.
🟢 The Play:
If bulls defend this floor, the bounce will be violent. The next target is a straight shot back up to the 0.11827 supply zone.
🔴 The Reality:
If we lose the bottom of this green box, it’s a straight slide down to 0.08134.
{spot}(POLUSDT)
🚨 Retail is about to get trapped in $POL right now. 🩸
Take a look at the daily chart. Price just got brutally rejected from the top supply zone, and everyone is panic selling.
But look closer. We have tapped the daily demand zone perfectly.
Notice the RSI? It just printed a hidden bullish divergence and is curling back up past 50. Sellers are completely exhausted.
This is exactly how smart money operates. They let retail panic sell the bottom so they can scoop up the liquidity at a discount.
🟢 The Play:
If bulls defend this floor, the bounce will be violent. The next target is a straight shot back up to the 0.11827 supply zone.
🔴 The Reality:
If we lose the bottom of this green box, it’s a straight slide down to 0.08134.
Take a look at the daily chart. Price just got brutally rejected from the top supply zone, and everyone is panic selling.
But look closer. We have tapped the daily demand zone perfectly.
Notice the RSI? It just printed a hidden bullish divergence and is curling back up past 50. Sellers are completely exhausted.
This is exactly how smart money operates. They let retail panic sell the bottom so they can scoop up the liquidity at a discount.
🟢 The Play:
If bulls defend this floor, the bounce will be violent. The next target is a straight shot back up to the 0.11827 supply zone.
🔴 The Reality:
If we lose the bottom of this green box, it’s a straight slide down to 0.08134.
Best Wishes!
From classical zoro
2
70
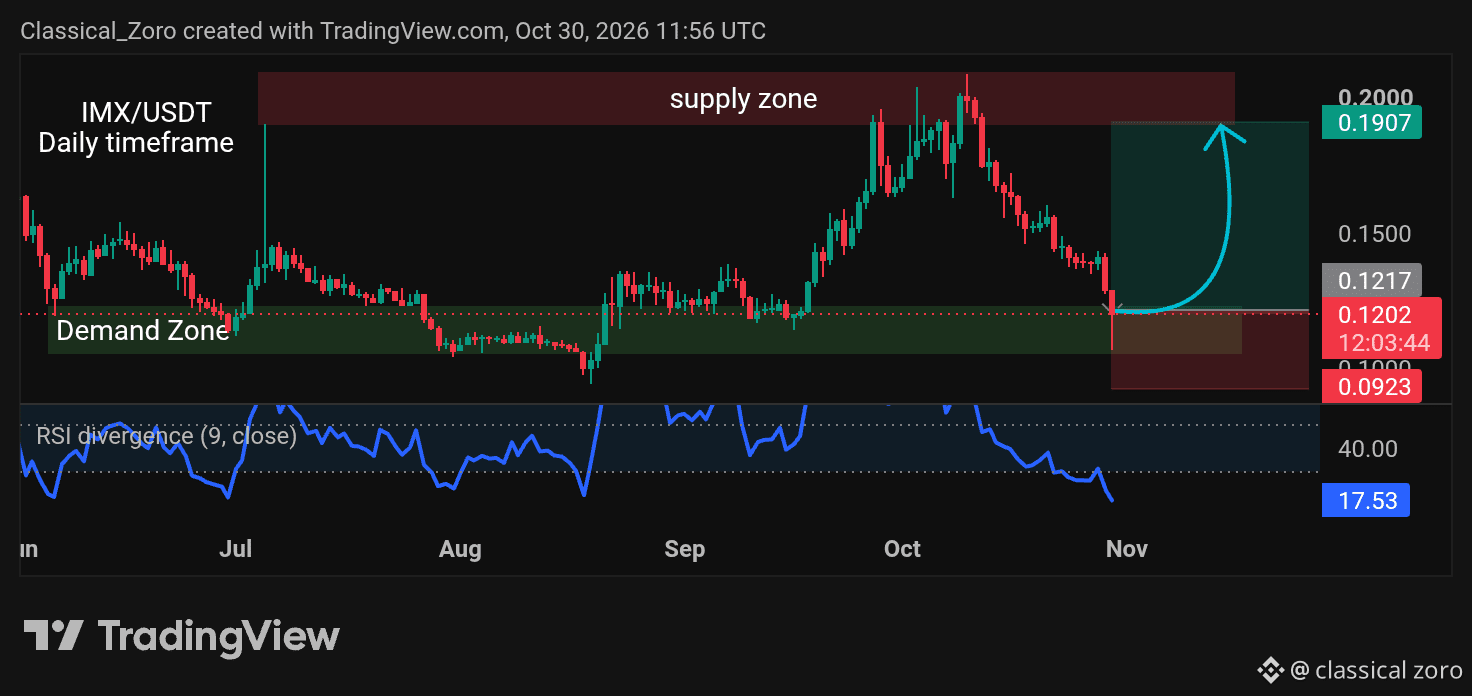
$IMX bulls are catching their breath right at a critical daily demand zone.
After a massive rejection from the 0.2000 supply zone, the price has taken a heavy hit. But instead of collapsing, it has dropped directly into a major demand block.
Currently hovering right at 0.1202, the price is tapping a level that has previously acted as a launchpad to stop sellers and fuel rallies.
Zooming into the momentum, the RSI has crashed all the way down to 17.53. This is deeply oversold territory, signaling that the selling pressure is completely exhausted.
If buyers step in here to defend this floor and spark a relief rally, the next major target is a push right back up to the 0.1907 supply zone.
Lose the bottom of this demand zone, though, and the bullish thesis is invalidated, opening the door for a deeper slide toward the 0.0923 level.
The downside momentum is stretched to the limit. Bulls have a prime setup for a bounce, but they need to prove it with a strong daily close right now.
{spot}(IMXUSDT)
#IMX/USDT
#SpotTrader
#SPOTCALL🔥🔥🔥
#SpotTradingSuccess
#ClassicalZoro
$IMX bulls are catching their breath right at a critical daily demand zone.
After a massive rejection from the 0.2000 supply zone, the price has taken a heavy hit. But instead of collapsing, it has dropped directly into a major demand block.
Currently hovering right at 0.1202, the price is tapping a level that has previously acted as a launchpad to stop sellers and fuel rallies.
Zooming into the momentum, the RSI has crashed all the way down to 17.53. This is deeply oversold territory, signaling that the selling pressure is completely exhausted.
If buyers step in here to defend this floor and spark a relief rally, the next major target is a push right back up to the 0.1907 supply zone.
Lose the bottom of this demand zone, though, and the bullish thesis is invalidated, opening the door for a deeper slide toward the 0.0923 level.
The downside momentum is stretched to the limit. Bulls have a prime setup for a bounce, but they need to prove it with a strong daily close right now.
#IMX/USDT
#SpotTrader
#SPOTCALL🔥🔥🔥
#SpotTradingSuccess
#ClassicalZoro
After a massive rejection from the 0.2000 supply zone, the price has taken a heavy hit. But instead of collapsing, it has dropped directly into a major demand block.
Currently hovering right at 0.1202, the price is tapping a level that has previously acted as a launchpad to stop sellers and fuel rallies.
Zooming into the momentum, the RSI has crashed all the way down to 17.53. This is deeply oversold territory, signaling that the selling pressure is completely exhausted.
If buyers step in here to defend this floor and spark a relief rally, the next major target is a push right back up to the 0.1907 supply zone.
Lose the bottom of this demand zone, though, and the bullish thesis is invalidated, opening the door for a deeper slide toward the 0.0923 level.
The downside momentum is stretched to the limit. Bulls have a prime setup for a bounce, but they need to prove it with a strong daily close right now.
#IMX/USDT
#SpotTrader
#SPOTCALL🔥🔥🔥
#SpotTradingSuccess
#ClassicalZoro
Best Wishes!
From classical zoro
3
85
Log in to explore more content
Join global crypto users on Binance Square
⚡️ Get latest and useful information about crypto.
💬 Trusted by the world’s largest crypto exchange.
👍 Discover real insights from verified creators.
Email / Phone number
Trending Topics
BinanceReopensWithdrawalsForMoreAssets
588,855 views
2,750 Discussing
Security Incident | Recovery Update #8: Withdrawals for More Assets to Reopen (2026-11-05)
Binance Announcement
·95 Likes
·253k views
BTCRebounds80K
110,864 views
1,088 Discussing
Binance98PercentReplenished
60,276 views
784 Discussing