🎯 Quick summary
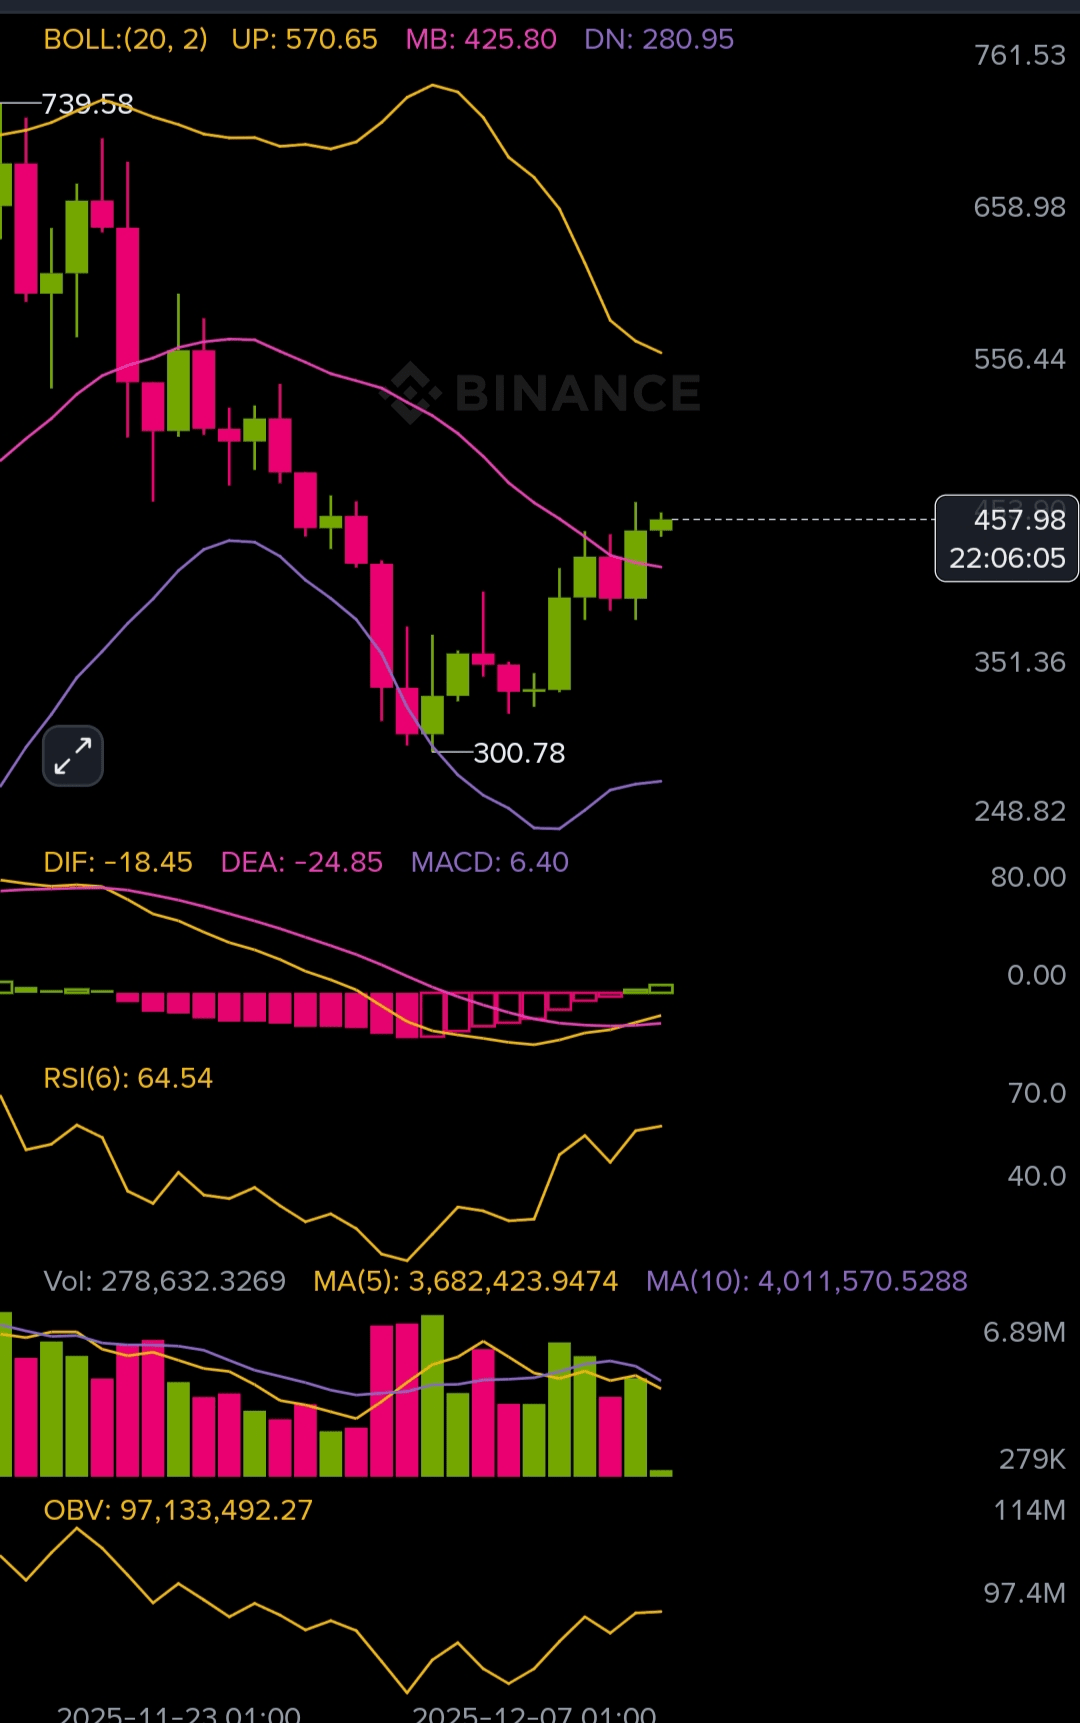
The pair seems to be in a strong upward rebound phase after hitting a low of 300.78, but it has now reached a dangerous resistance area that you need to monitor closely before entering.
---
📈 1 — The general trend
The general trend is still bearish, but there is a strong corrective rebound.
The price is up 16%, and this is likely a correction within a bearish trend.
---
📍 2 — The most important areas you need to monitor now
🔥 Current resistance area: 460 – 470
The candle is currently standing right below strong resistance.
Any rejection here ⇒ Likelihood of a drop.
Any breakout with a daily close above 470 ⇒ It will continue to rise.
🟢 Nearby support area: 420 – 430
If the price drops to it and doesn't break it ⇒ Another bounce opportunity.
---
📊 3 — Indicators
MACD returned positive (MACD above 0) ⇒ Upward momentum but still weak.
The convergence of DIF and DEA shows it is making a bullish Cross ⇒ Good signal.
RSI
RSI = 64 close to the overbought area, meaning:
Perfect time to enter Long now.
A small correction may happen before continuing to rise.
OBV + Volume
Volume is rising well => Buyer entry
But not a big explosion => still threatened by a decline.
---
🧭 4 — Will it continue to rise or not?
✔ It continues to rise if:
Break 470 with a clear close
Strong trading volume
RSI does not rise above 75
✘ It will drop if:
Made a rejection candle at 460 – 470
RSI started to drop
MACD returned below zero
---
🟢 Best decision now
Don't enter Long here
The price is above direct resistance, entering here is risky.
🎯 Best entry:
Buy above 470 with today's candle close
Or
Buy from 420 – 430 if it corrects and goes back up