
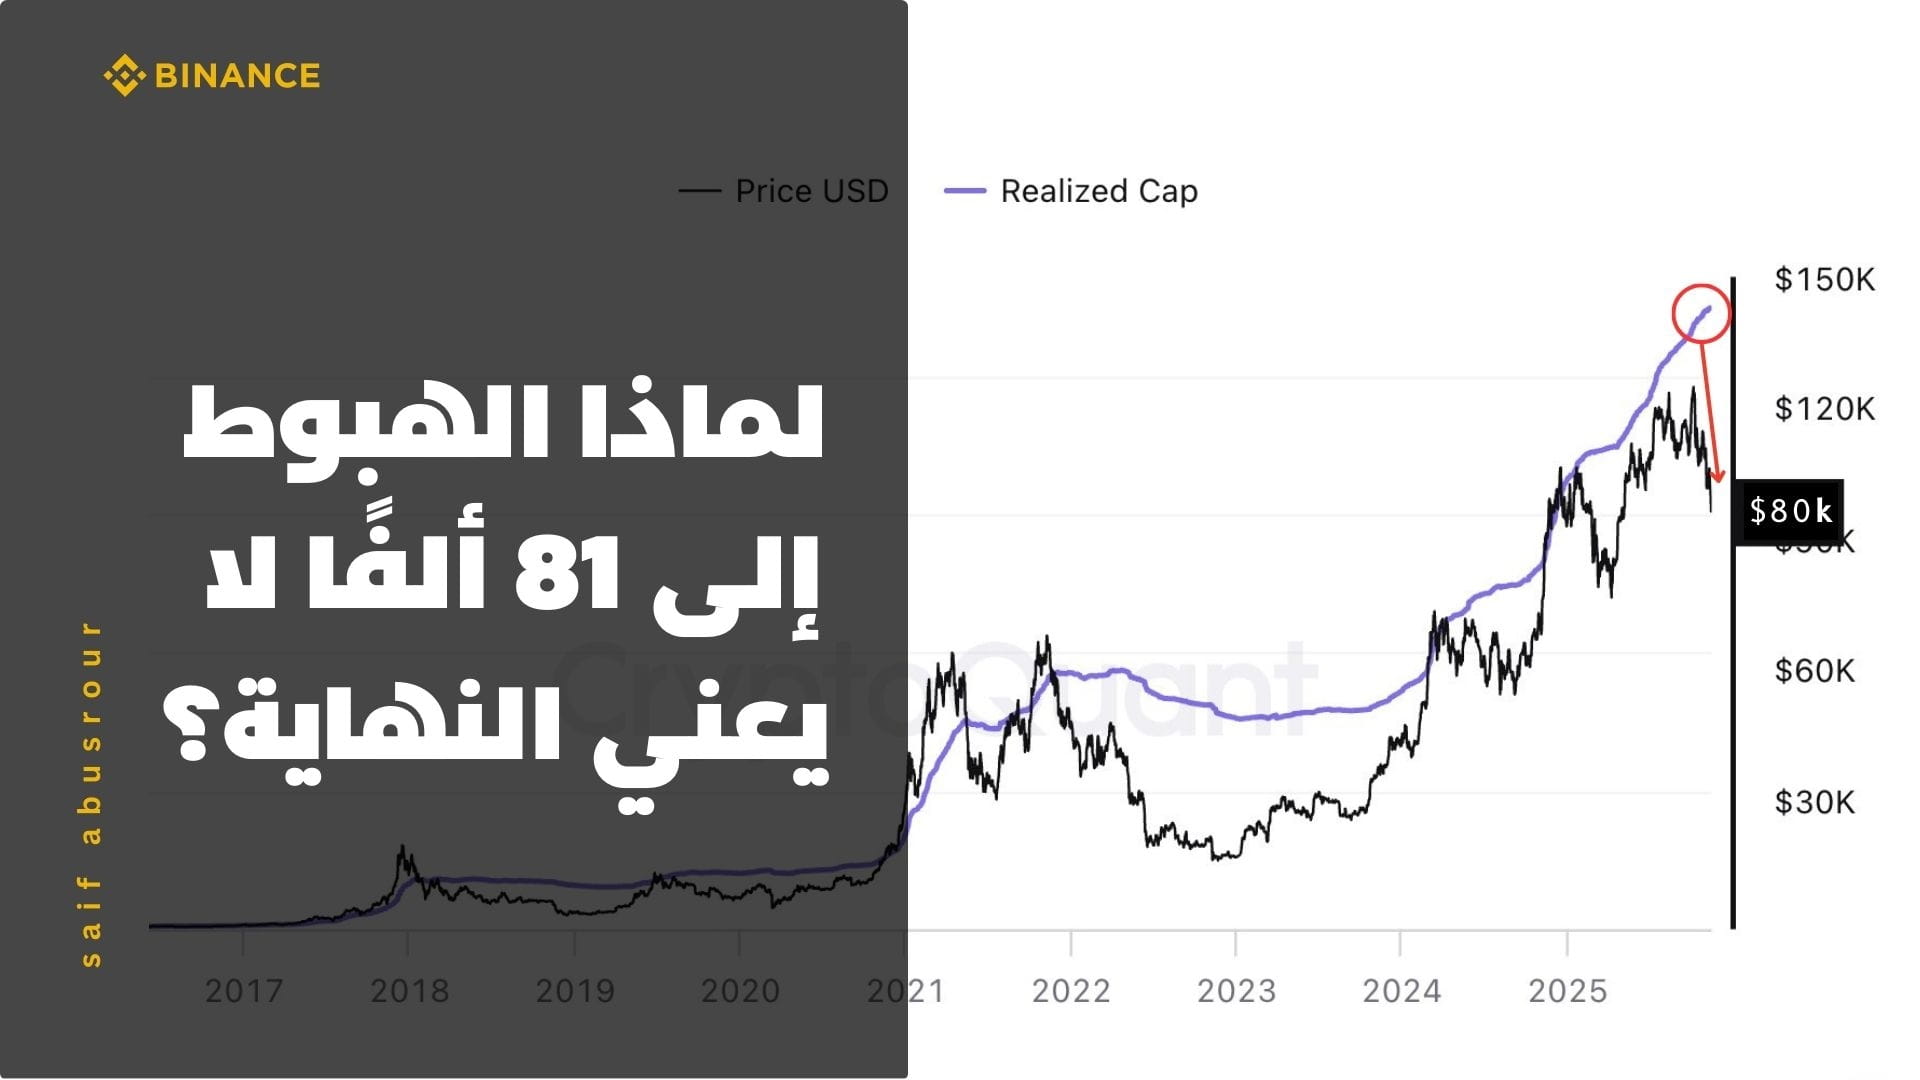
Bitcoin price today is around 82 thousand dollars after a sharp drop from a peak close to 126 thousand in October 2025, which is a correction of about 35% from the peak. This drop has led many to announce the end of the 2025 cycle and the birth of a new winter, but the chart before you – the black price line and the purple value line that rises to the area of 150 thousand on the chart scale – tells a completely different story: a cycle that is still alive, breathing with painful correction, but not closed yet.
The core idea in this chart is that the purple line does not represent the instantaneous price, but rather the 'accumulated market cost'. Every Bitcoin that moves on the chain has the last price someone paid for it; when we sum these costs for all coins, we obtain what is called the Realized Cap. Visually in the chart, you see that this line continues to rise almost uninterruptedly, even as it passes above the 150 thousand area on the chart scale, while the price line itself breaks upward then drops to 82 thousand. This difference between price movement and realized value movement is key: price reflects the mood of the moment, while realized value reflects where real capital is centered, and which layer of investors is taking the baton at this stage of the cycle.
If the 2025 cycle had fully ended, it would be natural to see the purple value line slow down and flatten and perhaps even tilt downwards, as new money stops entering, and realized losses on-chain become greater than the capital being pumped in by new hands. This was clearly the case at the end of 2017 and then in 2021; the price crashed and with it, the realized value entered a long 'flat' phase. In the current chart, the opposite is happening: despite the drop from 126 to 82 thousand, the value curve is still in a strong upward trend, as if it is raising the overall cost floor of the market to a new level. This means that the current correction is more like a redistribution of Bitcoin from weak hands to stronger hands, not a collective exit of capital as seen at the end of classical cycles.
The on-chain data layer supports this reading. A large portion of the supply is currently in illiquid wallets; on-chain reports show that over 70% of Bitcoin is held by entities that rarely sell, meaning most of the supply is 'held' outside exchanges and does not chase short candles. In contrast, we see a notable wave of selling from some long-term holders who took profits after new peaks, as recent data indicates the sale of hundreds of thousands of Bitcoin over a few weeks by this category. But the important thing is not the existence of selling itself, but who stands on the opposite side buying this amount; the continued rise of the value curve indicates that a new base of owners is entering and paying higher costs, which raises the average market cost instead of lowering it.
In terms of timing, we are in a cycle related to the halving in April 2024, which is the fourth halving in the network's history. In previous halvings, major peaks usually appeared about 13 to 18 months after the halving, and with the peak of 126 thousand in October 2025, we actually find ourselves in the same timeframe almost. But this cycle is radically different from previous cycles in one element: spot ETF funds. For the first time, structured institutional demand is entering through traditional exchanges, with cumulative inflows estimated in the tens of billions of dollars and assets under management in these funds approaching about 6-7% of the total market value of Bitcoin. In one peak week, crypto products recorded inflows of about $5.95 billion in a single week coinciding with Bitcoin reaching a new peak; these figures reflect not just the behavior of individual speculators but the behavior of a new layer of institutional money.
This institutional structure changes the shape of the cycle; instead of having a linear 'bubble and crash', the curve transforms into a broader cycle over time: a sharp upward wave fueled by the entry of ETFs and the pre-pricing of the halving, followed by a deep correction wave for the redistribution of positions, but on a floor of realized value that is still rising, not on a collapsed floor. In the background of this scene, the illiquid supply remains high, meaning that much of the supply is in the hands of hodlers building on a longer time horizon than one cycle; these are not too concerned with the move from 126 to 82 thousand, but rather view Bitcoin's shift to a long-term reserve asset in a world increasingly manipulated by traditional monetary policies and government debt opacity.
If you combine the chart with these facts, the picture becomes clearer: the current price at 82 thousand is much lower than the peak of 126 thousand, but it is still above the cumulative cost layer of the market by a reasonable margin, not by a huge bubble difference as seen at the ends of 2017 and 2021. An indicator like MVRV, which measures the price-to-cost ratio, is not today at levels of 4 or 5 that indicate a disconnection from reality, but rather in a range much lower historically, which is usually associated with severe corrections within a bullish trend rather than the end of the trend itself. The current extreme fear in sentiment indicators is the psychological face of this scene: many new participants see the drop as the end of the world, while value and on-chain data suggest that the network is still in a phase of 'structural expansion'.
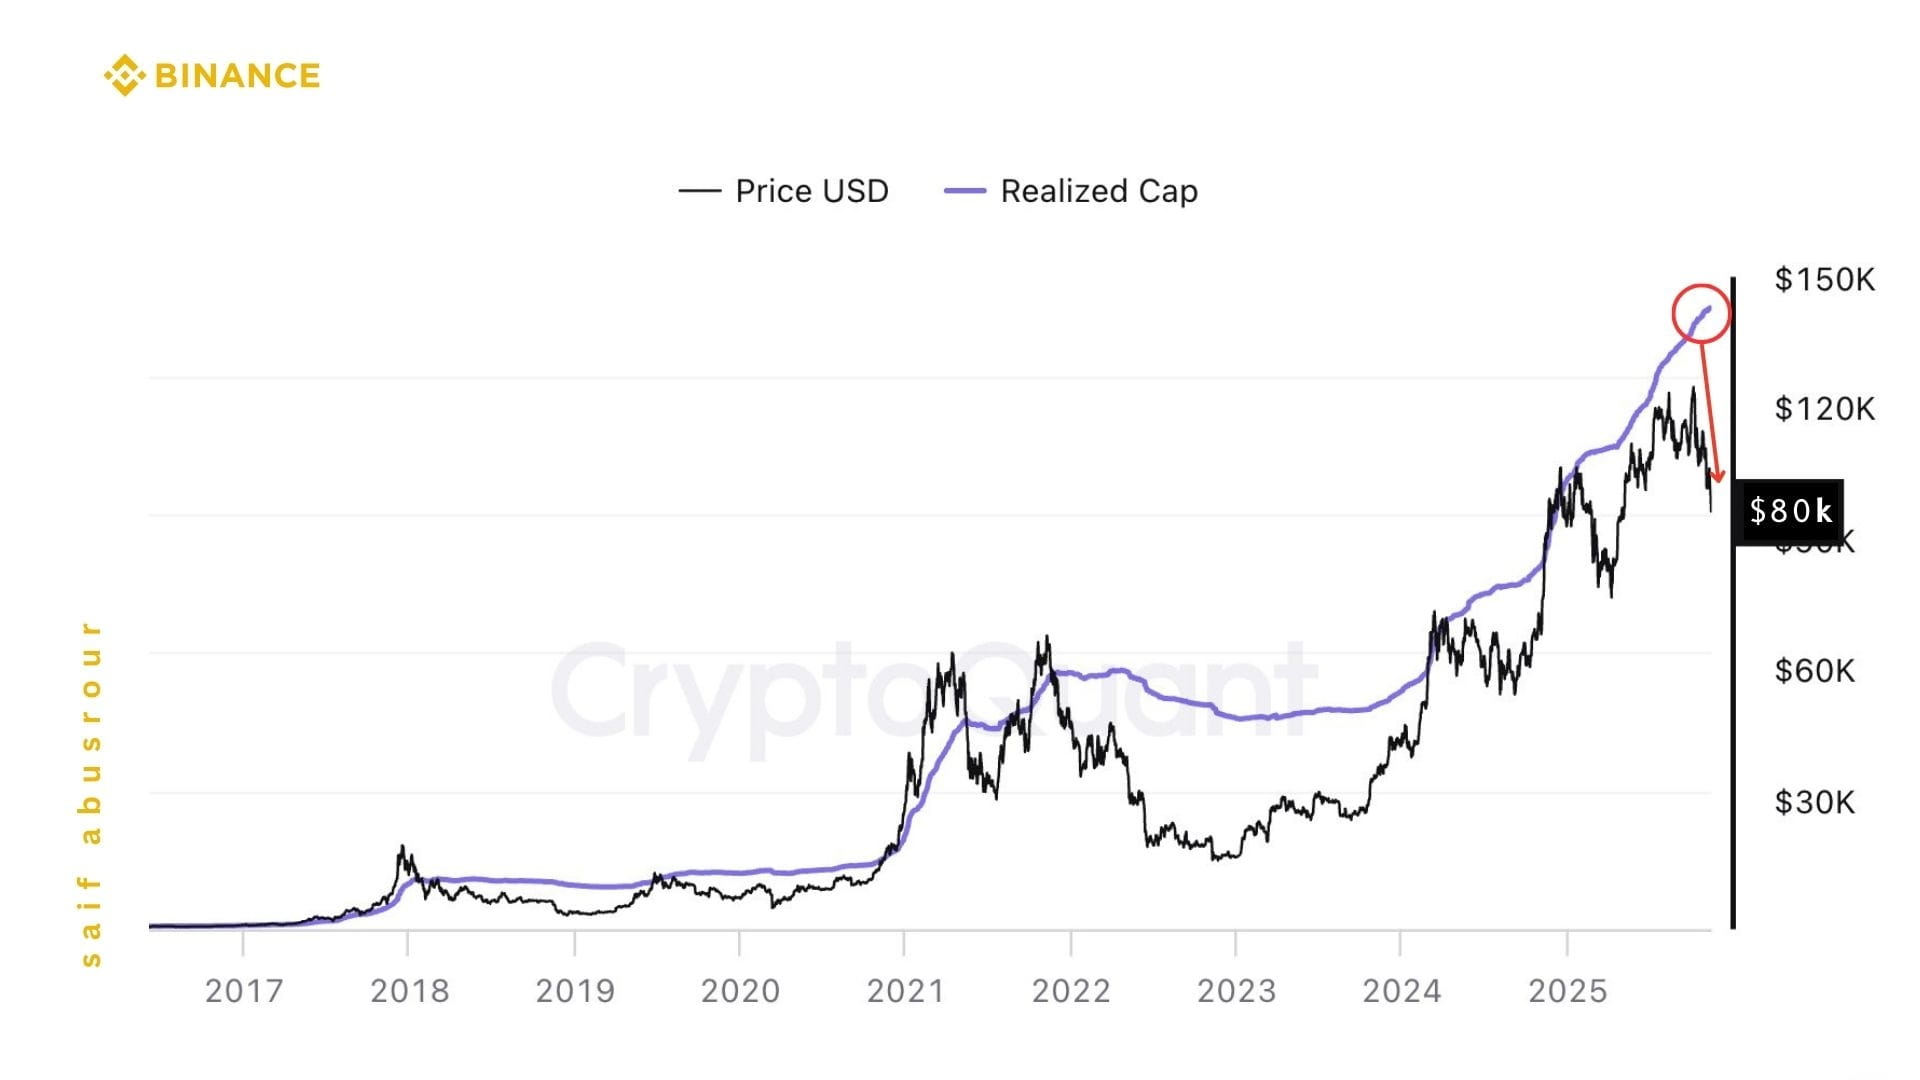
The hidden idea that 99% of traders do not realize here is that the real question is not: 'How much has Bitcoin dropped from the peak?' but rather: 'Has the realized value curve started to contract or is it still expanding?' The percentage drop from the peak can be deceptive; you might see a 30-40% drop in the middle of a bullish cycle, and you might see the same percentage at the beginning of a long winter. The difference is that a true winter comes when net capital starts to exit the network, and the purple value line shifts to a horizontal or downward path; as long as the line in the chart you have continues to rise towards the 150 thousand area on the chart scale while the temporary price is below it at 82 thousand, you are likely facing a harsh chapter of the same cycle, not a completely new film.
#Write2Earn
