
Sunday closes with the kind of action that does not look like the end of a week at all, because instead of the usual low-energy drift you get a market that keeps generating new points of tension.
From oversized shorts opened with maximum leverage and almost zero breathing room to a clean technical setup on the XRP/BTC chart that may recreate the July's 40% surge pattern, all the way to the heaviest long-term holder selling wave since the start of 2024, which now defines the macro picture far more than any intraday swing on Binance or Coinbase.
TL;DR
One trader has opened a $196 million leveraged short basket across BTC/XRP/ZEC.XRP/BTC has recreated July's crossover setup.Long-term holders have unloaded 815,000 BTC in 30 days.$27.4 million XRP short opened
The derivatives board opened the weekend with a position block that immediately stood out, not because the market has not seen large leveraged trades before but because this one was constructed with absolute disregard for volatility. The combination of 40x BTC, 20x XRP and 10x ZEC inside a $196 million block leaves no operational runway — the trader essentially tied their fate to the next candle rather than any midterm time frame.
Even the unrealized profit sitting in green does not provide comfort, because with this degree of leverage, the distance between profit and liquidation is measured in ticks.
card
Simultaneously, the earlier trader who mirrored this aggressive posture is already underwater and has lost a sizable portion of their book via forced liquidation. The timing — less than a full day after opening — shows how fragile leveraged shorts remain in the current environment, whereBitcoin can erase or add several percentage points in minutes and XRP trades in rapid bursts rather than controlled waves.
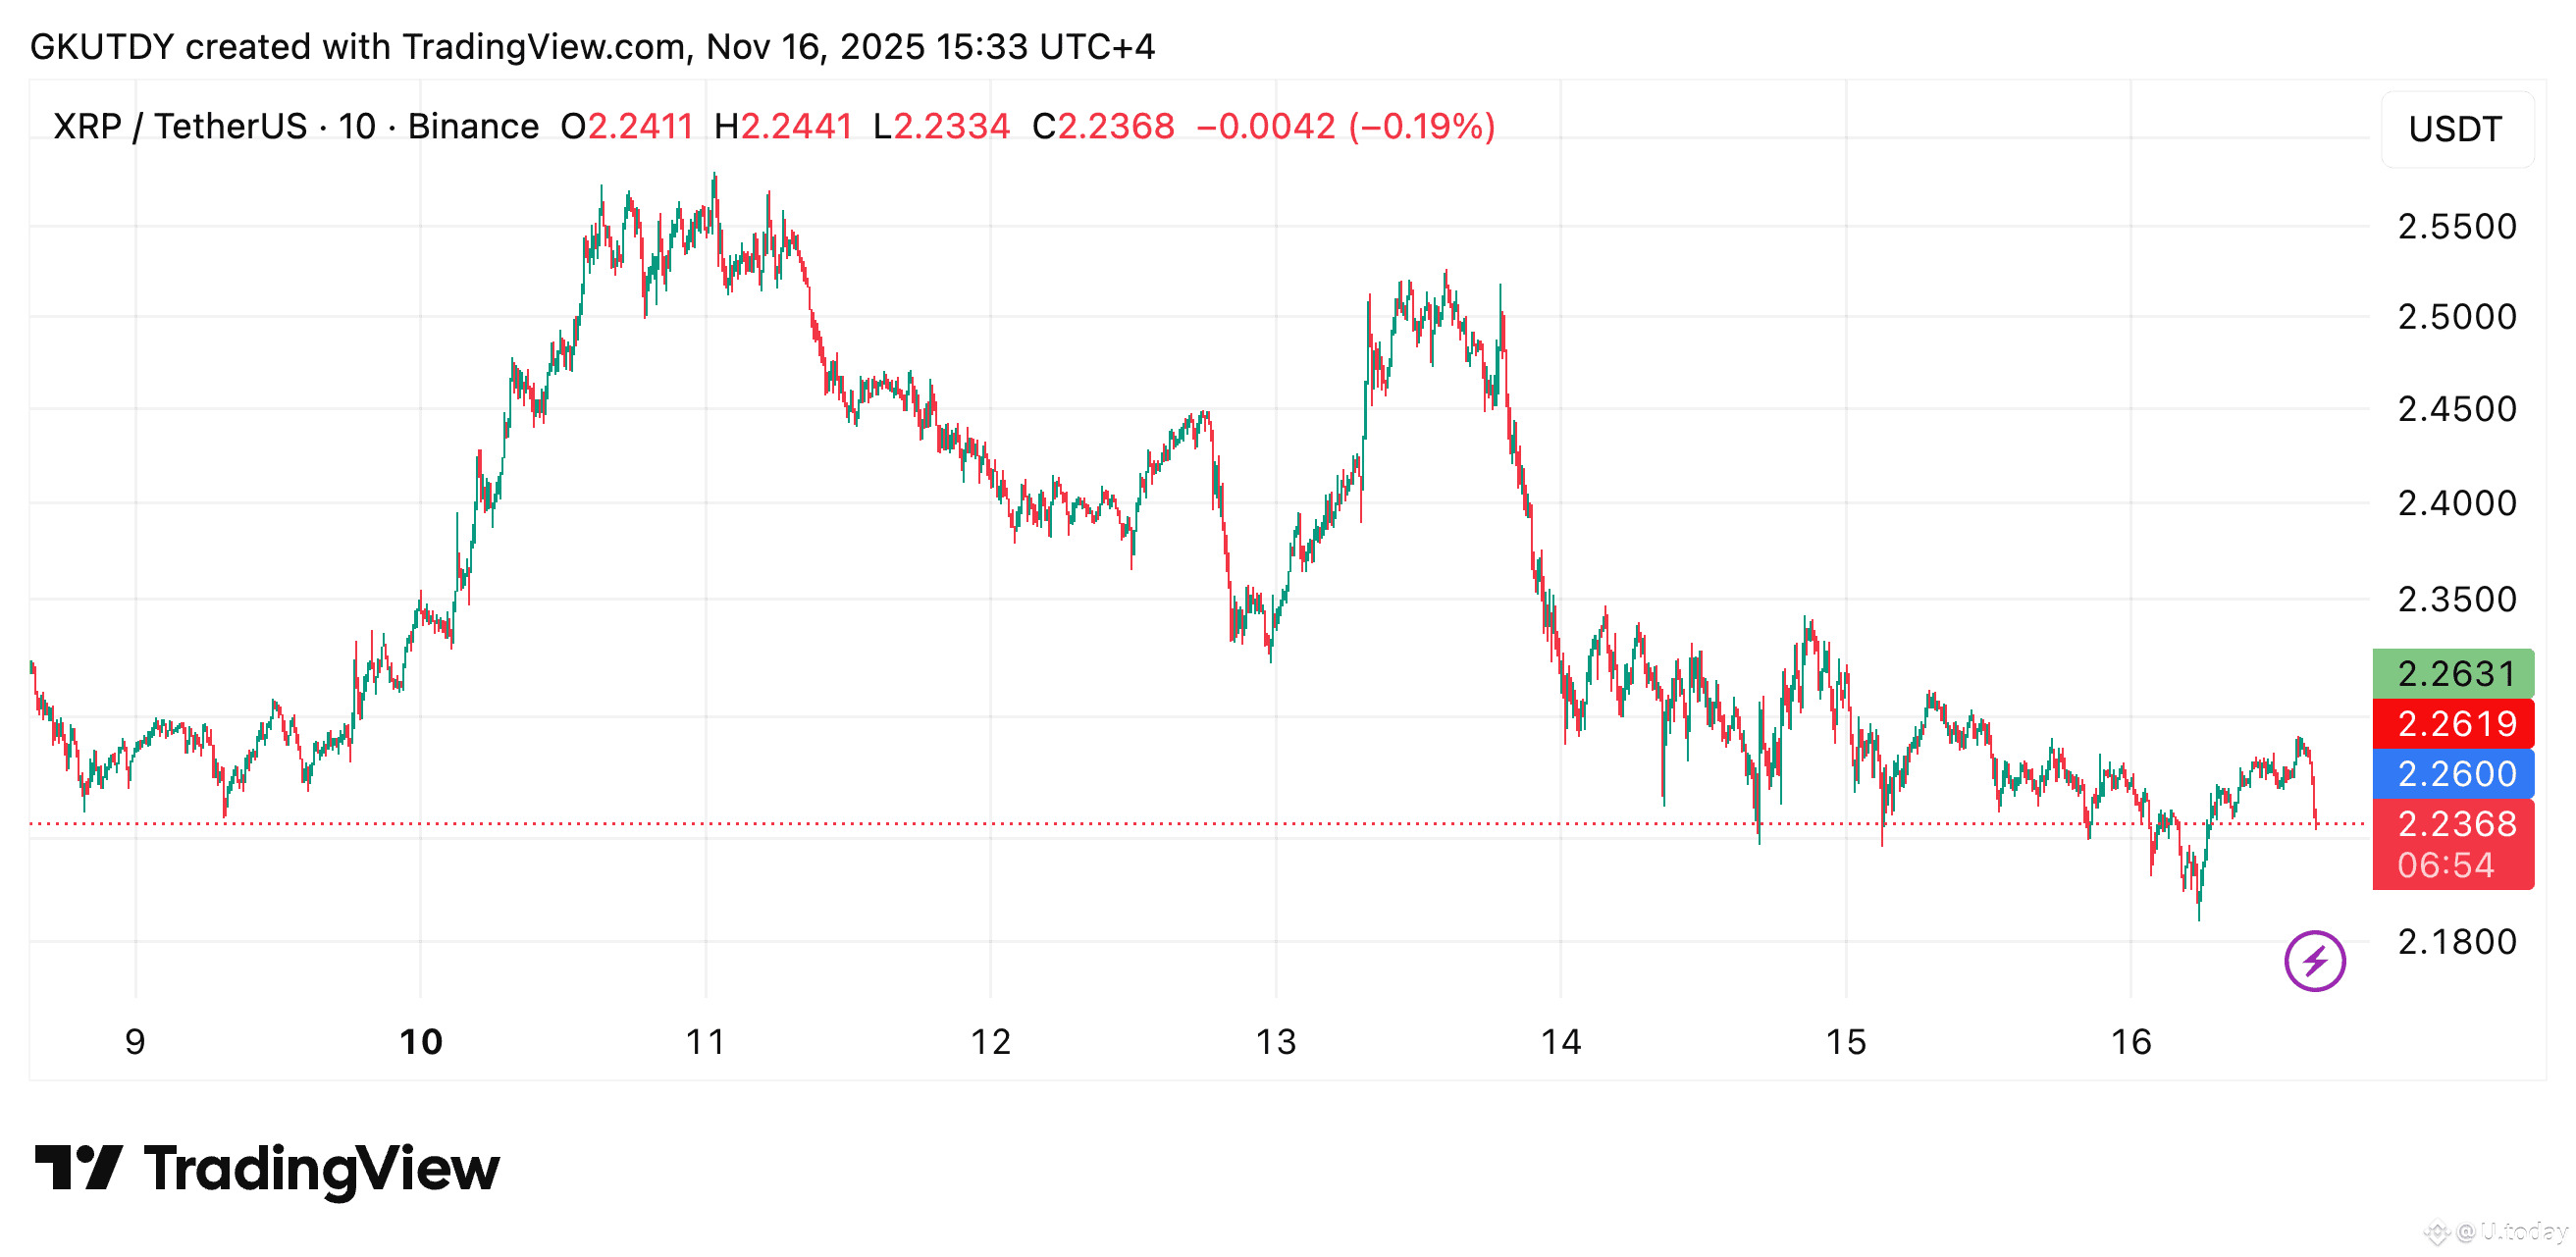
XRP in the meantime has been jumping around a lot recently, hitting $2.34-$2.36, then dropping straight back to $2.20-$2.22 again. There is no orderly pattern to it, so it is not a place where you can just sit back and relax.
XRP readies 40% move against Bitcoin
While the liquidations and oversized shorts dominate the headlines,XRP presents one of the few structured setups in the entire market. The XRP/BTC pair is replicating the same 23-day and 50-day moving average interaction that defined the July rally, when the pair moved from 0.0000218 BTC to 0.00003073 BTC in a straight 12-day stretch, gaining 40.91% without any meaningful interruption.
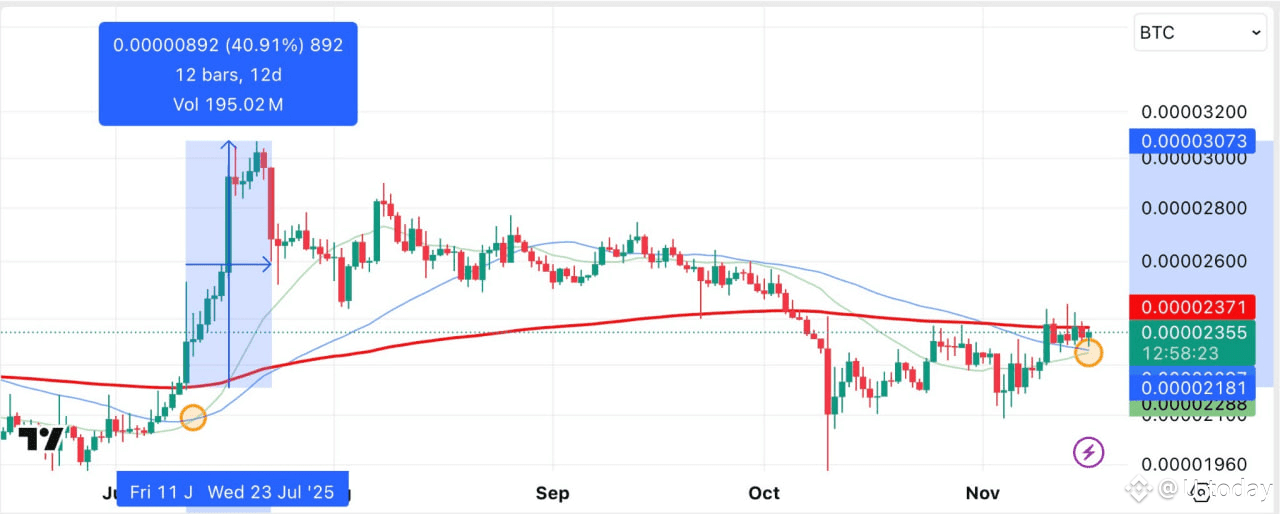
This time the alignment is almost identical: the moving averages compress, the slope matches the summer profile, and the price sits directly on the initiation zone. A full replication of the July move is not guaranteed, but even a partial repeat places a 25-30% extension on the table, especially since BTC dominance continues to lose definition and can no longer suppress alt pairs by default.
The currentBitcoin price action around the $96,400 area strengthens the setup even more. When Bitcoin fails to impose direction, relative-strength assets like XRP/BTC gain freedom to establish independent trends, and this particular configuration carries enough historical backing to treat it as more than coincidence.
815,000 BTC sold in just 30 days
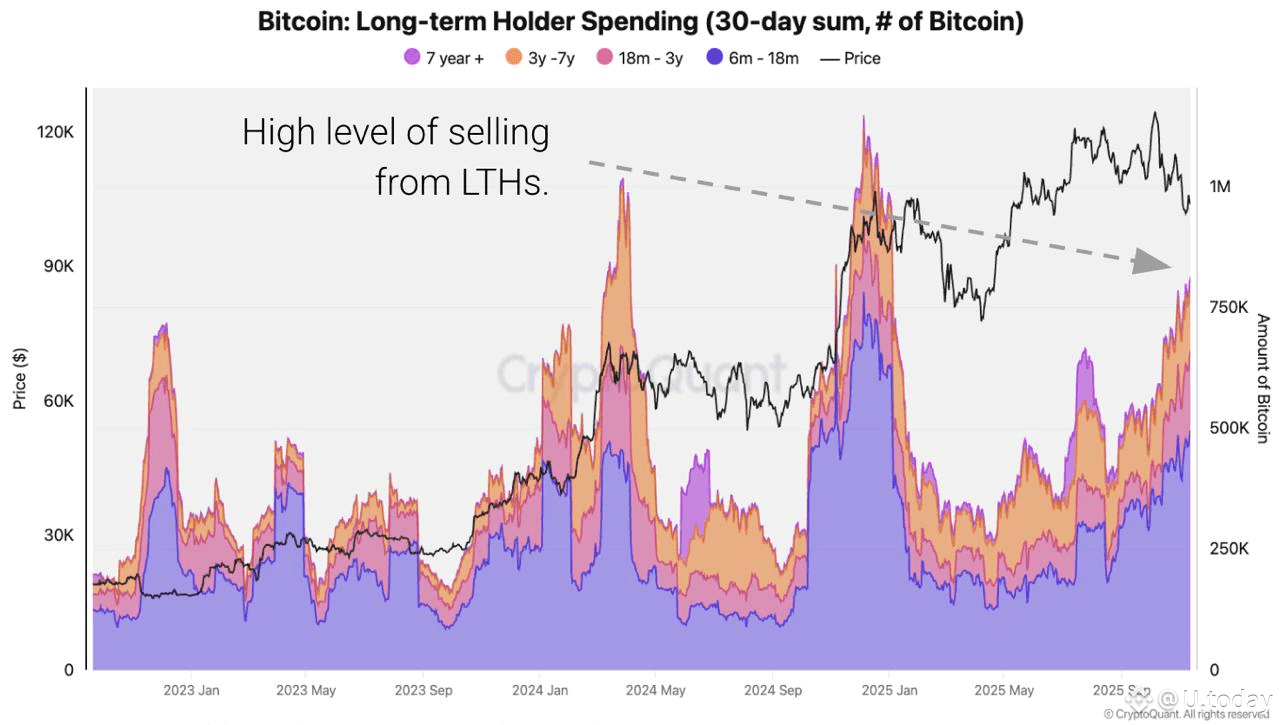
The macro picture becomes impossible to ignore once long-term holder behavior enters the frame. According to CryptoQuant, long-term holders have sold 815,000 BTC in the last 30 days, marking the heaviest distribution wave since January 2024.
Historically, when long-term holders sell at this magnitude, the market does not collapse instantly. Instead, it enters a drifting state where technical signals lose reliability, bounces fade quickly and dips fail to escalate because every move is competing with a stable supply injection.
This phase forces misreads: traders mistake pauses for reversals and volatility spikes for trend changes, but the underlying mechanic is simply absorption of long-term supply.
This selling wave also aligns with a seasonally weak quarter. CoinGlass data already places Q4, 2025 in worse territory than Q4, 2022 and Q4, 2019, both remembered for drawn-out downside phases that continued despite pockets of intraday strength. The combination of heavy LTH outflows and weak seasonal performance creates a gridlock where even logical bounce zones fail to create trend shifts.
card
But there is a competing interpretation. Bitwise CEO Hunter Horsley argues that the market has already been in a bear phase for six months, not entering one now, and that the structure is close to resolution as ETF-driven liquidity reshapes the cycle. If that is correct, this 815,000 BTC wave represents the final stage of transition rather than its onset.
Crypto market outlook
The market heads into the new week looking exactly like the kind of landscape where nothing moves cleanly anymore: Bitcoin is drifting around $96,000, alts are trying to build direction, and the whole market feels driven more by whoever gets liquidated next than by any real narrative.
Bitcoin (BTC): Trades near $96,400, unable to translate volatility into trend.Ethereum (ETH): Still reactive, still shadowing BTC without developing independent strength.XRP: Holds the clearest catalyst via the XRP/BTC crossover structure.


