
There are moments in the market where attention is focused on the noise, but the true signal appears in the structure. And today $INJ is showing one of those signals that can only be appreciated when analyzed calmly: bearish exhaustion, compression, and early signs of recovery.
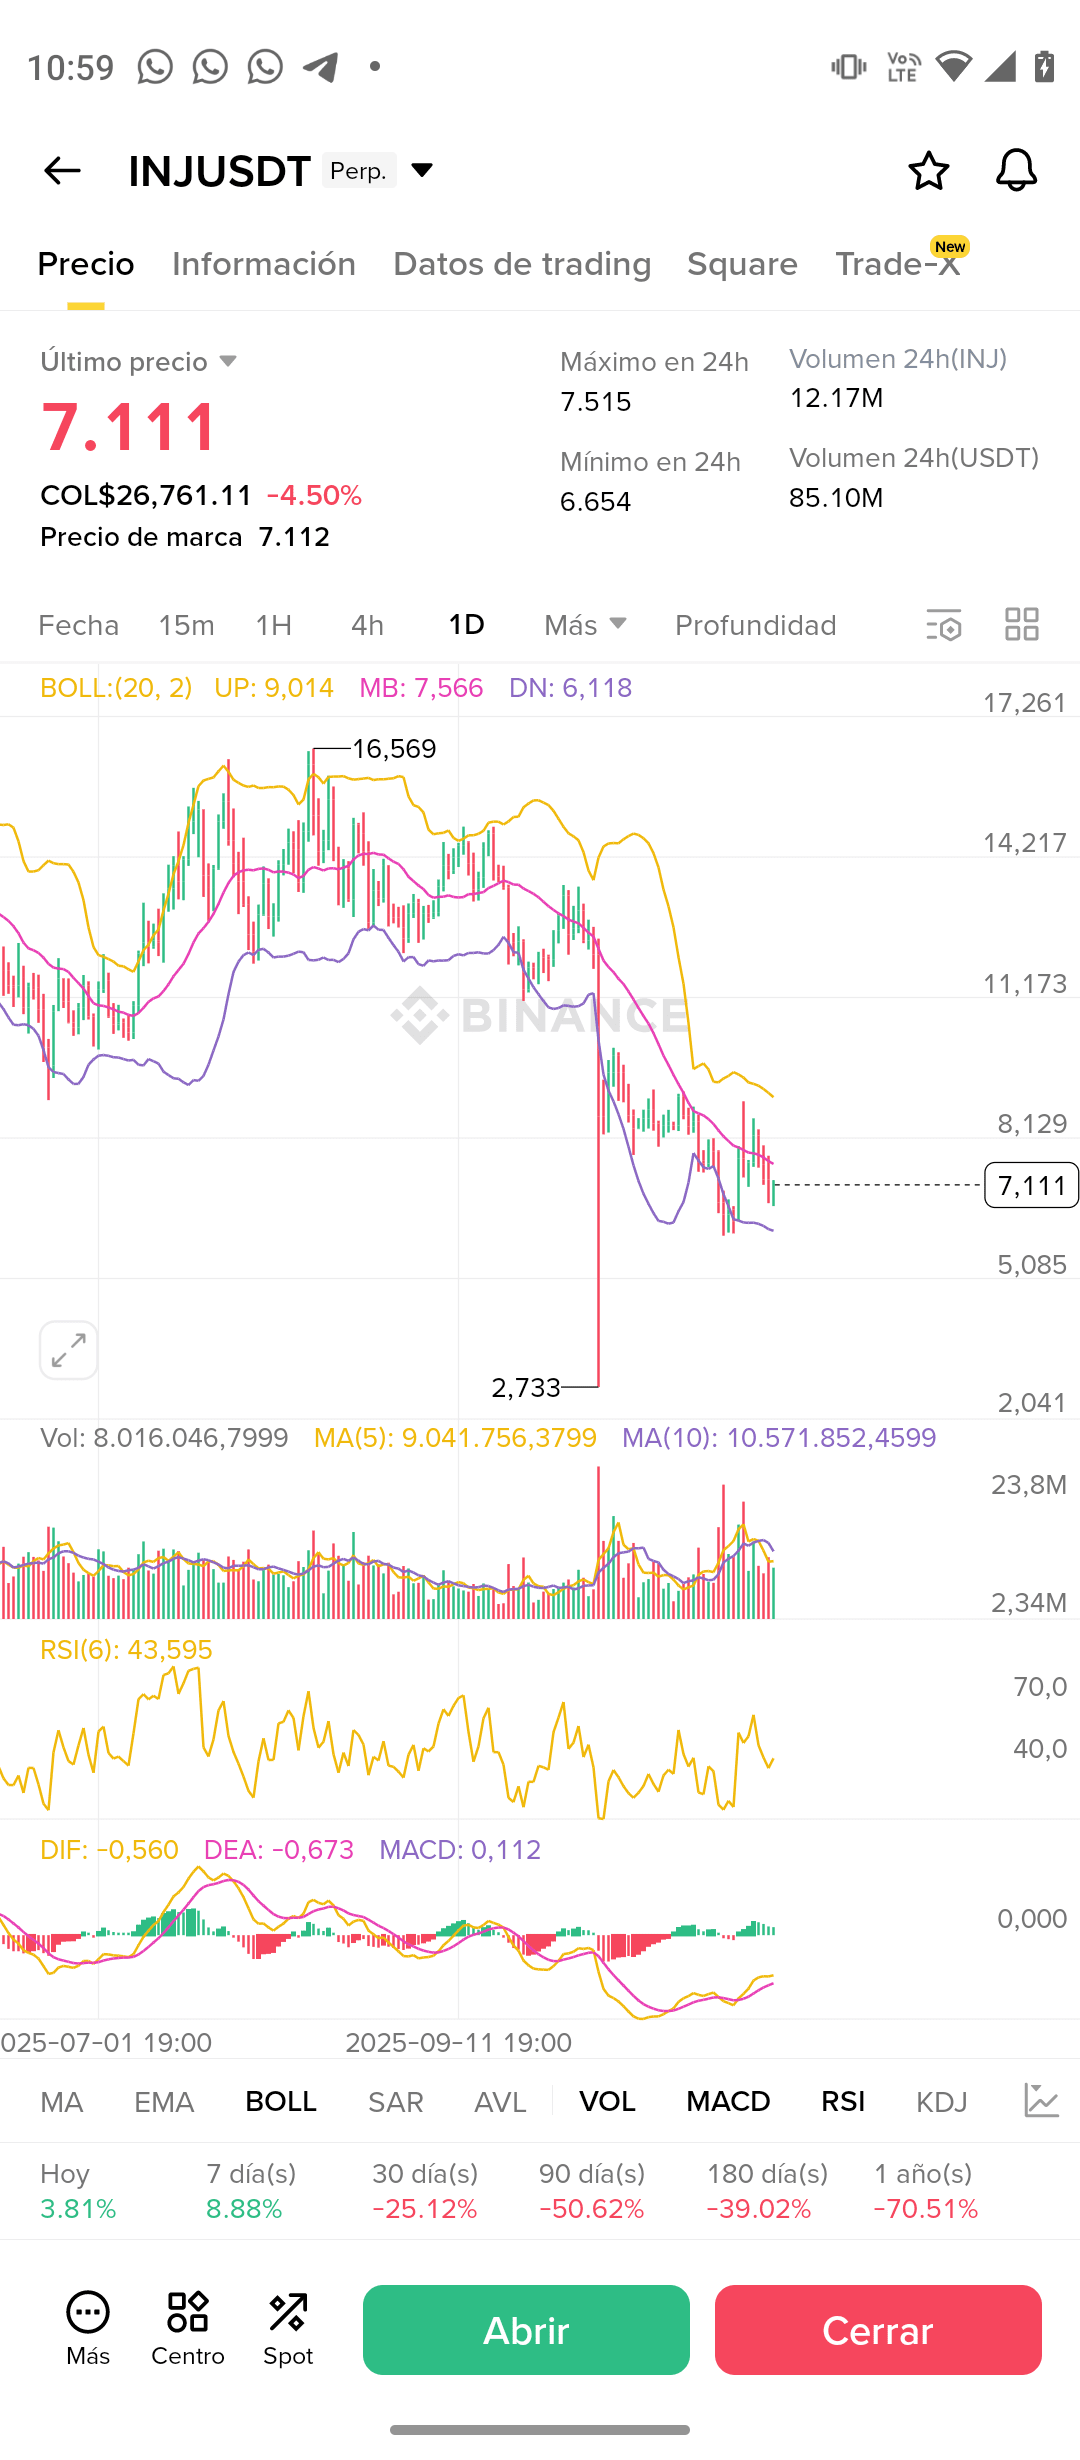
The price is moving around 7.11, holding above the recent low at 6.654 and far from the extreme capitulation at 2.733, a point that left a historical wick that cleared deep liquidity from the market. Since that event, INJ has not broken the structure again, but has been consolidating a range that is starting to show intent to turn.
The Bollinger Bands reflect compression: the lower band stops opening and begins to flatten while the price attempts to return to the middle band, a clear signal of stabilization. The MB (base mean) is at 7.56 and currently acts as immediate resistance. If the asset manages to break it strongly, it could trigger a progressive movement towards the upper part of the range.
The RSI at 43 shows moderate recovery, avoiding entering continuous overselling, which is often a good sign in contexts where the price has been draining bearish pressure for weeks. Meanwhile, the MACD shows a clean bullish crossover with green histograms, confirming that the bearish momentum has lost power and that the market is seeking a new equilibrium.
Key levels:
• Immediate resistance: 7.55 – 7.80
• Bullish confirmation: close above 8.10
• Upcoming objectives: 9.20 – 10.50
• Key support: 6.60 – 6.80
• Macro invalidation: losing 6.60 with increasing volume
The volume also tells its story: recent bearish candles are losing strength, while the rebound candles show significant entries, indicating that medium-term buyers are quietly accumulating. When this happens in a solid project like Injective —with a DeFi ecosystem, cross-chain, and advanced infrastructure— we are not witnessing a weak rebound, but rather a base that could become the next major movement.
Injective has demonstrated that its technology remains one of the most powerful in the Web3 ecosystem, and the chart begins to reflect that foundation: stability, absorption, and initial recovery impulses.
In the markets, major trends do not arise in zones of euphoria; they arise in zones of fatigue… and this chart is confirming that.
