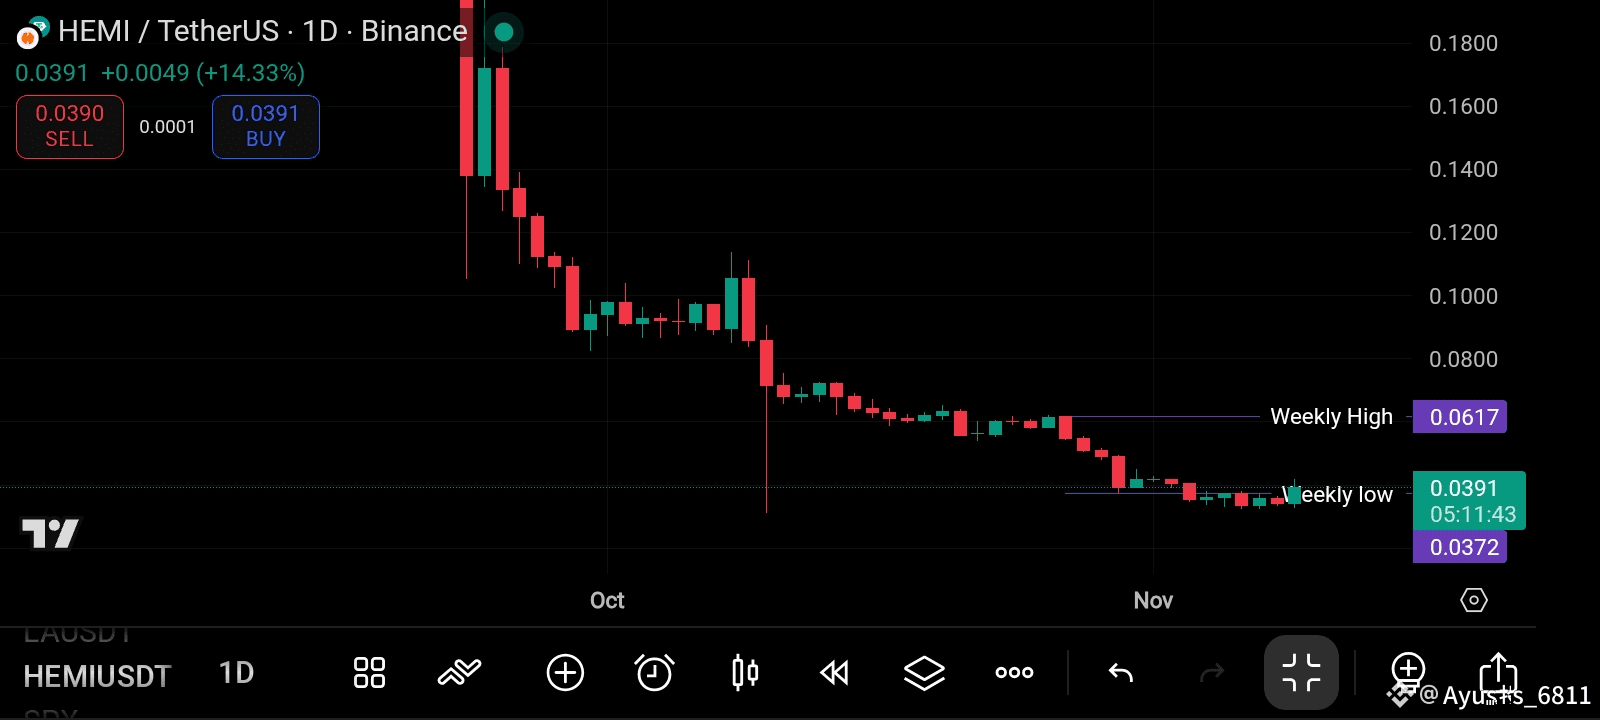
On the daily chart, the price has finally bounced off its weekly low at $0.0372, reclaiming momentum with a clean +14% move. The long period of accumulation near the base suggests exhaustion among sellers, and we’re now seeing the first attempt at structure recovery.
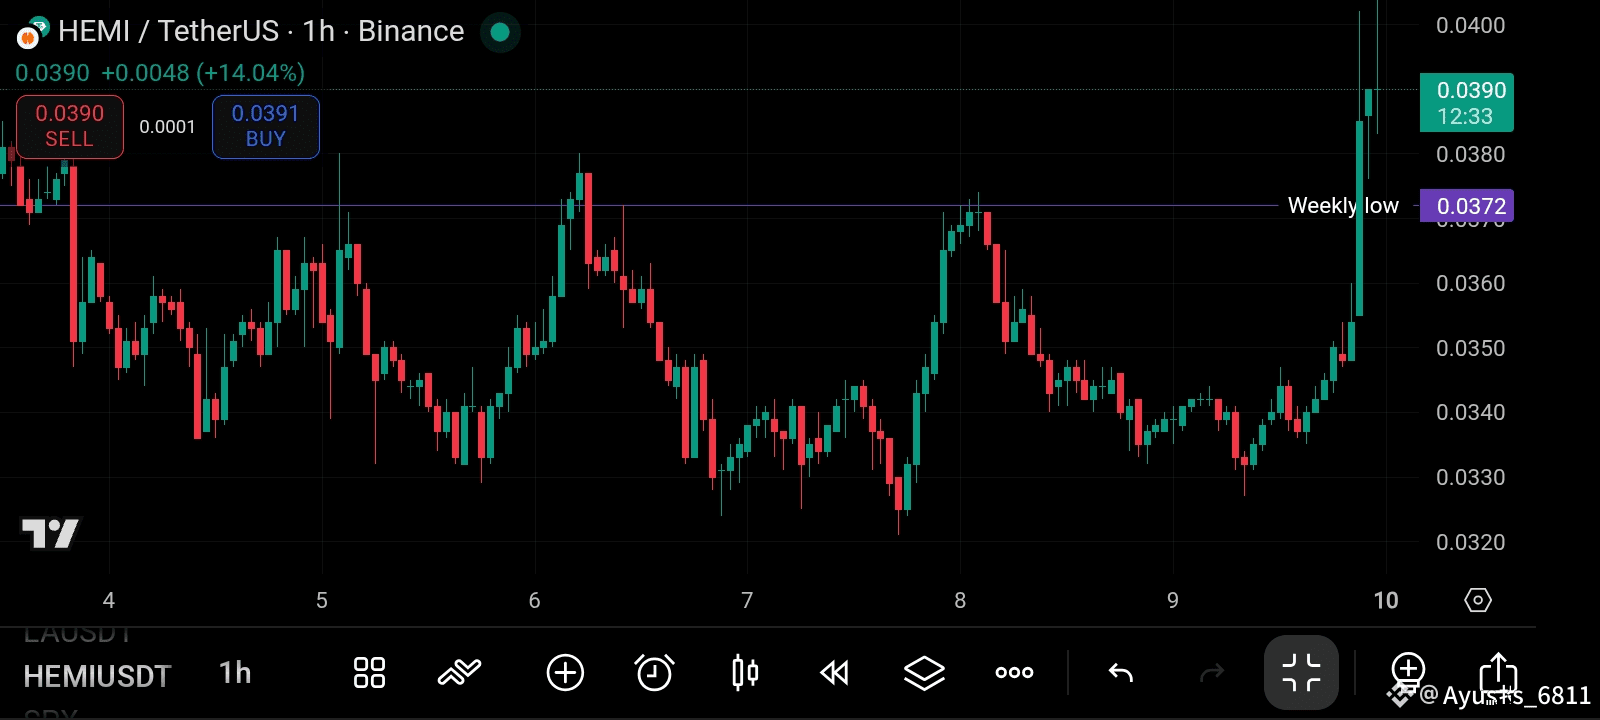
On the 1H timeframe, HEMI flipped its weekly low into support and printed a strong impulse candle — a move often seen before short-term reversals. As long as the price stays above $0.0372, the next target remains the weekly high at $0.0617.
Zooming into the 5-minute chart, a clean ascending trendline is forming, showing strong lower-timeframe momentum. Short-term traders can watch for a retest of the trendline before the next leg up.
In short — HEMI looks like it’s finally trying to break out of its bottom range. If it maintains structure and volume, this could be the early stage of a base-to-breakout setup.