I have been trading cryptocurrency for 10 years, professionally for 6 years, over 1800 days. Starting with a capital of 200,000, over the years, I have experienced various pressures, pain, and confusion. Ultimately, I gained profound insights, simplified my trading techniques, and in just three years, I easily withdrew 45 million in the cryptocurrency circle!
Achieve sustainable and stable profits, making cryptocurrency trading a means to support my family! I have currently made enough profit to buy a house in Shenzhen, a car, and have some savings and assets.
I have done long-term, short-term, ultra-short, and swing trading; I have tried almost every type of method.
 Before discussing technology, I strictly adhere to these 10 ironclad rules of warfare! A must-read for contract novices!
Rule 1: Opening a hedge when you're losing money? That's like giving the loss a "final verdict"!
Is it a big mistake to rush into opening a hedging position just because the contract price has fallen?
The essence of hedging is "acknowledging that losses can escalate." Rather than locking in losses, it's better to cut your losses directly or reduce your position in stages to control losses. (Beginners should avoid hedging; it's a "risk transfer" strategy that experts have already mastered.)
Rule 2: Adding to a losing position is like actively jumping into a margin call!
"Buy more when the price drops to lower your average cost?" That's the dumbest thing a loser can do!
Adding to your position when you're going in the wrong direction is tantamount to hastening your demise! When the risk of a margin call is high, immediately reduce your position in batches; even if there's no risk, don't add to your position, stay put and wait for a signal (adding to your position is handing over a knife to your losses, not saving your life).
Rule 3: Adding margin under high leverage? Leverage is a sickle, not a savior!
Holding onto a losing position by aggressively adding margin is a bad idea. Leverage is a double-edged sword; high leverage only amplifies losses! The time and interest costs of holding onto a losing position can be enough to make you question your existence...
Rule 4: If the overall trend is correct + the margin call price is safe? Lie down and let the profits run!
Even if you've correctly predicted the direction, the margin call price is still far away (a safe zone). Don't act recklessly!
Hold your positions firmly and don't get shaken out by short-term fluctuations—open up the market and wait for the main upward wave to make you money!
Rule 5: Correct overall trend but high risk of margin call? Reduce positions in batches to save your life!
You're on the right track but about to get liquidated? Don't gamble on "not getting liquidated"!
Immediately reduce your holdings in batches until they reach a safe level. Preserving your principal is the key. Look for opportunities to re-enter the market later (as long as you have capital, you can always make a comeback).
Rule 6: Unsure of the direction? Gradually reduce your holdings and take control!
With prices fluctuating wildly, is the direction completely unclear?
The most dangerous market conditions are those with unclear directions! Small positions are acceptable for trial and error, but gradually reduce your positions when the direction is uncertain. Don't let uncertainty eat away your profits!
Law 7: Wrong direction? Cut your losses and reverse your position to recoup your losses!
Knowing full well that you're going in the wrong direction, why stubbornly persist? That's foolish!
Admit your mistakes: Close out positions in batches to stop losses, and at the same time immediately set up positions in the right direction—use the profits from new positions to cover the losses from old positions. This is the ruthless operation of an experienced trader!
Rule 8: Stop loss is the "seatbelt" of trading; without it, you're essentially running naked!
If you're unwilling to accept small losses, you'll inevitably end up losing big money.
Accept that "small losses are transaction costs"! It's like wearing a seatbelt while driving: 99 times it might be fine, but one accident could save your life. Without stop-loss orders, a margin call is inevitable!
Rule 9: Only hedge during the profit-making phase? Beginners can skip this!
Want to hedge every time you make a little profit? Be careful, or you might end up losing everything!
Hedging is an advanced operation that requires precise calculations and accumulated experience! For beginners, it's best to secure profits first, and only attempt complex strategies after you've mastered them.
Rule 10: Making big money in contracts depends on the profit/loss ratio, not the win rate!
Trading every day in pursuit of a high win rate, yet still ending up losing money?
Remember: Earning once with a 10x leveraged contract is equivalent to earning 10 times with a 100x leveraged contract! Use small stop-losses (e.g., 1%) to aim for huge profits (e.g., 5%+). Strictly adhere to stop-loss orders 99 times; just one successful trade can multiply your investment several times over! Win rate isn't important; the profit/loss ratio is what makes you a money-printing machine!
To put it bluntly: Web3 contracts are not a gamble, but a battle of rules against human nature!
The topic of this article is: Simple pullbacks in trends, and the best entry point for trend following.
Price movements consistently exhibit certain recurring patterns: trend retracements, trading ranges, and trend reversals. Trend retracements can be categorized into simple retracements and complex retracements. Simple retracements refer to one or two simple pullback movements, while complex retracements refer to multi-stage, complex pullback structures.
A pattern can have many variations, and when one pattern fails, a new structure may immediately form. Furthermore, the meaning of a pattern structure often differs depending on market conditions and its location. It's difficult for beginners to grasp these variations until they learn to integrate and apply them.
Later, we will teach you how to integrate and apply the knowledge you have learned, so please don't rush. In the early stages of learning, you should focus on reviewing and reflecting on what you've learned, and engage in deep thought, summarizing, and contemplation.
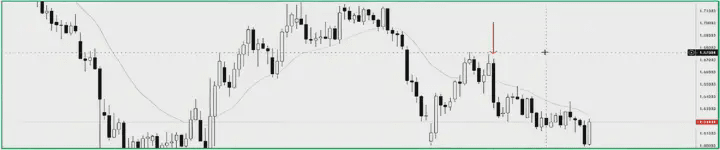
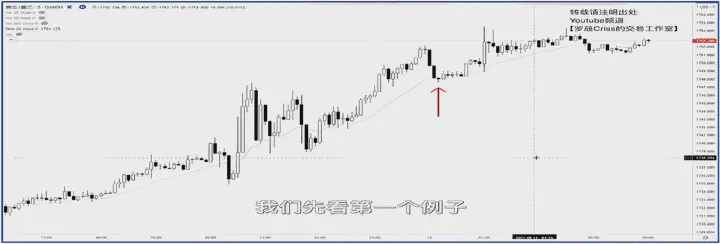 The red arrow marks a very standard, simple pullback pattern. Let's take an uptrend as an example. First, you need a clear, rapid, and strong upward move. This strong move should ideally break through a consolidation range, significantly breaking it, so that those looking at the chart feel that the bulls have taken control of the market. This is a prerequisite, because only with a clear trend can a pullback exist. If you were previously in a rapid upward move within a consolidation range without breaking through key levels, and the major market players don't yet consider it a clear trend, then there's no such thing as a pullback.
To summarize the conditions for a simple callback to be valid:
First, there must be a clear and strong trend movement, a movement that exudes a palpable sense of trend strength. Ideally, it should break through a clear consolidation range and a significant price swing, allowing both buyers and sellers to recognize it as a distinct trend. This strong trend is what you should follow.
Secondly, the pullback should be simple and clear, without too many horizontally overlapping candlesticks. If a pullback involves too many horizontally overlapping candlesticks, it represents a small trading range. After entry, this becomes a clear resistance level in the direction of price movement. We want to avoid such clear resistance in the direction of price movement after entry.
Third, there must be an entry pattern. This example is excellent; it demonstrates all three commonly used entry patterns.
Fourth, this pullback should ideally be at the beginning of a trend. If a trend has been running for a long time with only simple pullbacks and no complex ones, it may soon face a prolonged and complex pullback. If a trend has been running for a long time, traders who established positions early in this trend have already made substantial profits and may begin to close their positions. Meanwhile, contrarian traders who have been observing from the sidelines will also seize this opportunity to enter the market and vie for control. Since the market may face a complex pullback, this kind of trading should be avoided.
 Given this chart, with prices reaching this point, what should you do?
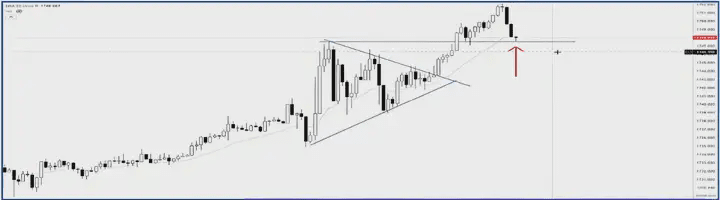
First, you need to mark the key levels in the market and see what the market is doing right now. Additionally, you can see a breakout from a triangular consolidation range, although I personally don't like using this method much.
The price first rose rapidly, breaking through a converging range, and then broke through a key swing point. Now the market is clearly dominated by the bulls. Then the price underwent a simple pullback (with basically no overlapping candlesticks), with two long downtrend candlesticks and one reversal candlestick.
The current price movement has retraced to the high of this wave, and is also around the EMA20. The area around the EMA20 is a simple reference zone for entering a trade on a pullback. This reversal candlestick reverses this pullback, turning the market back to its original trend direction. Where did it appear? It appeared at a horizontal retracement level, near the EMA20, which is a good entry point, making it a very good signal candlestick. How to enter? Wait for it to break above the previous high before manually entering, or place a breakout order at its high point, and enter when the next candlestick breaks above the previous candlestick's high.
Some people enter the market immediately upon seeing a reversal candlestick pattern, which is one approach, but not recommended. When a reversal candlestick appears, it's just a signal. You should wait for the signal to hold (the next candlestick must break above its price, demonstrating the strength of the bulls) before entering. Sometimes, this candlestick pattern might not even break above, and the price might continue to fall. If you enter immediately, you'll get trapped. Personally, I only enter after a breakout.
 Let's continue. The reversal candlestick we just saw was called a signal candlestick, an entry signal. The next candlestick is the entry candlestick; you enter the market on this one. This current pattern is called a breakout; the first upward breakout is called a "high one." This pattern is very difficult to grasp; very few people can successfully execute a high one.
After the initial entry candlestick, two doji candlesticks appeared. This isn't a particularly good signal, because after entering the market, one hopes to see continued upward momentum from the bulls. However, the two doji candlesticks indicate that the price is still stagnating, and it's advisable to observe for now. The third candlestick, which is the one that has appeared now, has surpassed the high of the previous candlestick. This second upward breakout is called "High 2," and the High 2 entry pattern signals a second upward push from the bulls. Those who didn't enter at High 1 might consider entering on this candlestick.
After entering the market at high 2, it closed with another candlestick that represents the strength of the bears. The many overlapping candlesticks indicate a trading range.
This pullback is a downtrend on a smaller timeframe, but the downward momentum has paused within this small trading range. Those who haven't entered the market yet might choose to enter when the price breaks through the high of the next higher candlestick, as this short-term trading range is a consolidation pattern, and a breakout from this pattern could be an entry signal for some.
Breakout from the first high, breakout from the second high, and breakout from the trading range are some of the most commonly used entry patterns for simple pullbacks.
 This bullish candlestick pattern indicates strong bullish momentum, signaling a powerful upward push. Whether you entered at the higher end of the previous day, the second higher end, or through a breakout from a trading range, your entry has been confirmed. This is how you trade based on this pattern.
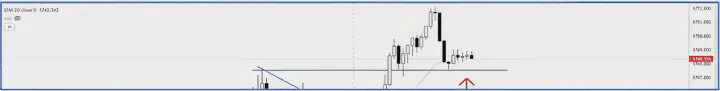
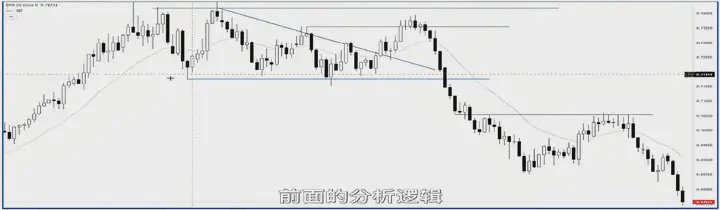
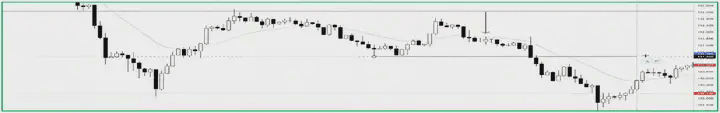
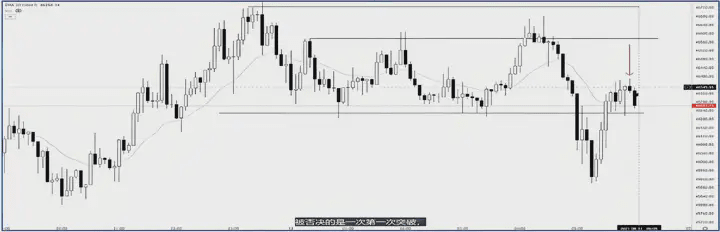 When you get a chart, you need to first understand what the market is doing. First, draw horizontal lines and mark the key horizontal levels. First, the market experienced a strong upward trend, followed by a correction. This correction was complex and multi-stage.
After the pullback ended, the market resumed its previous upward trend, but this momentum quickly ran out. This indicated that bulls were unwilling to continue buying, and their strength was insufficient to push the market above the previous key support level. Here, a failed breakout followed by a low-level shorting pattern emerges.
After the market lost its upward momentum, it broke through a key support level. This tells us one thing: the bulls have completely given up and are no longer willing to defend even the levels they've repeatedly tested; they're only willing to buy at even lower prices. How lower? We'll have to wait and see how the price performs.
After the price broke down, it rebounded quickly. This breakout was rapid, and so was the rebound – a pattern we're very willing to trade. When the price reaches the moving average, we need to look for entry patterns. First, the low 1 pattern was rejected by the market. Why? Because there were already three overlapping candlesticks, indicating a trading range, and ranges are prone to false breakouts.
The crucial signal candlestick pattern has arrived. The bearish candlestick indicated by the arrow is a small candlestick, and the advantage of a small candlestick as a signal candlestick is its narrow stop-loss. Secondly, this candlestick broke through the high of the previous candlestick, but after breaking through the high, it formed a long bearish body, indicating a false breakout. If this signal candlestick is broken downwards, it forms a low-2 shorting pattern. When the price breaks below the low of low 2, a breakout order might be placed to enter a short position.
 The subsequent trend was quite simple: it confirmed the short-selling signal, and it was a simple pullback pattern.
To summarize: First, the market conditions allowed for short selling. The market rallied, corrected, the upward momentum weakened, and a downward breakout occurred, indicating a market bias towards short selling. Given this bias, a rapid drop followed by a rapid rebound and pullback occurred, eventually forming a low-two entry pattern. Entering a short position resulted in a simple profit.
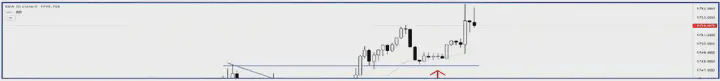
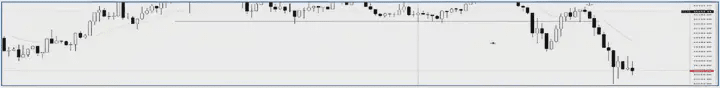
 When you get a chart, you first need to understand what the market is doing. Look at the left side; there's a long downward movement, followed by a complex wedge-shaped pullback. After the pullback, the downtrend continued. The downtrend hasn't changed, so it's just a simple pullback. This pullback's upward movement is non-overlapping and very rapid. Now it's time to look for entry patterns.
When the price reaches this point, it experiences its first breakout, a low of 1. Aggressive traders might jump in on the first breakout, but it depends on the individual case. Unless the initial breakout signal candlestick is exceptionally strong, like in the first example—a strong reversal candlestick—it's advisable to participate. Otherwise, wait for a secondary breakout.
The candlestick that followed was a bearish one, but it still largely overlapped with the previous one, indicating a non-trend candlestick. If this is your first entry, your short position hasn't been confirmed by the market yet, so keep watching. The arrow indicates a very crucial candlestick. First, it showed a false upward breakout, and then it was the second candlestick to break below the previous low.
 Additional information: Variations of the double breakout. Looking only at the candlestick lows, we can't yet count a double breakout, as it consistently shows lower lows. However, the double breakout discussed earlier refers to two attempts by the opposing side to break out. We're currently looking at the daily chart; let's look at the four-hour chart.
The previous bearish engulfing candlestick pattern showed an initial upward breakout followed by a downward breakout. On a smaller timeframe, this can be seen as a double breakout, a second attempt by the bears—a variation of the double breakout. The fact that this bearish engulfing candlestick first broke upwards and then downwards represents the first exertion of bearish force, and this is the second exertion of bearish force. Therefore, it is a double breakout entry pattern, a very good signal candlestick, and also an entry candlestick.
After entering the market, the entry logic was immediately confirmed. To summarize this trade: First, the overall market background supported shorting; then, the price reached the appropriate level for shorting (around EMA20), and a shorting signal pattern was provided. Entering the short position resulted in a profit, making this a relatively simple trade.
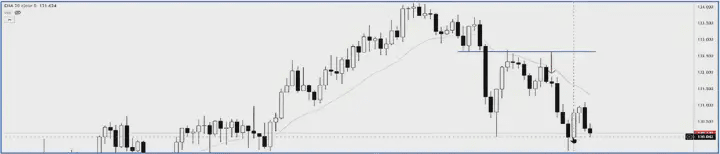
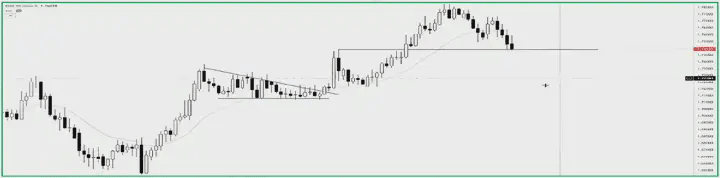
 When you get a chart, first analyze what the market is doing and draw key levels. On the left side of the chart, the bulls initially exerted strong momentum, creating a rapid rise, followed by a simple pullback, and then a complex correction. This complex correction is actually a variation of a wedge. After the correction, the price broke through the wedge, continuing the bullish trend, but only broke through the previous minor high, failing to break through the previous wave high. The bullish continuation lacked follow-through strength, forming a false breakout.
This indicates insufficient bullish momentum, with a downward breakout (similar to a previous case). The upward breakout lacked strength, and the defense below failed, meaning the bulls no longer want to buy in; they're only willing to buy at deeper levels. How deep? That depends entirely on the specific price action and cannot be predicted. Furthermore, those skilled in identifying false breakouts would have already entered short positions at this secondary resistance level.
Let's continue watching the subsequent price action to find a simple pullback. A sharp drop, followed by a pullback. This pullback isn't actually very good because there are too many overlapping candlesticks. The trading range formed by these overlapping candlesticks could become resistance for shorting, and the price might find support again within that range. Strictly speaking, this signal should be discarded within the simple pullback pattern.
Let's look for entry patterns. This is the first breakout from the low, a low of 1, but it was preceded by a non-trend candlestick. I personally don't recommend trading on this kind of first breakout.
Continue to observe. The price continued to rise before pulling back, forming an inside-out doji candlestick. Then there was a false breakout to the upside, at a key support/resistance level. We'll wait for another downward breakout candlestick before considering shorting. However, strictly speaking, the entry logic for this shorting isn't simply a pullback-based shorting strategy; it requires a false breakout of a key level for the shorting logic to hold.
So why is this pullback more complicated? As mentioned before, we don't want too many overlapping candlesticks in this pullback wave. Too many overlapping candlesticks in the preceding phase could distort the subsequent pullback trend. This candlestick is the second downward breakout, low 2, which is also the entry candlestick.
Let's continue. The subsequent price action resulted in many non-trend candlesticks, including doji candlesticks, which is undesirable. A conservative trader might have exited the market after witnessing such unclear price action, regardless of whether the price went up or down. This repeated price pauses contradicted their initial trading logic.
Another approach is to continue holding your short position as long as the price doesn't break the secondary resistance line above, provided your entry logic remains unchanged. This is also a valid trading strategy.
Let's continue. The price has already offered a very good profit margin, but this trade is probably not worthwhile. To summarize, the market allows short selling, the uptrend is correcting, the upward momentum is weak and breaking down, and the decline is rapid (based on the previous analysis). However, this pullback has encountered a problem; there are too many overlapping candlesticks, causing the subsequent patterns to become somewhat distorted and strange. If you are a conservative or stable trader, simply abandon this trade, regardless of how tempting the profits may seem. This pattern is actually very uncertain, and your win rate has already been reduced.
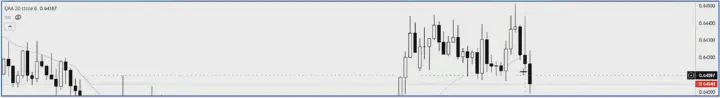
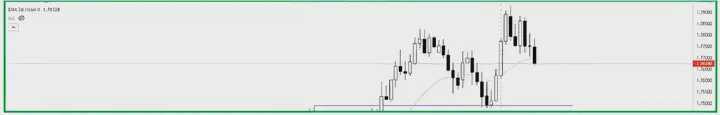
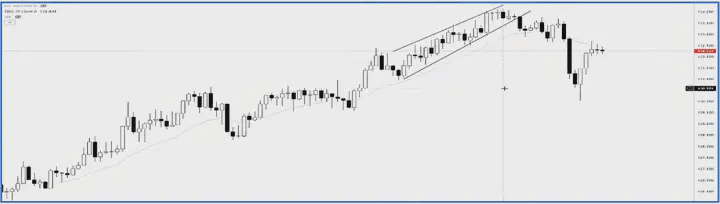 When you get this chart, you first need to see what the market is doing. There was an initial upward trend, followed by a simple correction, and then a rapid upward move, forming an upward channel (this is a rapid channel pattern, which often breaks down and then retests the channel's starting point). This is a new round of rapid upward movement, and this is a pullback. This doji candlestick indicates that the two-stage downward pullback failed to break through the upward trend. This can be directly analyzed from the daily chart.
 On the shorter 4-hour chart, we can see these two downward pullbacks, and the subsequent upward movements after the pullbacks are weak.
 As mentioned before, the upward trend had momentum, then a correction occurred, followed by a continuation of the upward trend, but this continuation was weak and a downward break occurred. That would indicate a market biased towards short selling.
Next, draw the key horizontal levels. A rapid drop, a quick rise, and a simple pullback—this is the simple pullback pattern for trading.
Now we need to find an entry logic, an entry pattern. When the price moves to this point, it shows a triple engulfing candlestick pattern. This triple engulfing pattern is within a converging range on a shorter timeframe. Since it's a converging range, we can trade its breakout. If it breaks down, it perfectly fulfills a shorting logic. At the same time, this candlestick also retests the previous breakout point, a support/resistance exchange confirmation point. This adds another reason to short. Therefore, when the price breaks below the low of the triple engulfing candlestick, it's a good entry point.
Let's continue to observe whether the subsequent price action validates the short-selling logic. After this decline, there was a simple upward correction. The entry point on the left is Low 1, but after the initial breakout, the downward momentum didn't continue, and it rose again. This is Low 2, a candlestick pattern indicating a second short-selling entry.
Let's continue to observe the subsequent trend. At this point, the market has already presented a very favorable profit target, so we won't look at the later stages.
 In the shorter timeframe, low 2 represents a break below two previous highs. All secondary breakout patterns in longer timeframes tend to form double tops and bottoms in shorter timeframes.
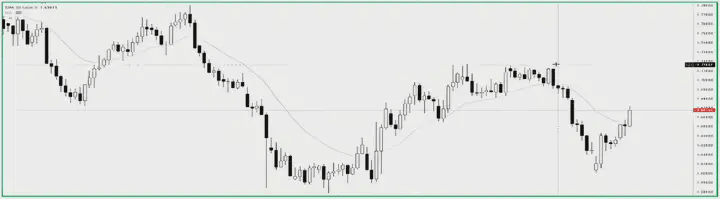
 When you get a chart, let's analyze what the market is doing. First, there's a rapid rise, followed by a price correction. After the correction, it breaks upwards, leading to a decent trend that's worth following. Here's a little tidbit: some people call this a breakout pullback, but I call it a failed breakout. First, the large bullish candlestick represents a breakout, and the subsequent decline is called a failed breakout. The final upward move is the failed breakout pullback.
When the price moved to this point, it was a simple decline, but there were overlapping candlesticks before the decline, which wasn't ideal. However, if your bullish logic and risk-reward ratio were based on capturing the previous high, then it didn't matter. Let's continue. The next candlestick was an inside bar, which is meaningless. The subsequent candlestick was a high 1, but I personally prefer to enter at a high 2. Then the signal for high 1 was rejected by the market.
The initial expectation was for a simple, one-stage pullback, but the market rejected this and initiated a second stage. Both one-stage and two-stage pullbacks are simple pullback patterns. If you were stopped out on the first stage pullback, and the second stage provided an entry candlestick pattern, you should still enter, because they are both simple market pullbacks. When the price moved to this point, it tested the previous breakout point, adding another logic for going long. If a long signal candlestick appeared here, you should participate. However, what followed was a non-trend candlestick.
 Let's continue. The large bullish candlestick here breaks through the previous high, which can be interpreted as a double breakout or a two-stage pullback entry pattern. Logically, going long here would be a very good trade. For short-term traders, the subsequent three large bullish candlesticks would have been a perfect profit-taking opportunity.
Additional information: The concept of a flag pattern. All corrective patterns are called flag patterns. A corrective pattern in a bull market is called a bull flag. A bull flag tends to break upwards, leading to a continuation of the bull market. However, if the momentum for this bull market continuation quickly dries up, then this corrective flag pattern is called a flag pattern at the end of the trend. It may indicate the final upward move in the trend, and it is a potential reversal pattern because the expected continuation of the trend momentum did not continue, thus reversing the trend.
The previous examples all involved a single-stage callback, which led to good entry points. But this time, the single-stage callback has become a two-stage callback, although it still falls under the category of simple callbacks.
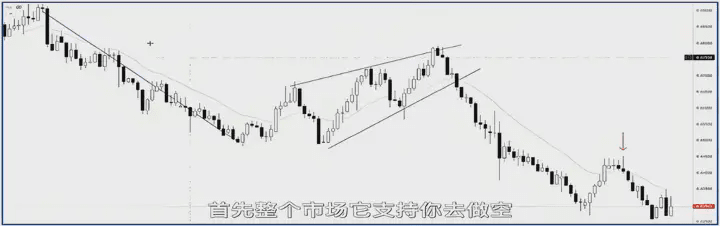
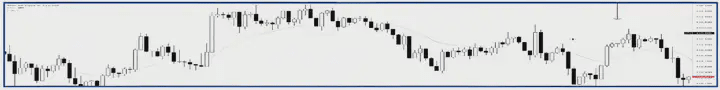
 Given a chart, let's first analyze what the market is doing. First, the market experienced a rapid and deep decline, followed by a complex correction. This correction was actually a wedge correction, a variation of the triple push wedge. Even without considering the wedge or triple push pattern, you can see that the strength of each breakout was decreasing, eventually ceasing all breakouts, or even breaking downwards. This indicates that in the subsequent price action, the price will definitely be biased towards shorting.
After a rapid decline, followed by a simple upward correction, the current situation fits the logic of a simple pullback. It's time to look for an entry candlestick pattern.
 This isn't the desired candlestick, but it indicates weak bullish momentum. This is low 1, suggesting a continued decline followed by a rebound. In actual trading, at the close of this candlestick, you would immediately place a short order to wait for a break below; the arrow indicates low 2. When the price reaches your entry area, you're waiting for your entry pattern, and you need to closely monitor the closing price of each candlestick.
To summarize these cases, simple pullback entry patterns include single breakout, double breakout, and range breakout.
I prefer to trade on double breakout patterns because a double breakout is a second confirmation of your trading direction. It's a very conservative trading pattern and my favorite. I only participate if the initial breakout signal candlestick is a very strong signal; in the first example, it was a strong reversal candlestick. There are many variations of box breakout patterns, and box breakouts are rare in today's market. When reviewing past trades, pay close attention to entry patterns for both first and second breakouts.
Simple pullbacks, while seemingly easy, are actually difficult to execute in actual trading. To trade this pattern, you must first determine if the overall market condition allows for a simple pullback to occur; the trend must be strong, and the pullback must be clear. Moreover, trading opportunities with this pattern are often fleeting, requiring rapid chart reading and decision-making abilities. You can review past trades to find examples of this pattern, observing when it occurred, when it failed, and how the market behaved before and afterward.
On shorter timeframe charts, markets can easily form trends. If you master the simple pullback pattern, making a living trading based on this pattern wouldn't be difficult. However, this pattern is not as easy to master as it seems. Many failed patterns weren't discussed due to time constraints.
Today I didn't discuss stop-loss and take-profit levels for simple pullback patterns, because exiting a trade is a separate skill, and everyone should find the exit method that best suits them.
These are my trading insights from 10 years of cryptocurrency trading experience. After many ups and downs, these are heartfelt words of profound understanding, and I hope they will be helpful to everyone. I am Xiaoyue, a professional analyst and teacher, a mentor and friend on your investment journey! As an analyst, the most basic requirement is to help everyone make money. I will help you resolve confusion and get out of trouble. I let my results speak for themselves. When you are lost and don't know what to do, follow Xiaoyue. Xiaoyue will guide you. #加密市场回调 $ETH