Let’s focus on how this greed and fear is calculated, to make it easier to understand later. I will explain briefly; if I say everything, you can create something exactly the same. Mainly, there are 4 dimensions, taking the 24H greed and fear calculation as an example,
Spatial Dimension (the current price and trading volume status within 150 days),
Technical Indicators (the speed and amplitude of decline, generally used to judge short-term fluctuations),
Time Dimension (for example, the situation of continuous rise or continuous fall over a recent period),
Market Dimension (currently mainly referencing BTC, which is the beacon; except for some junk coins, most rise and fall along with BTC, and the price changes of BTC directly affect most other currencies)
The calculation of the greed-fear indicator mainly consists of the results synthesized from the above 4 calculation dimensions according to certain proportions. It can roughly reflect the current state of virtual currency.
At first glance, why is there no analysis of market sentiment? The smart you should realize that most of the people shouting online have their emotions manipulated. Most of the feedback data is noise. If you let big data summarize and let AI analyze, the results cannot be said to be useless, but rather not worth the cost. Just the expenses for analysis are enough to buy you many eggs. To think in another way, isn't emotion reflected in the K-line? When it soars to the peak, it feels great, but when it drops, people cry and curse. As for news leaks, apart from a few rare messages like Taco from the understanding king, how many are real and how many can you utilize or arrange in advance? Excluding you being a big shot, you are the one controlling the K-line.
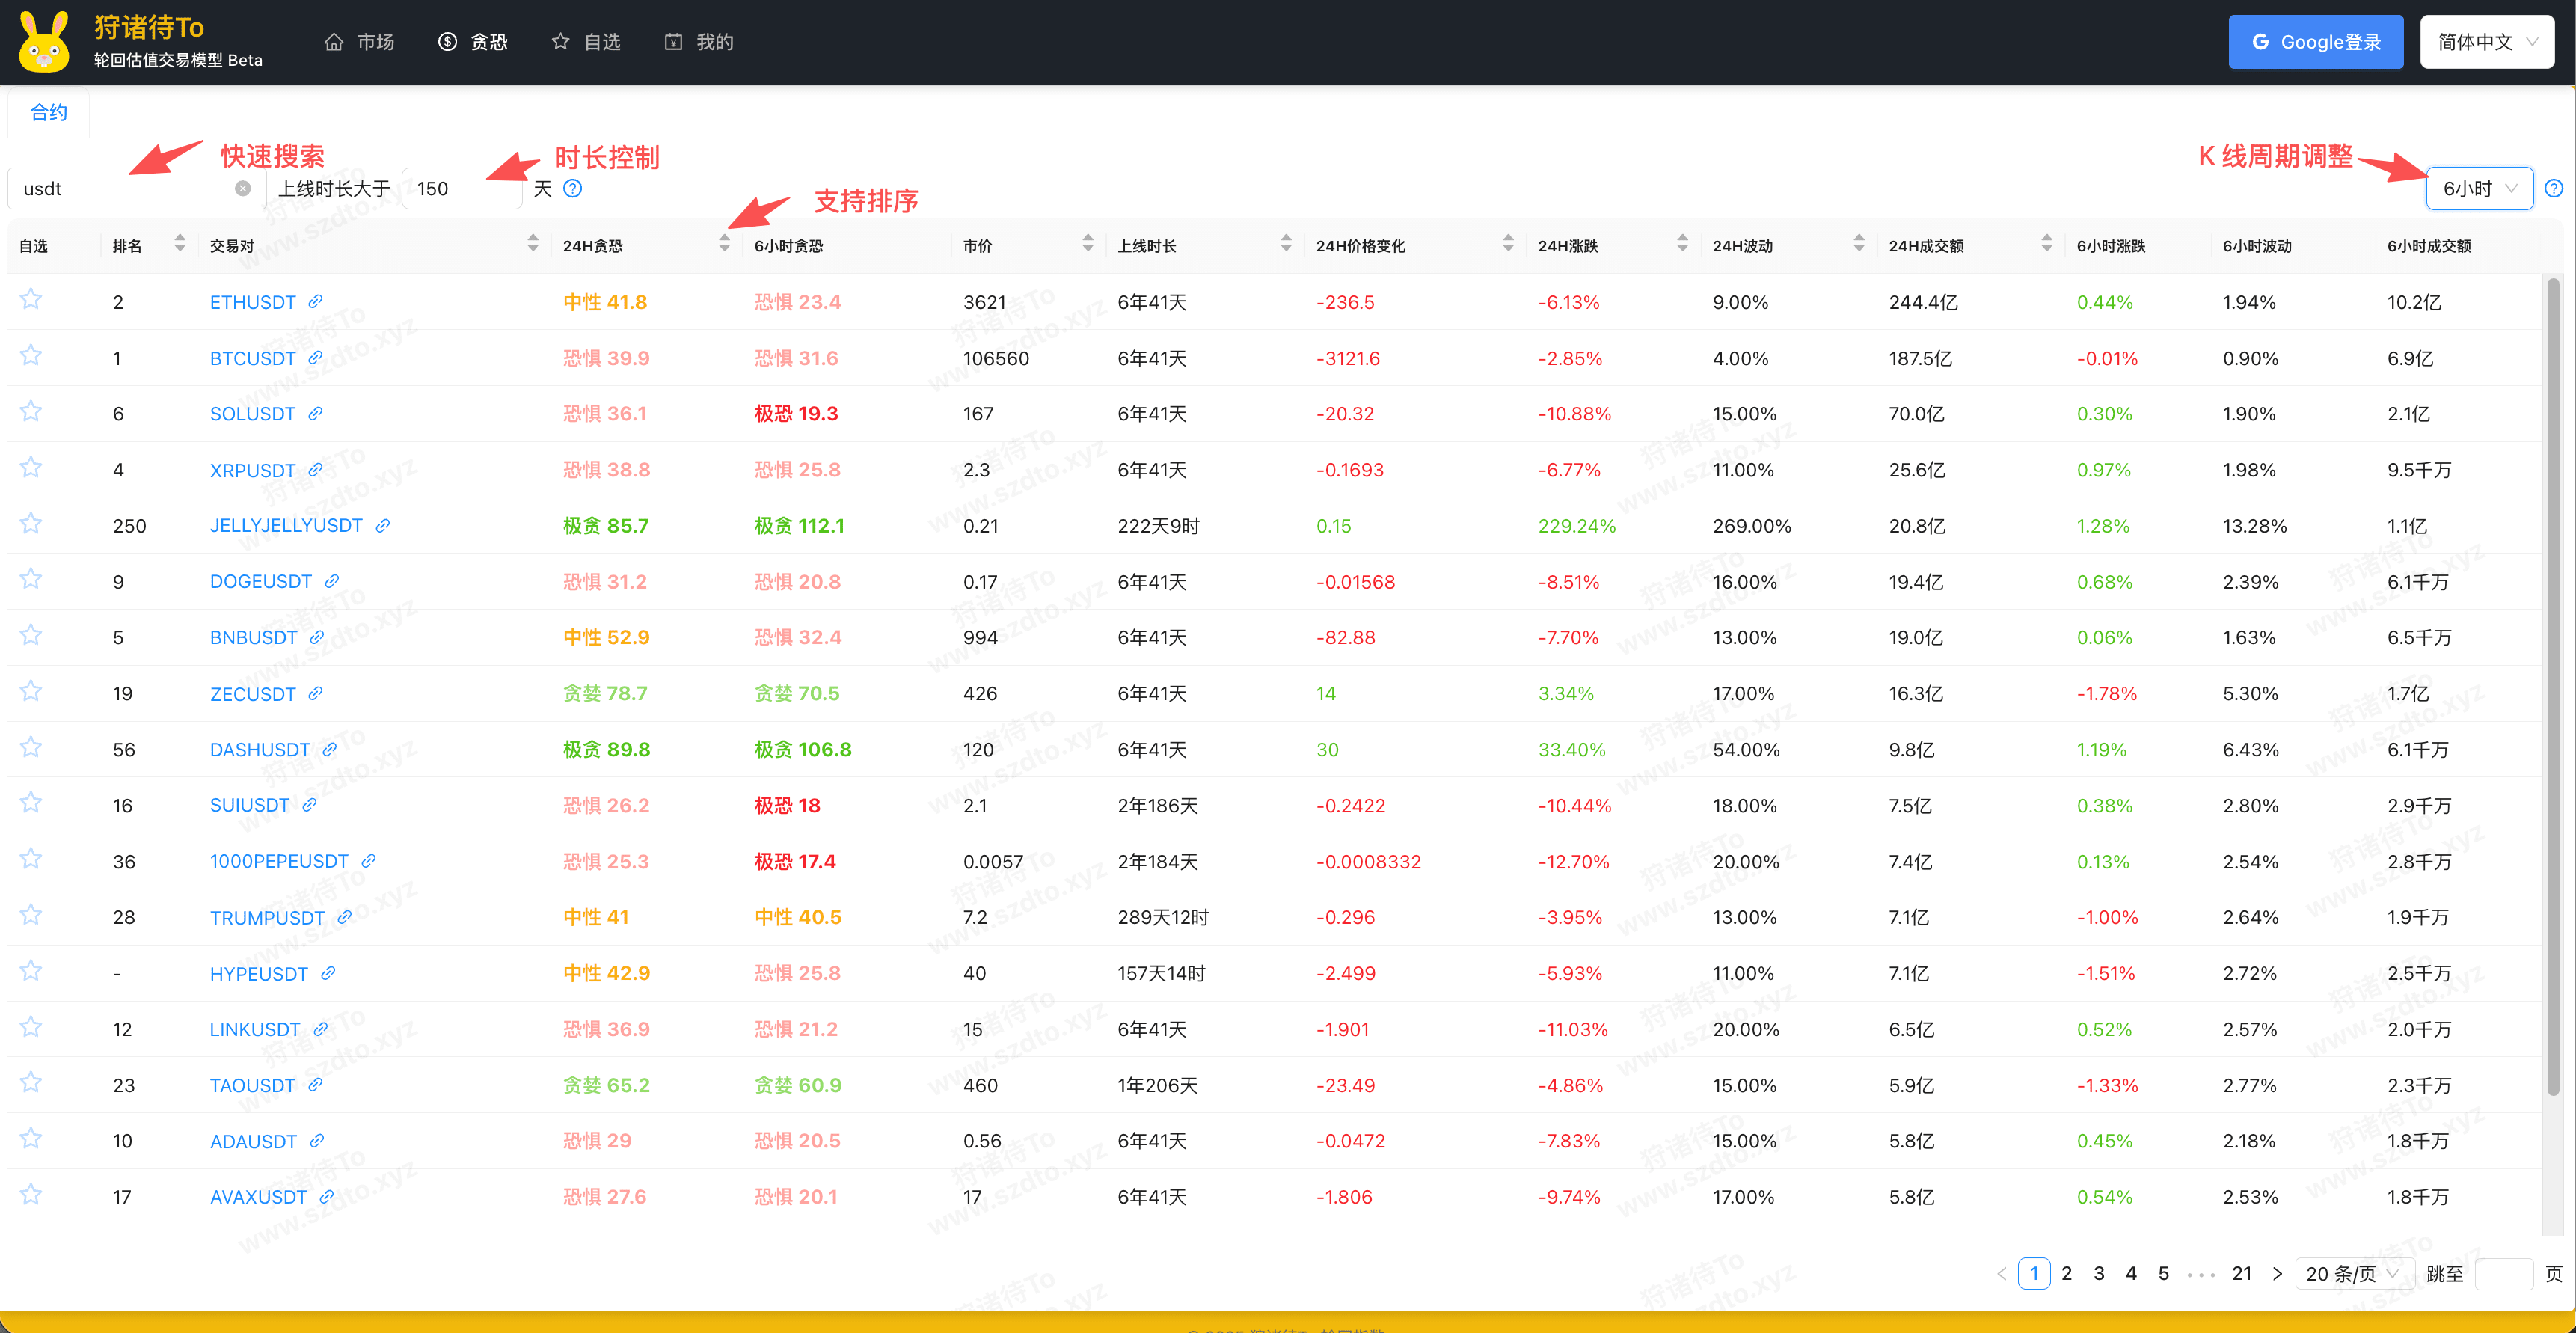
Currently, Binance has launched many different types of settlement unit contracts, such as USDC and USDT, but in fact, their prices do not differ much. To avoid displaying a lot of duplicate data, you can directly enter USDT in the search box to filter out USDT settlement contracts. Of course, you can also directly enter the contract you want for precise searching.
Regarding the control of the online duration, there are many uses. But one major function is that the calculation of greed-fear requires a certain amount of K-line data. For example, the 24H greed-fear actually requires the most recent 150 K-line data, meaning it will analyze trading data from the last 150 days. As for other K-line cycles, the time dimensions required may differ. You can often see Binance delisting contracts and adding new contracts. Generally, contracts that have been online for a longer time and have a larger trading volume have a smaller risk of being delisted. Many contracts announced for delisting are like stepping on a mine if you bought them previously.
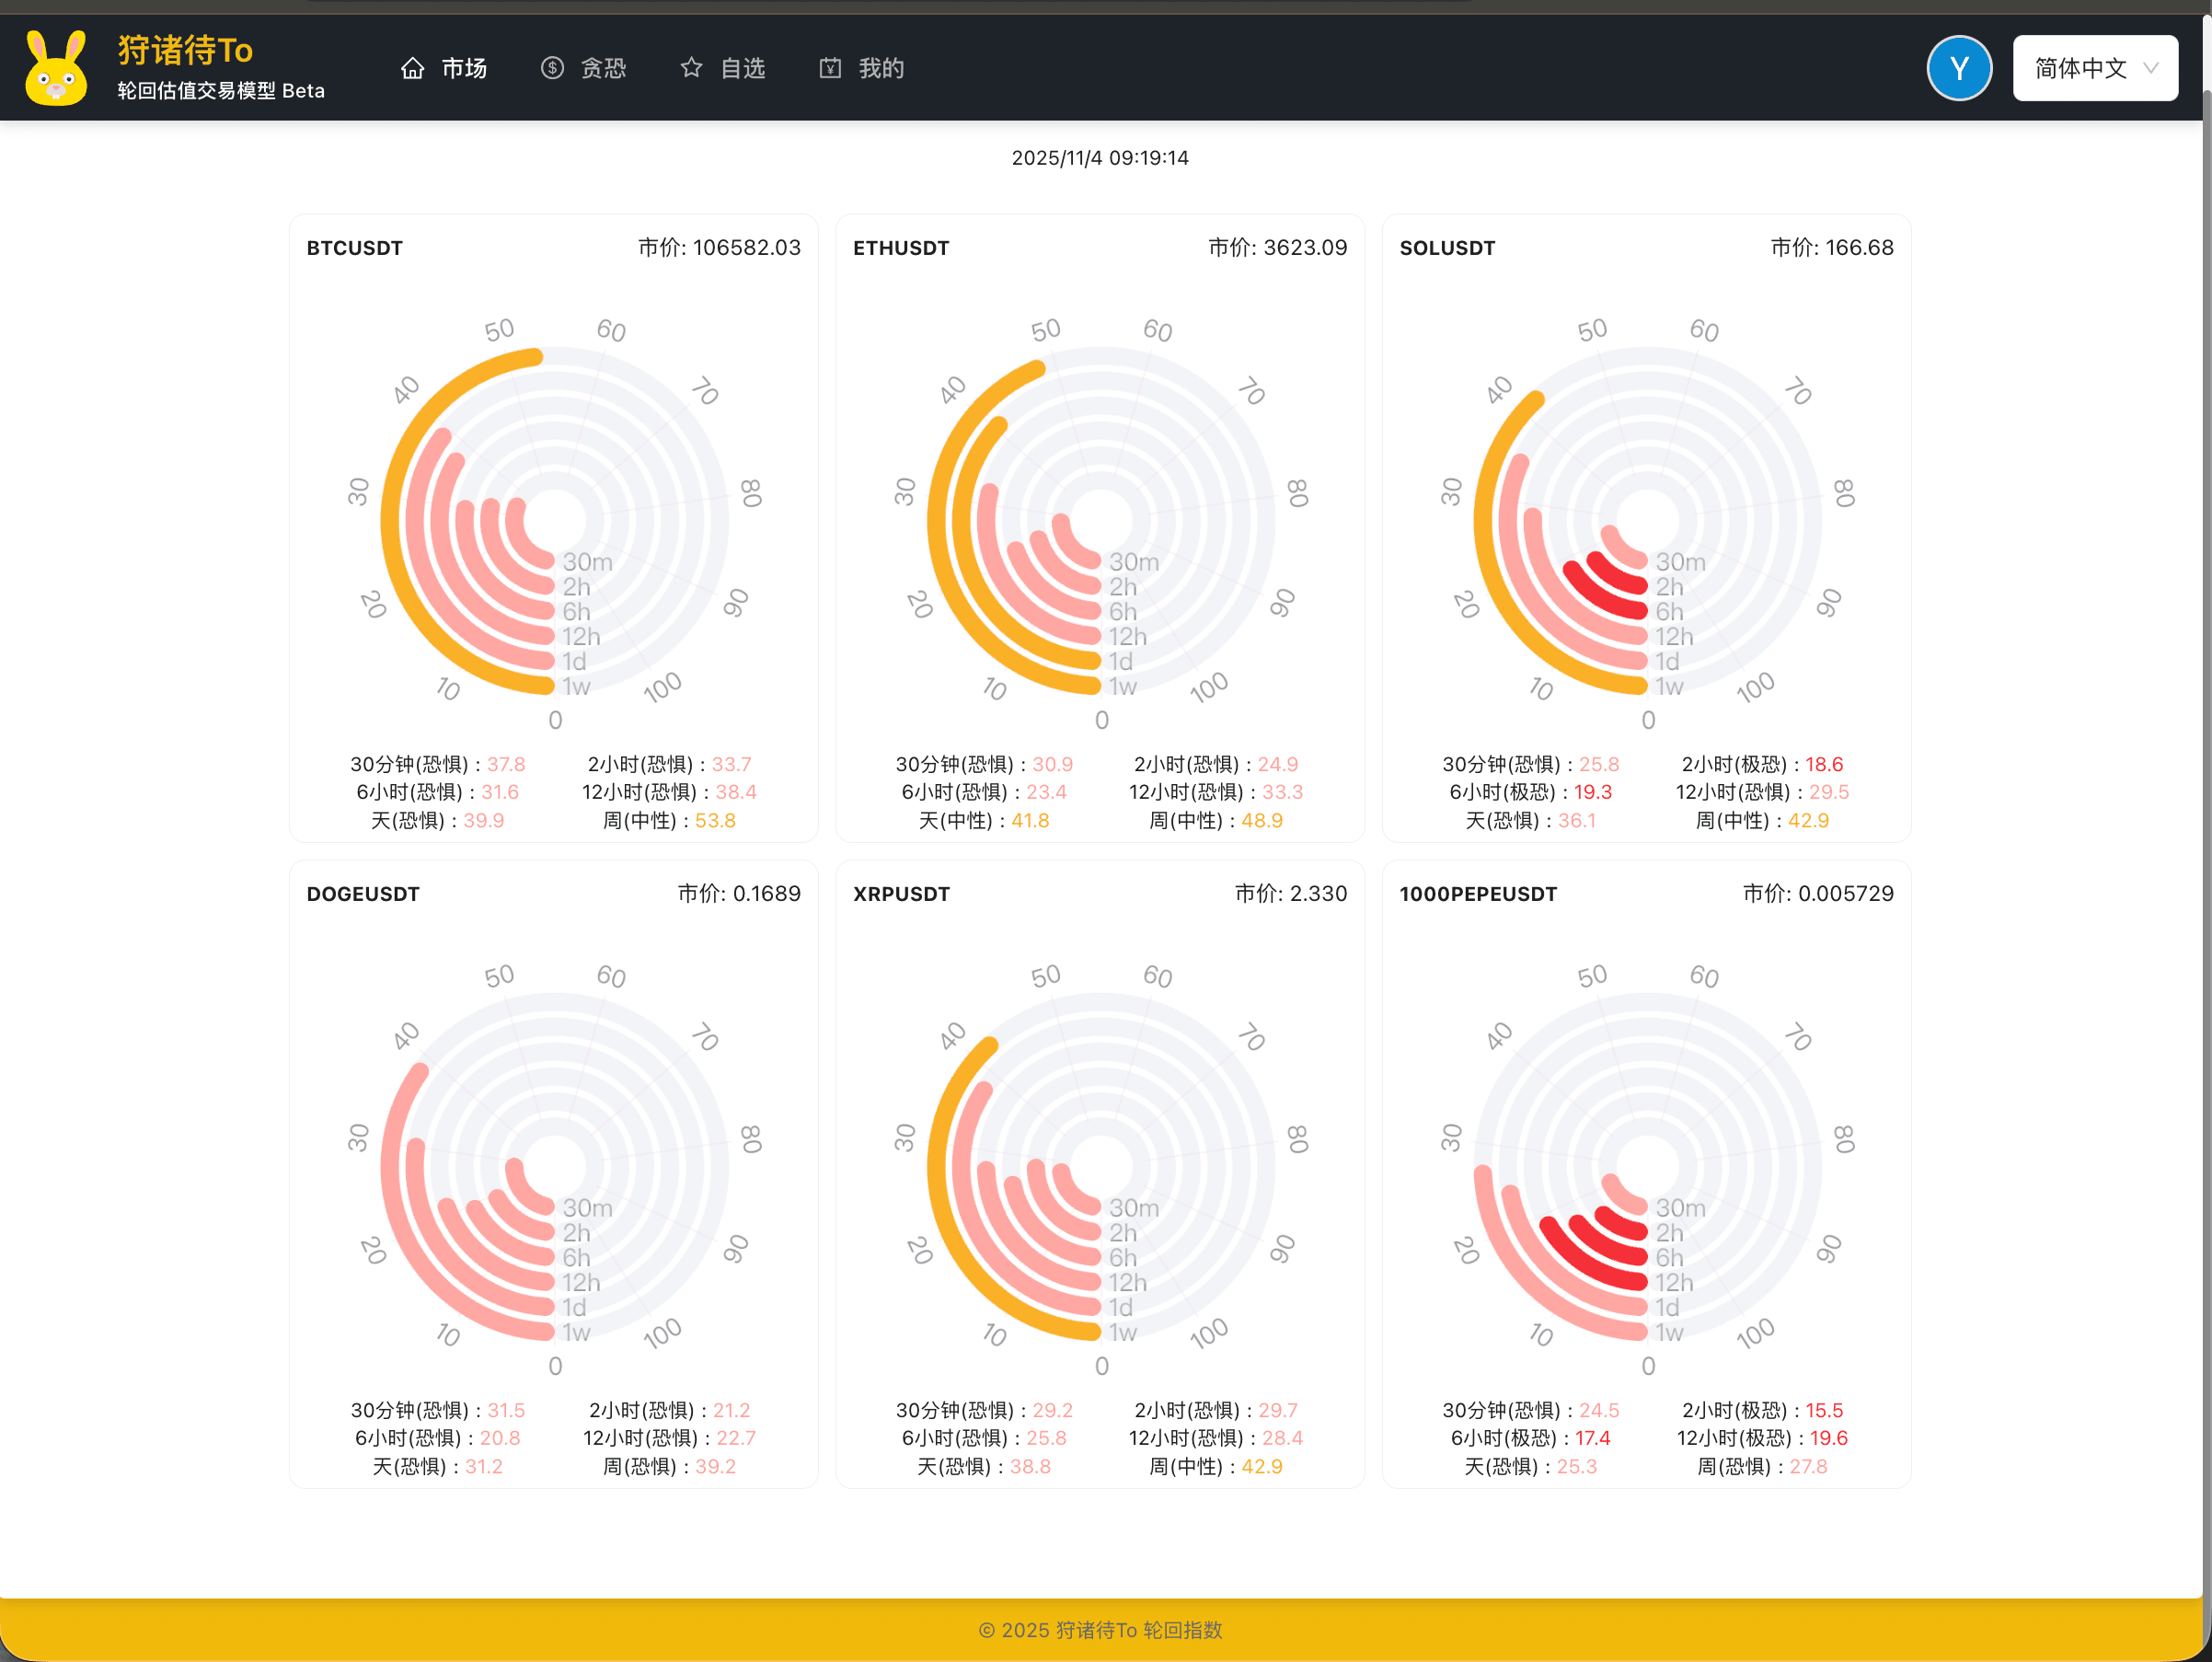
Regarding the control of the K-line cycle, there will be a corresponding greed-fear data for different cycles. For example, there is a 6-hour greed-fear data for the 6-hour cycle. My original consideration was about the difference between short-term and long-term trading. If you like to trade short-term, then the K-line of short cycles will calculate the greed-fear data under this cycle dimension. However, based on backtest data, long-term trading appears to be more stable and offers stronger profit guarantees. Short-term trading generally chooses leverage, but currently, the backtest part has not handled leverage logic, so this may be the reason for the unsatisfactory results in short-term backtesting.
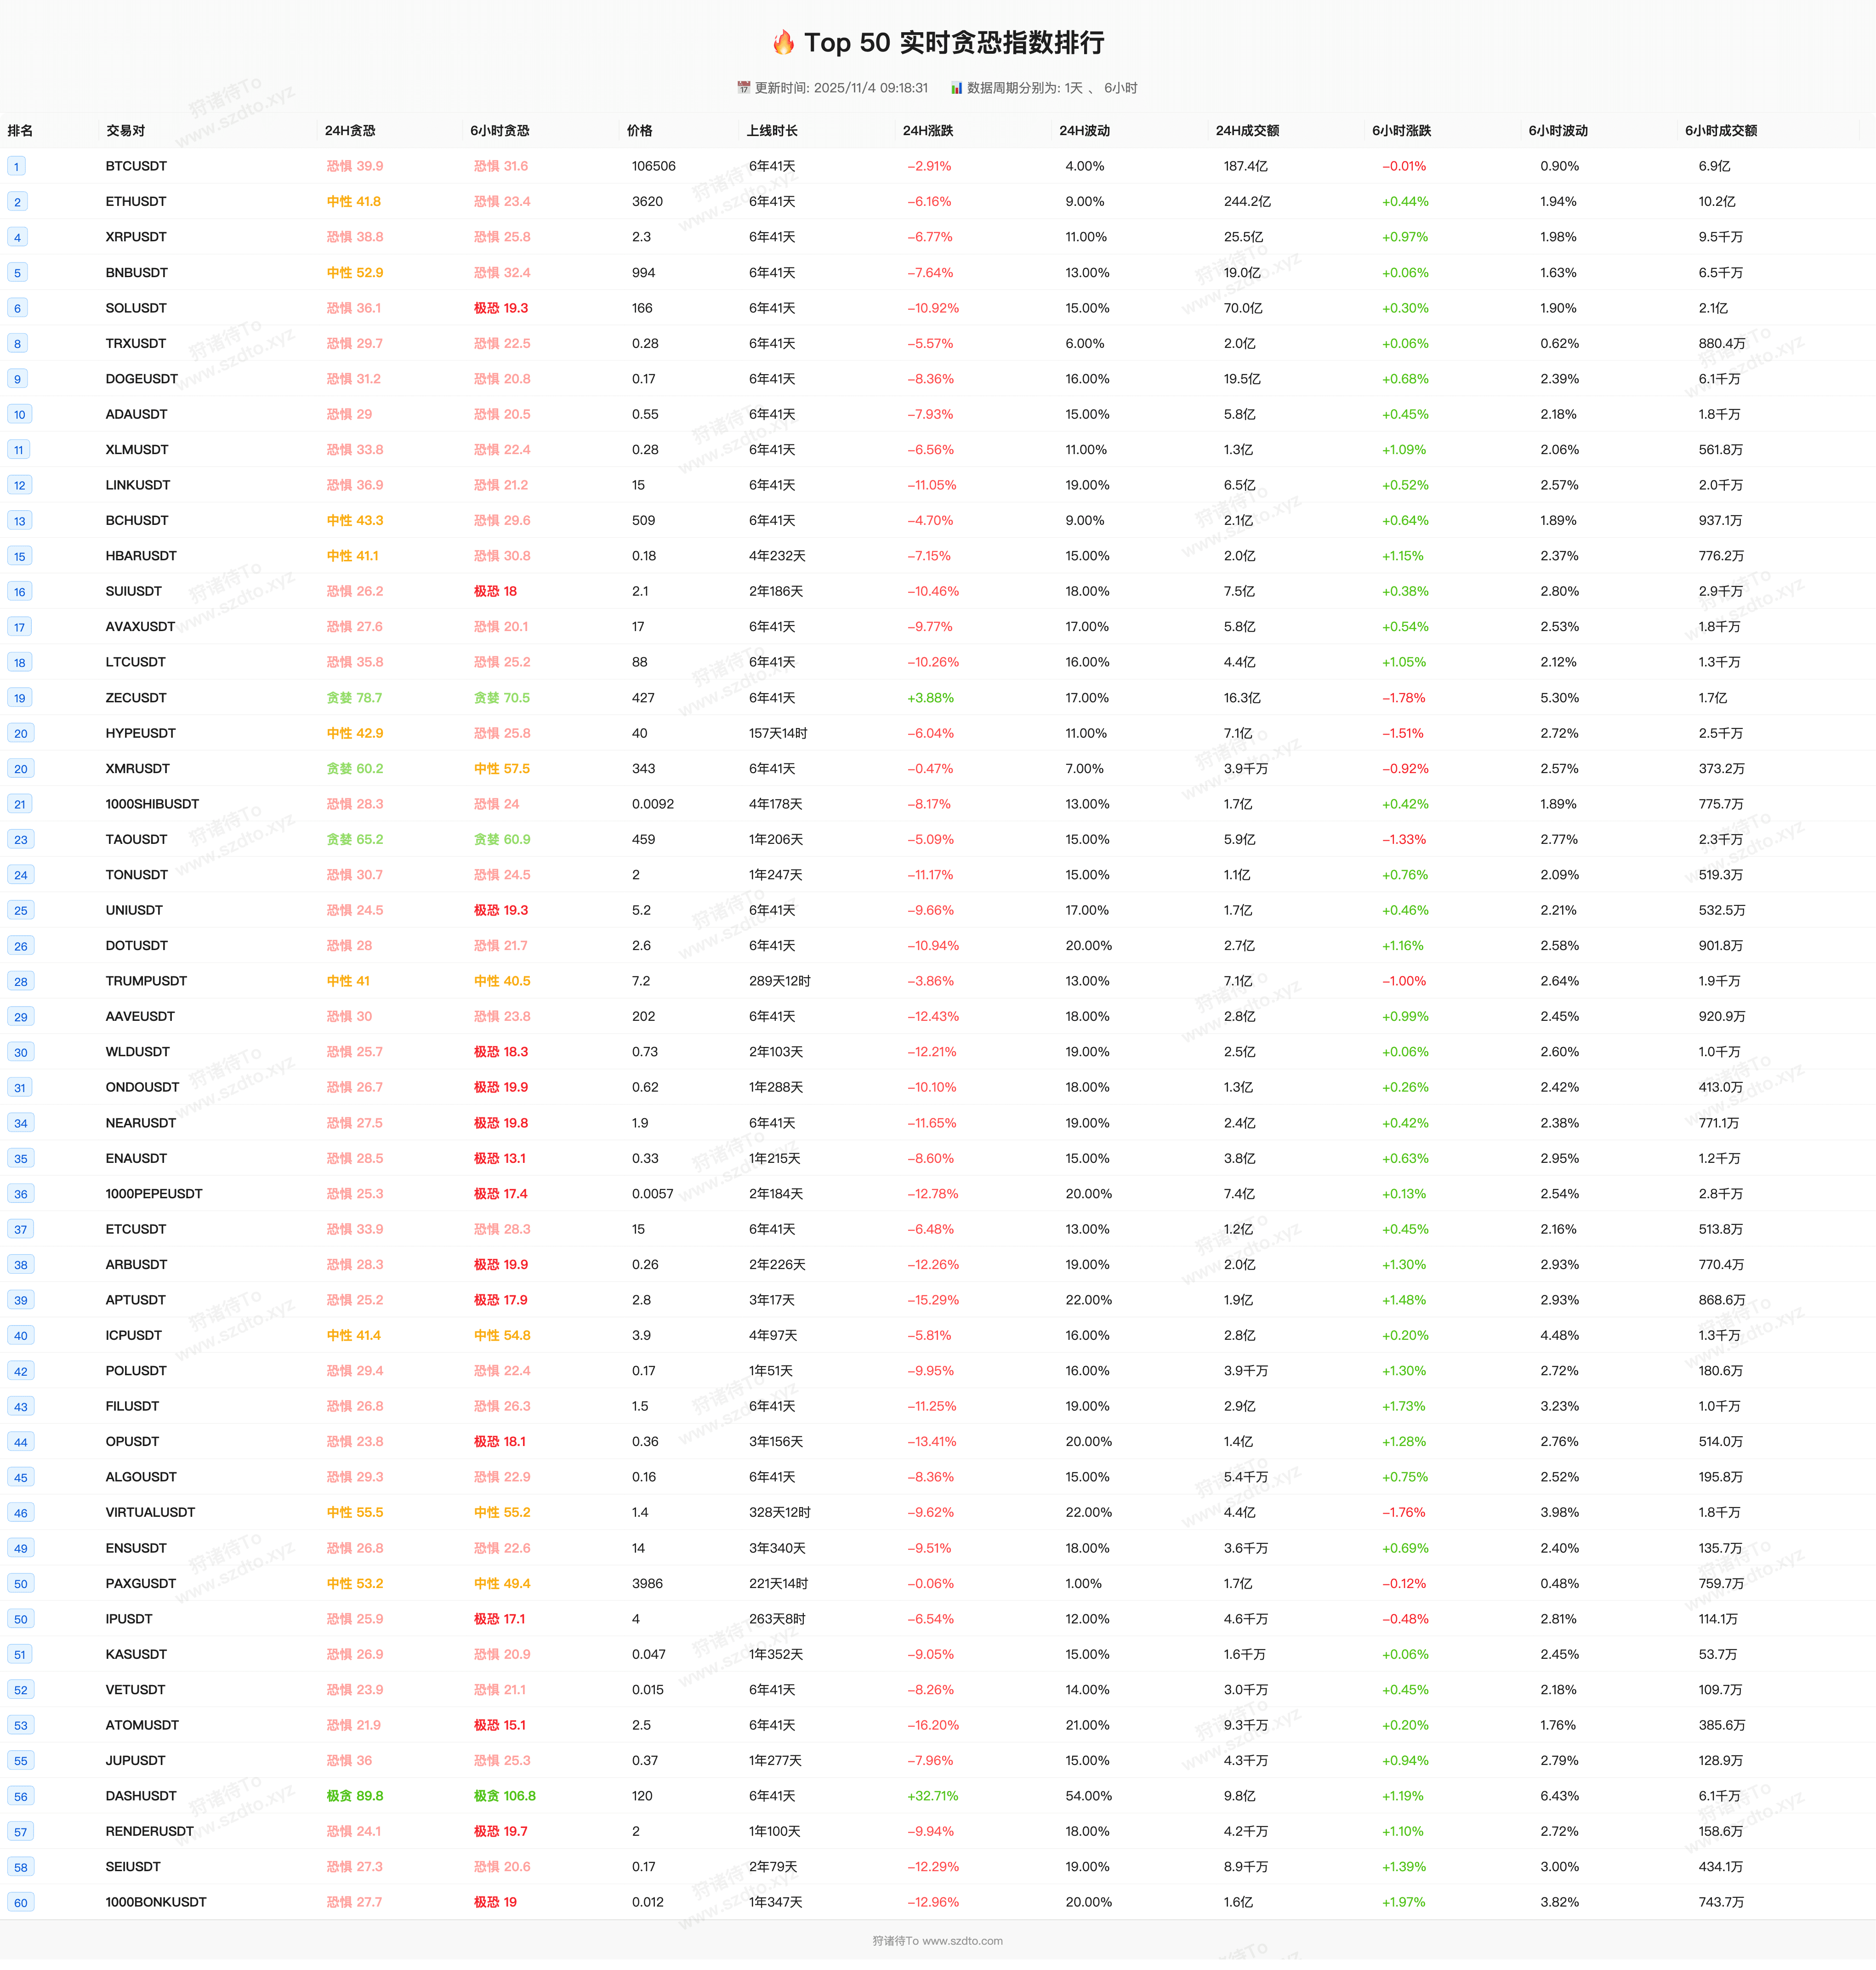
On the greed-fear list page, there are many data points that support sorting, and there are very many dimensions to look at. Its main function is to help you quickly find opportunities, for example, which coin has risen quickly, and now has increased volume, or which coin's greed-fear has reached a certain level. You can see the overall status at a glance, making it easier for you to make decisions. However, you must remember that indicators are only for your assistance. If everything is making money, then it’s the God of Wealth.
Real-time fear index - Issue 118
The greed-fear index is independently calculated based on the market data provided by the official source (Binance public API).
The fear-greed index ranges from 0 to 100. In extreme cases, it can be below 0 or above 100.
😆😆 If the greed and fear index is greater than or equal to 75, consider selling.
🥶🥶 If the greed and fear index is less than or equal to 25, consider buying.
Easily judge when to buy and when to sell. No longer troubled by this.
History always repeats itself. Master the rules; simplicity is the ultimate sophistication.
Is it valid? You can view historical backtest data. The historical greed and fear data for a single K-line will not change after it ends, so theoretically, there is no situation of a future function.
The only possible factors that could influence the current greed-fear situation include: you are a whale, and you are manipulating a low market cap, illiquid coin. In that case, this K-line is controlled by you, and the current greed-fear is in your hands.
However, for large market cap coins with very high liquidity, like BTC and ETH, ordinary people cannot change the future greed value, unless you all act in unison, then that would be incredibly powerful.