I will teach the concepts related to ICT one by one in this column
Ultimately, it helps everyone piece together a more complete ICT trading strategy
Today we are going to talk about the liquidity of buyers and sellers
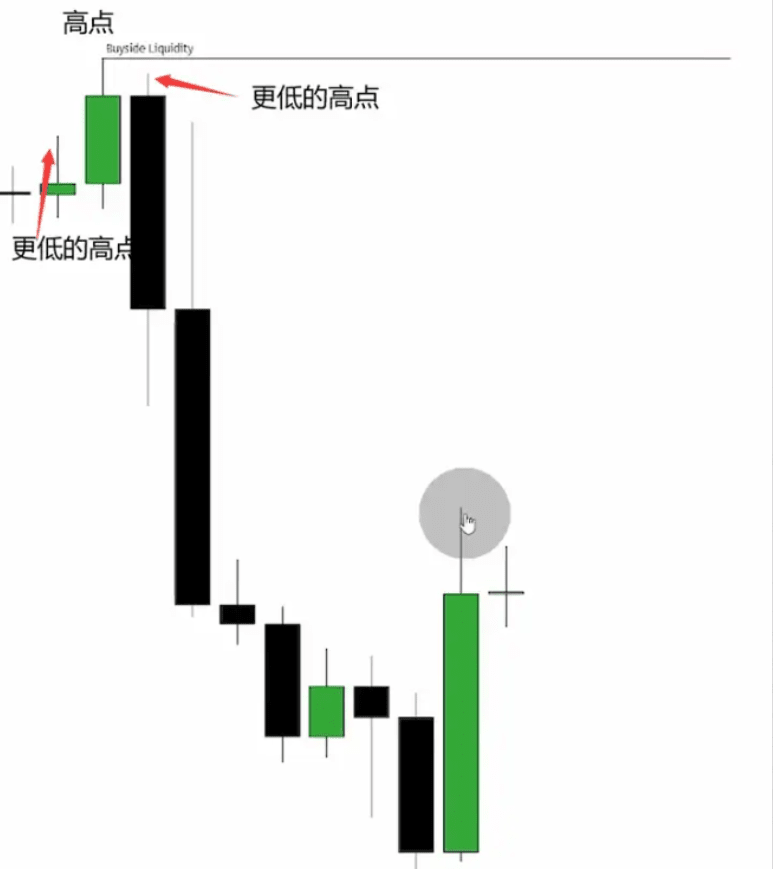
Before we start teaching, I need everyone to know what swing points are in the market
This is the basis for determining liquidity
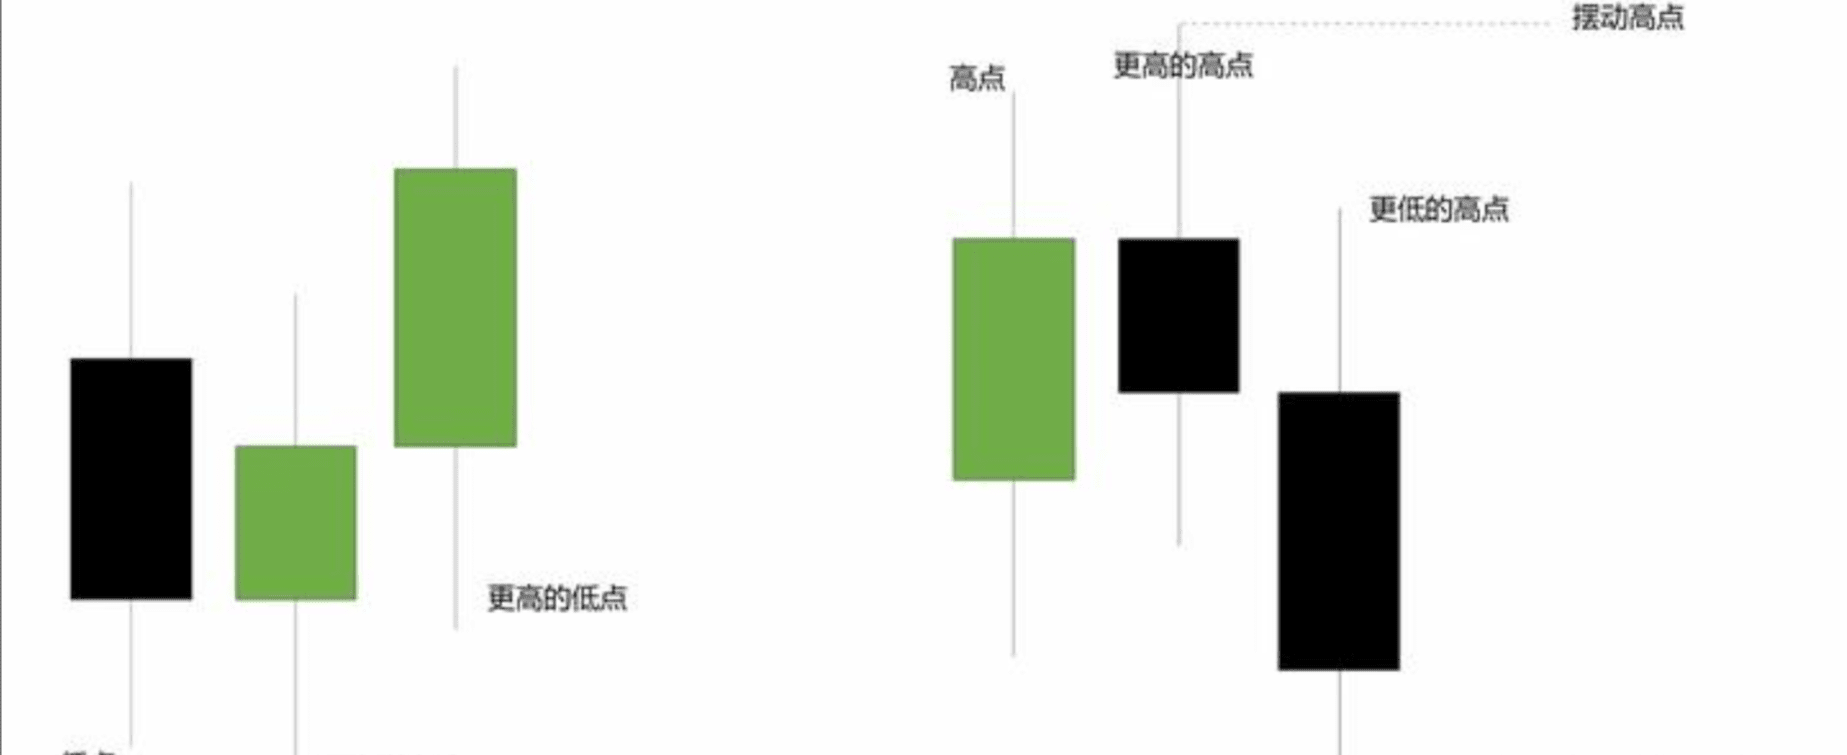
Why are the swing highs and lows important?
So we need to first understand the psychology of traders
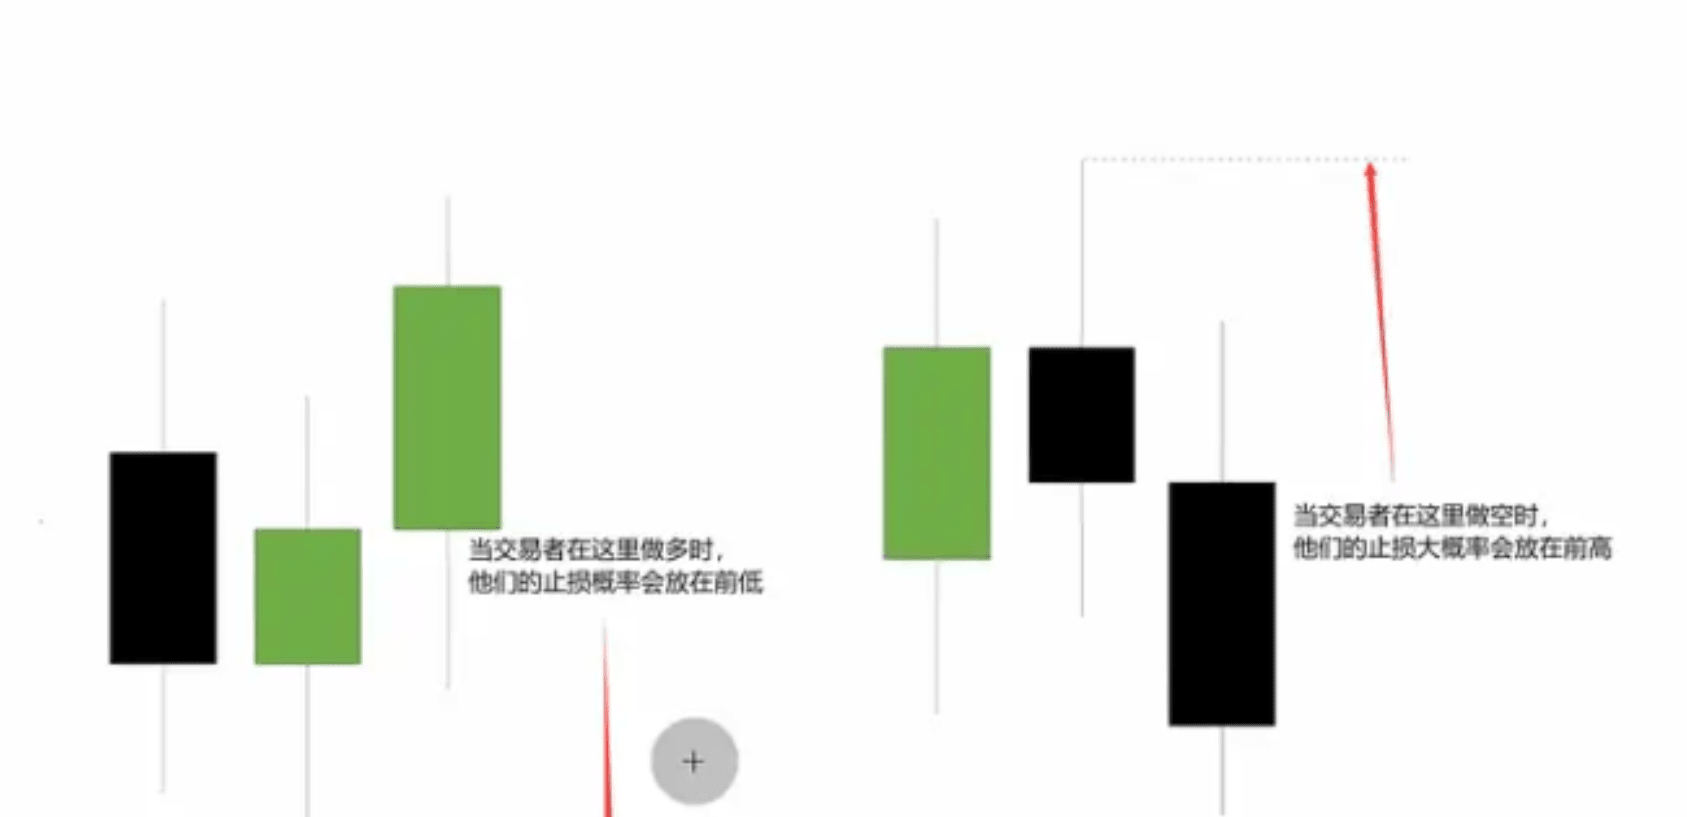
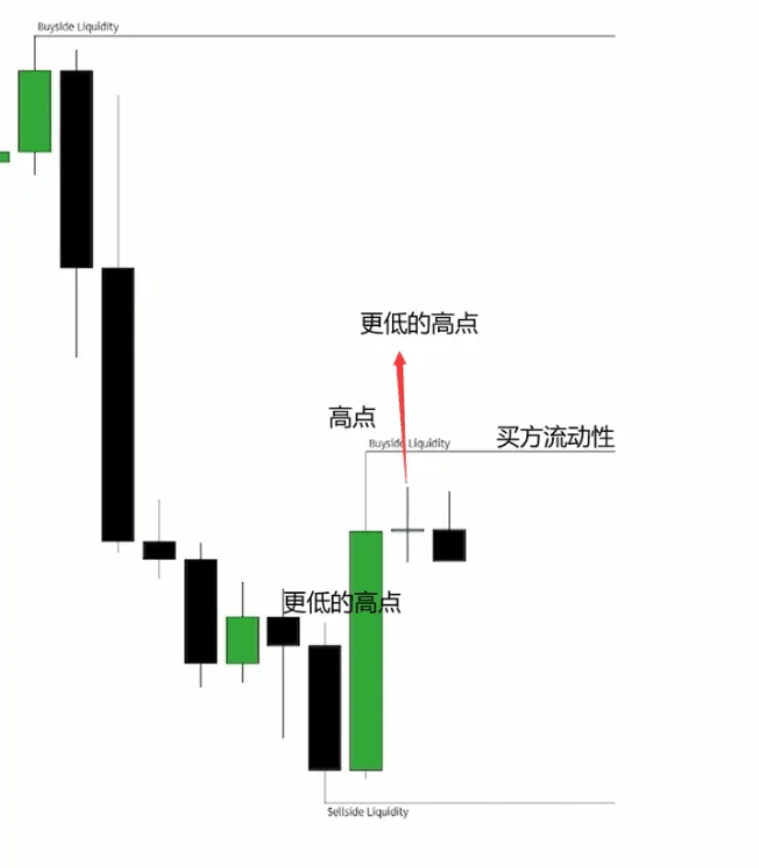
So at the two swing points, a large number of buy or sell orders will accumulate
In the first case, there are a lot of sell orders accumulated, in the second case, conversely, buy orders are accumulated
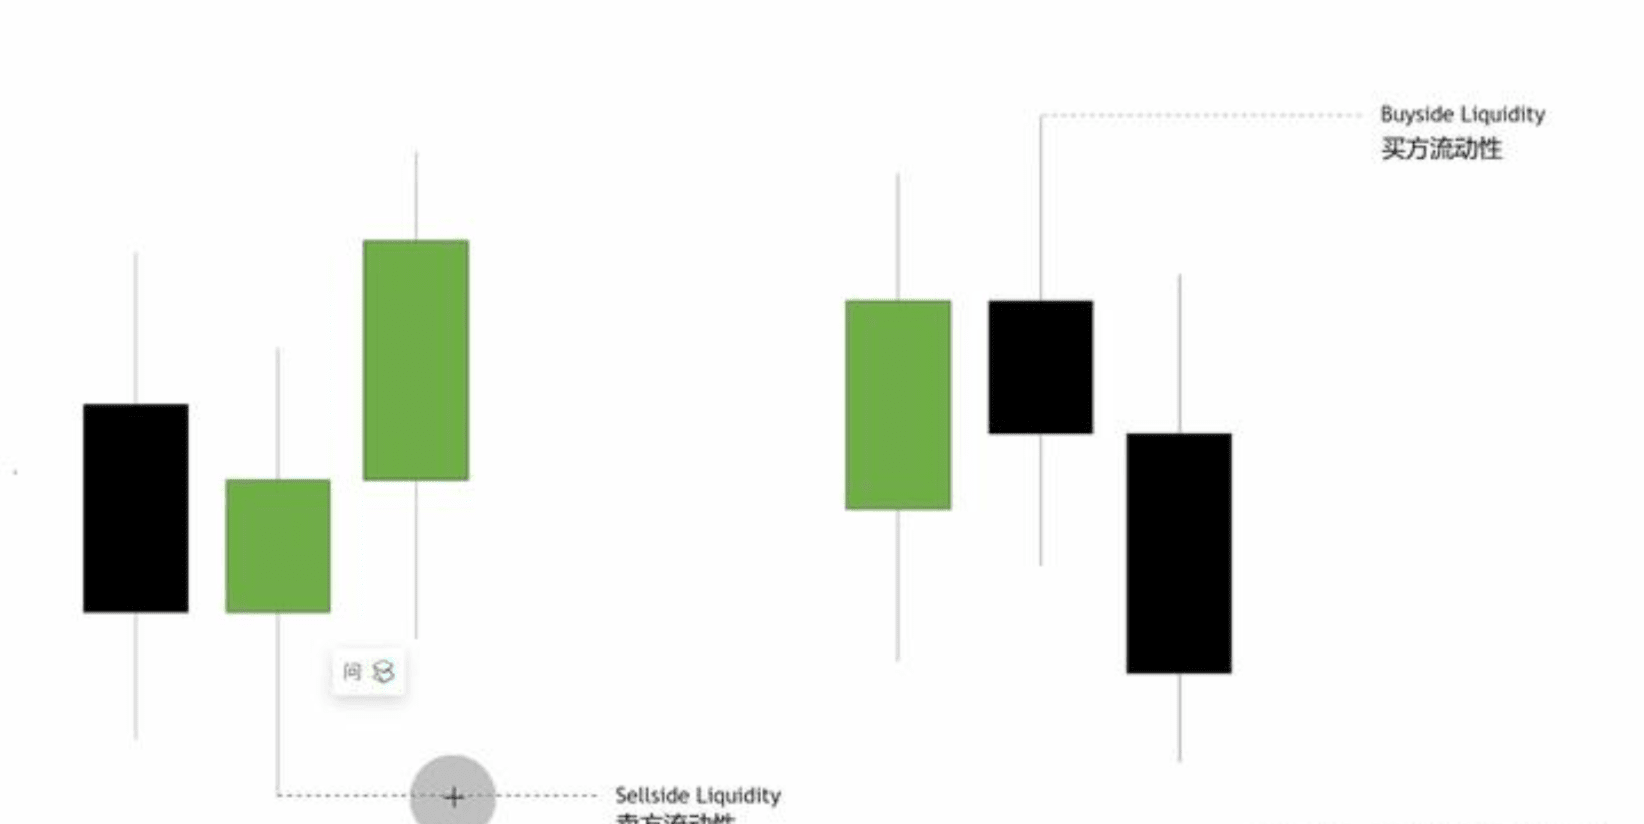
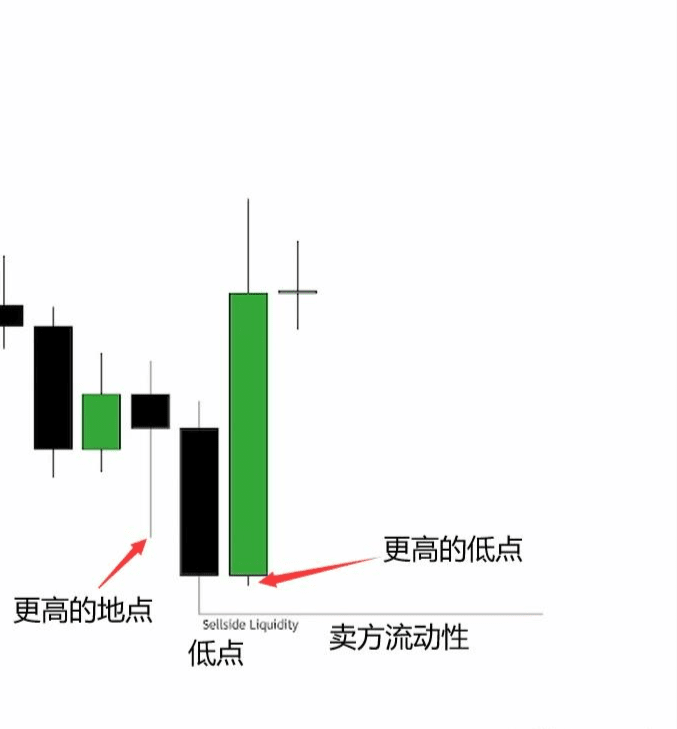
Our ICT goal is to trade in areas below these low points or outside these high points.
Now let's learn more deeply through some examples.
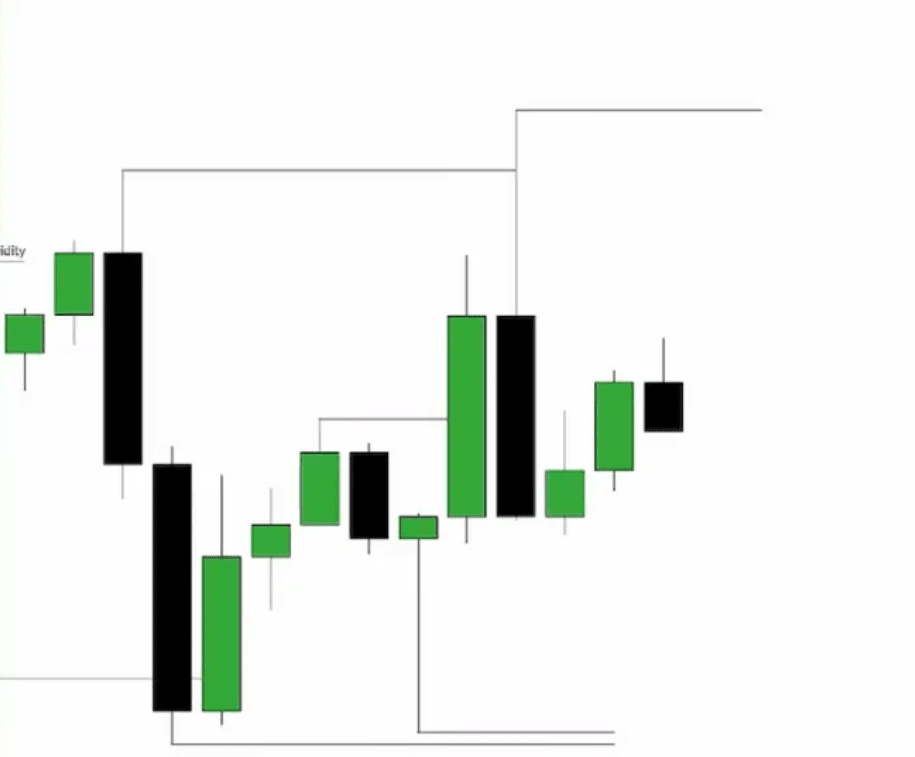
It is not hard to see that there are actually many liquidity areas.
Marking them all on the chart would be very messy.
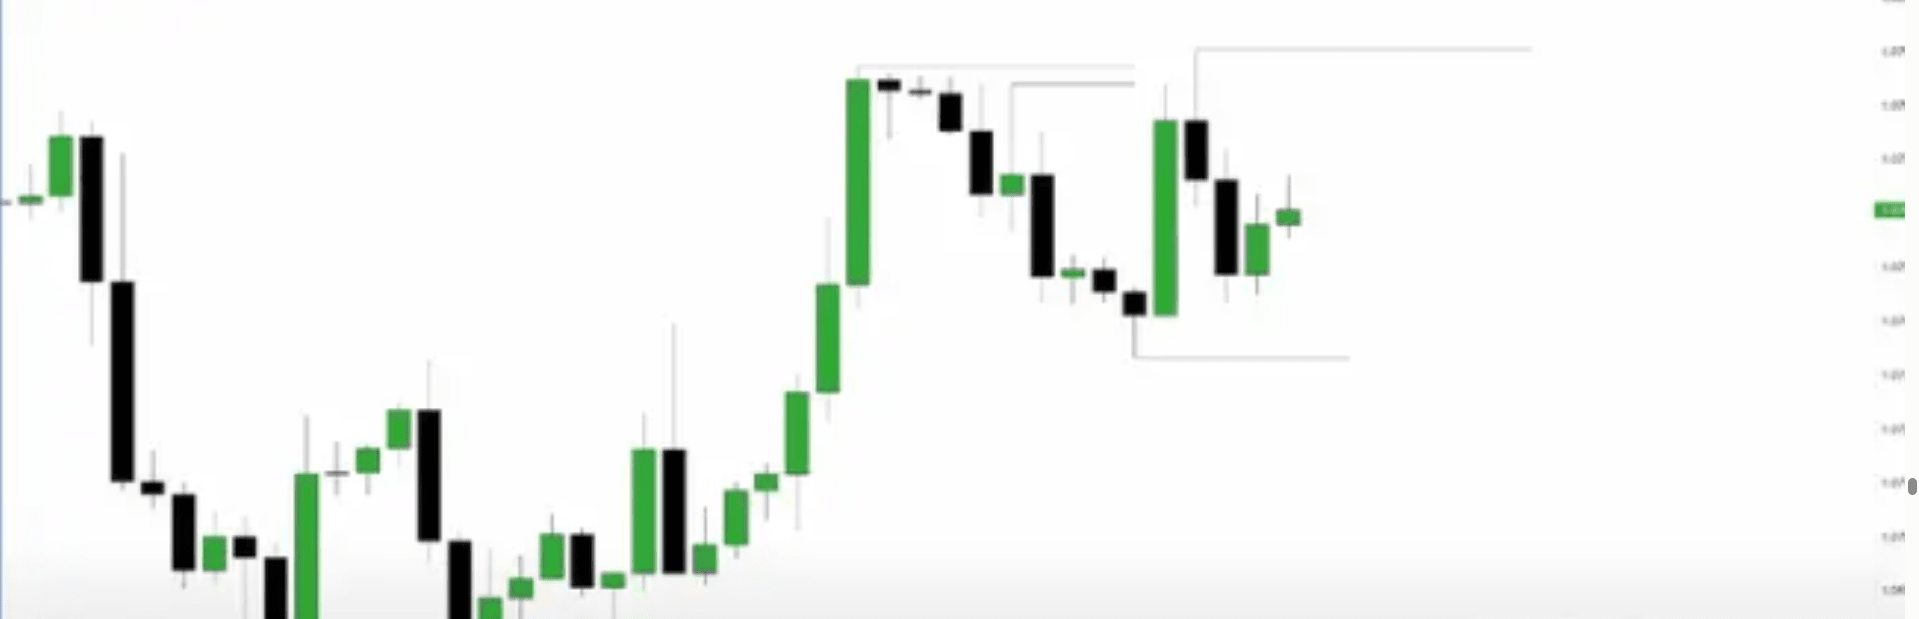
Here, I will write down some important liquidity areas that I generally mark in the chart.
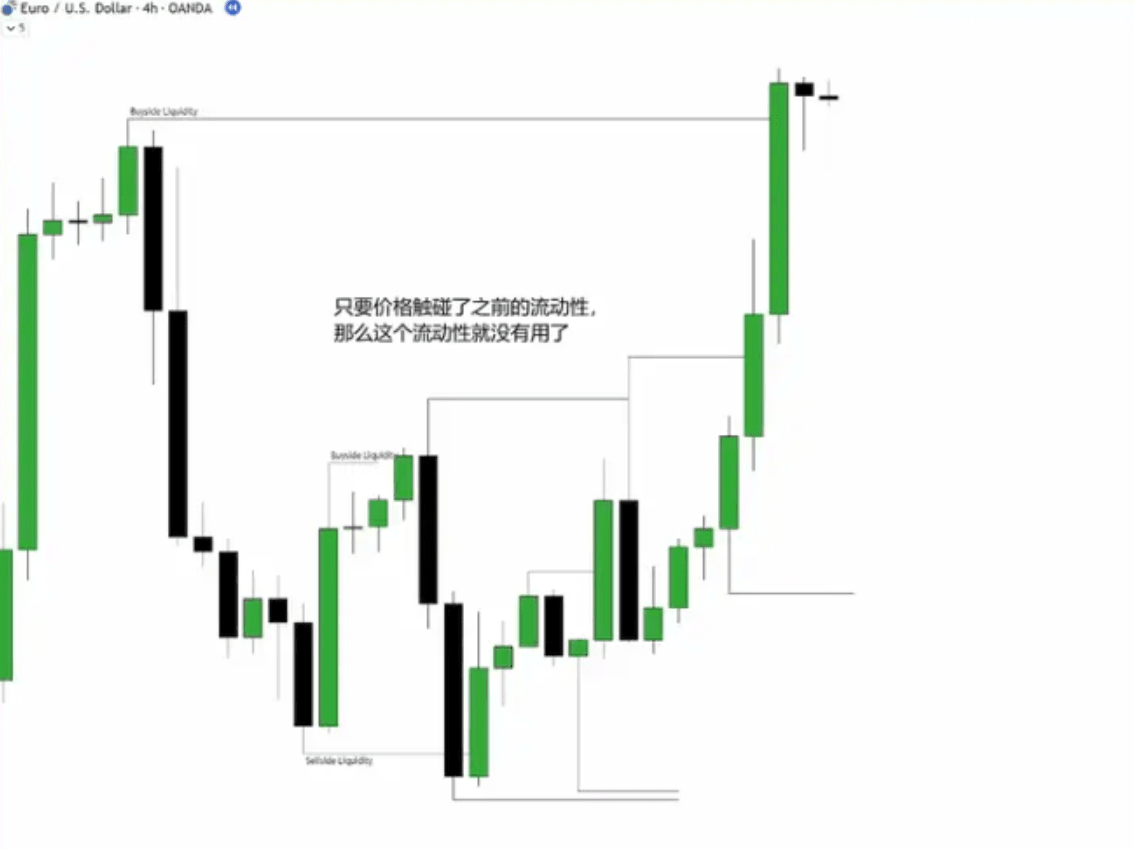
The first is the high and low points on the weekly chart.
Why is that?
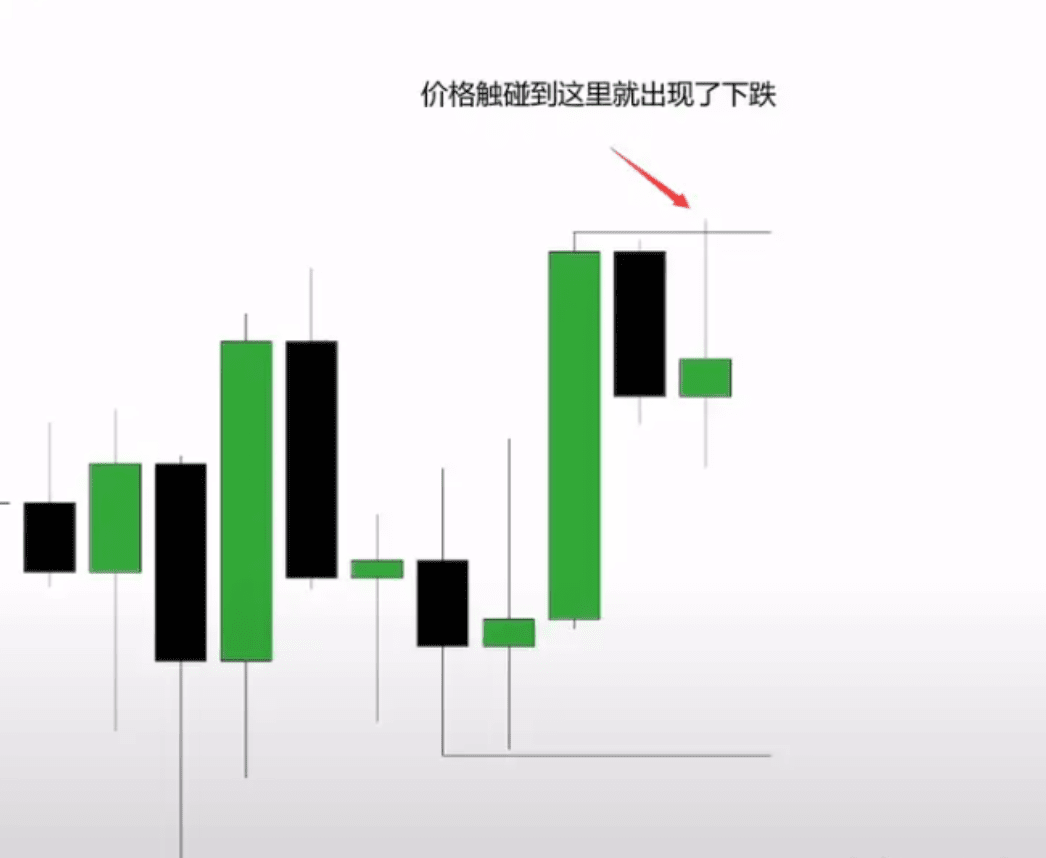
Because the liquidity area on the weekly chart is very likely to form reversals.
(In simple terms: the price goes up to here and then drops down, or the price drops to here and then goes back up.)
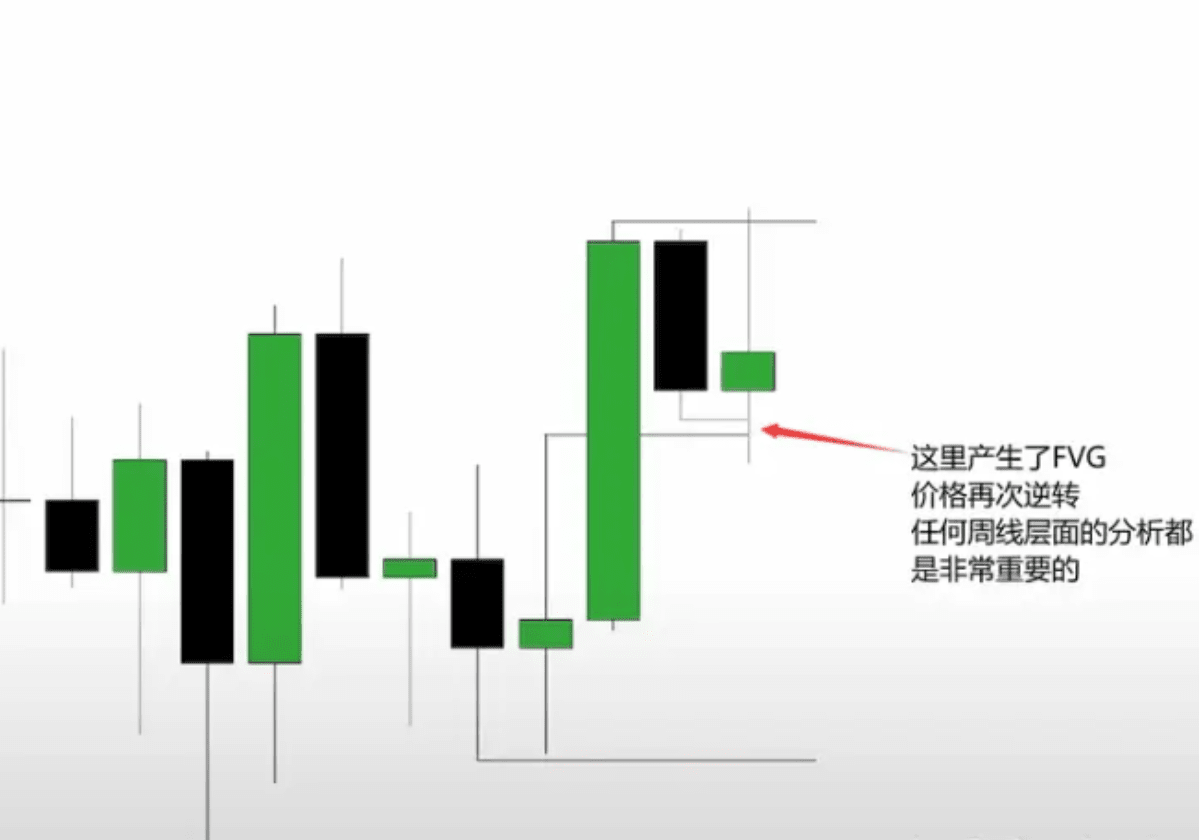
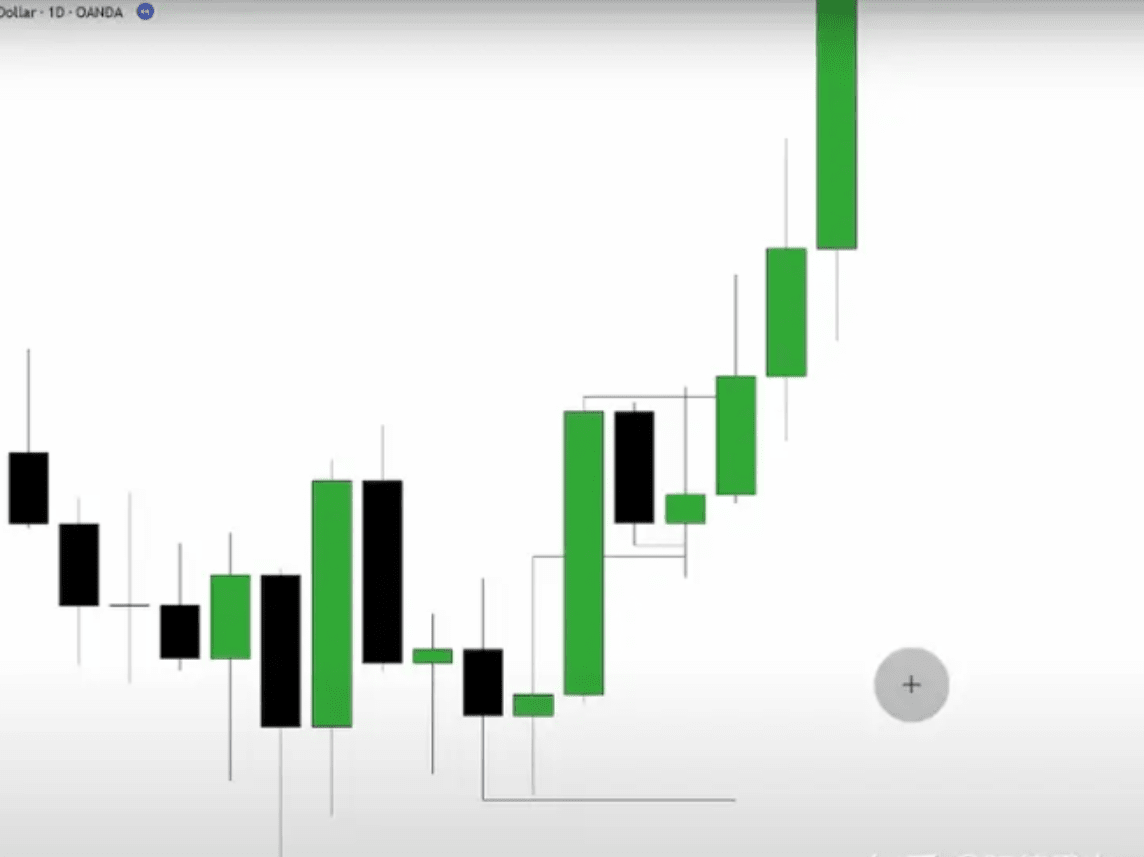
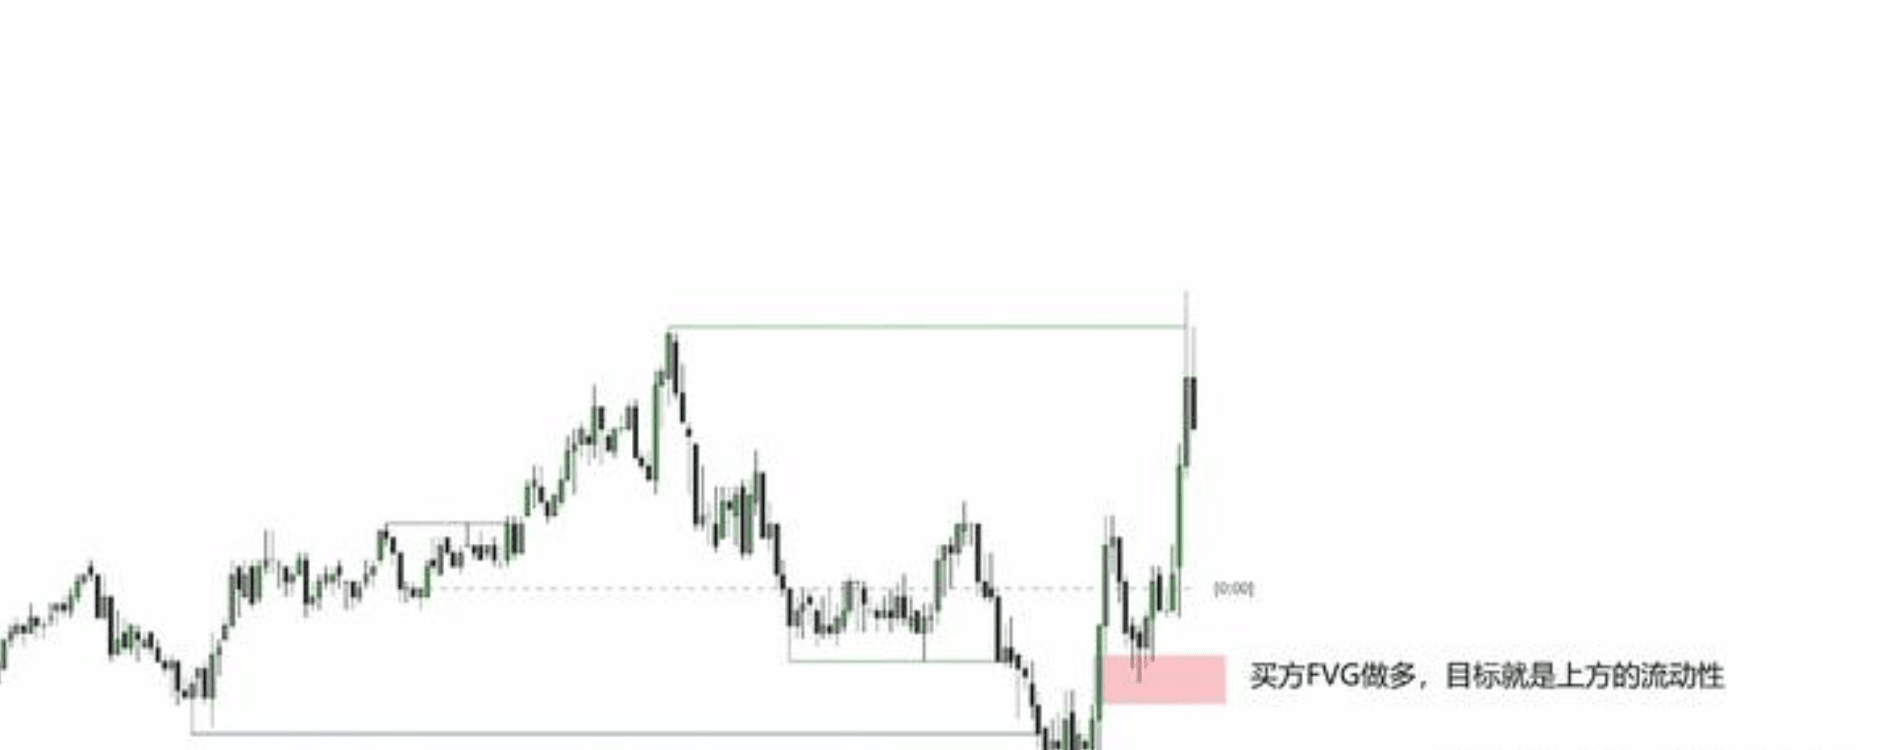
If you don't know what FVG is, then look at my previous content.
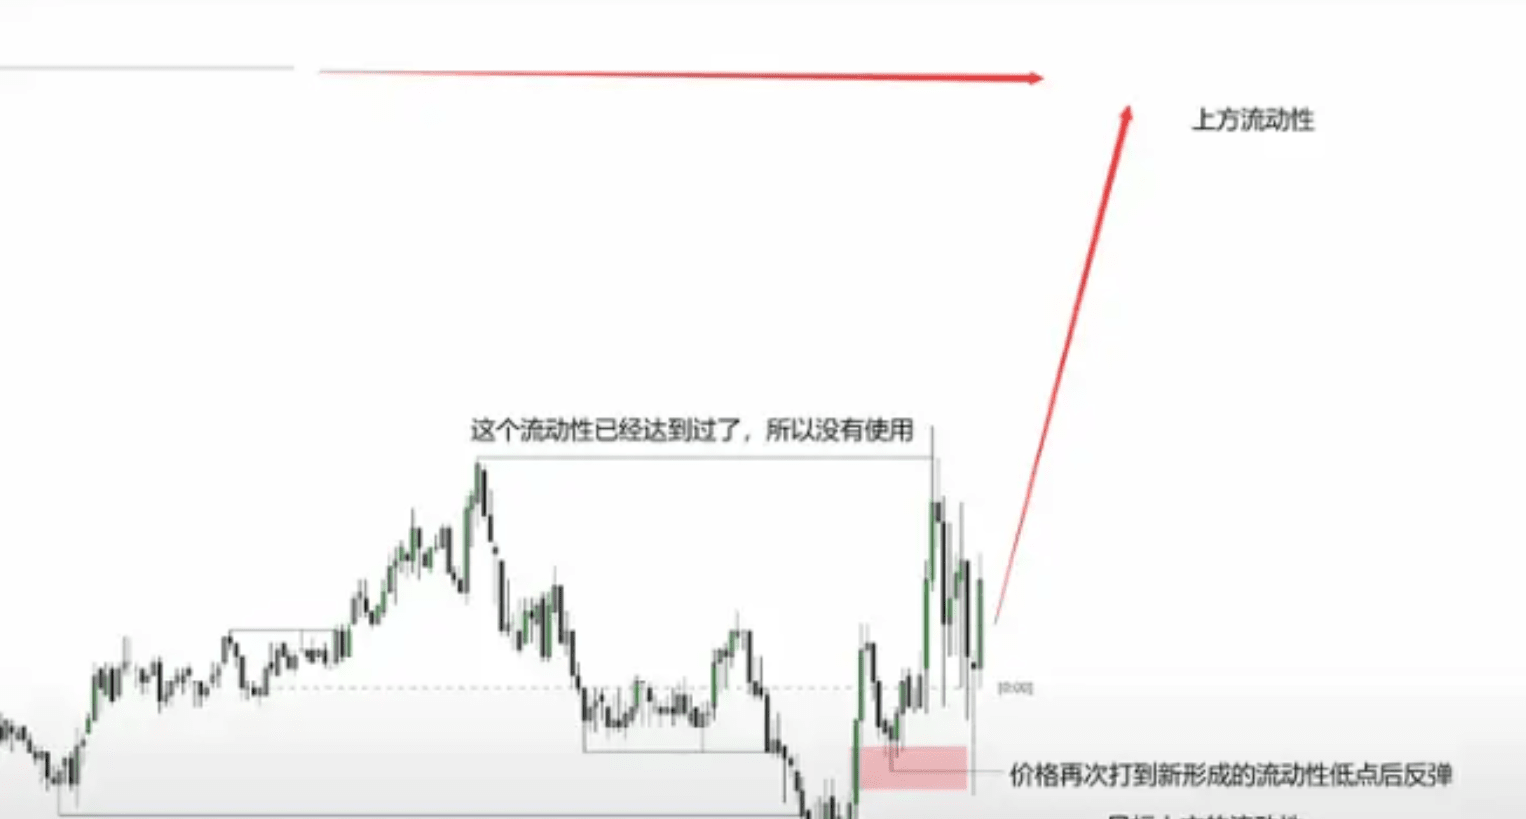
Then, since the previous liquidity has already been filled, along with the FVG support below, we have a relatively bullish situation.
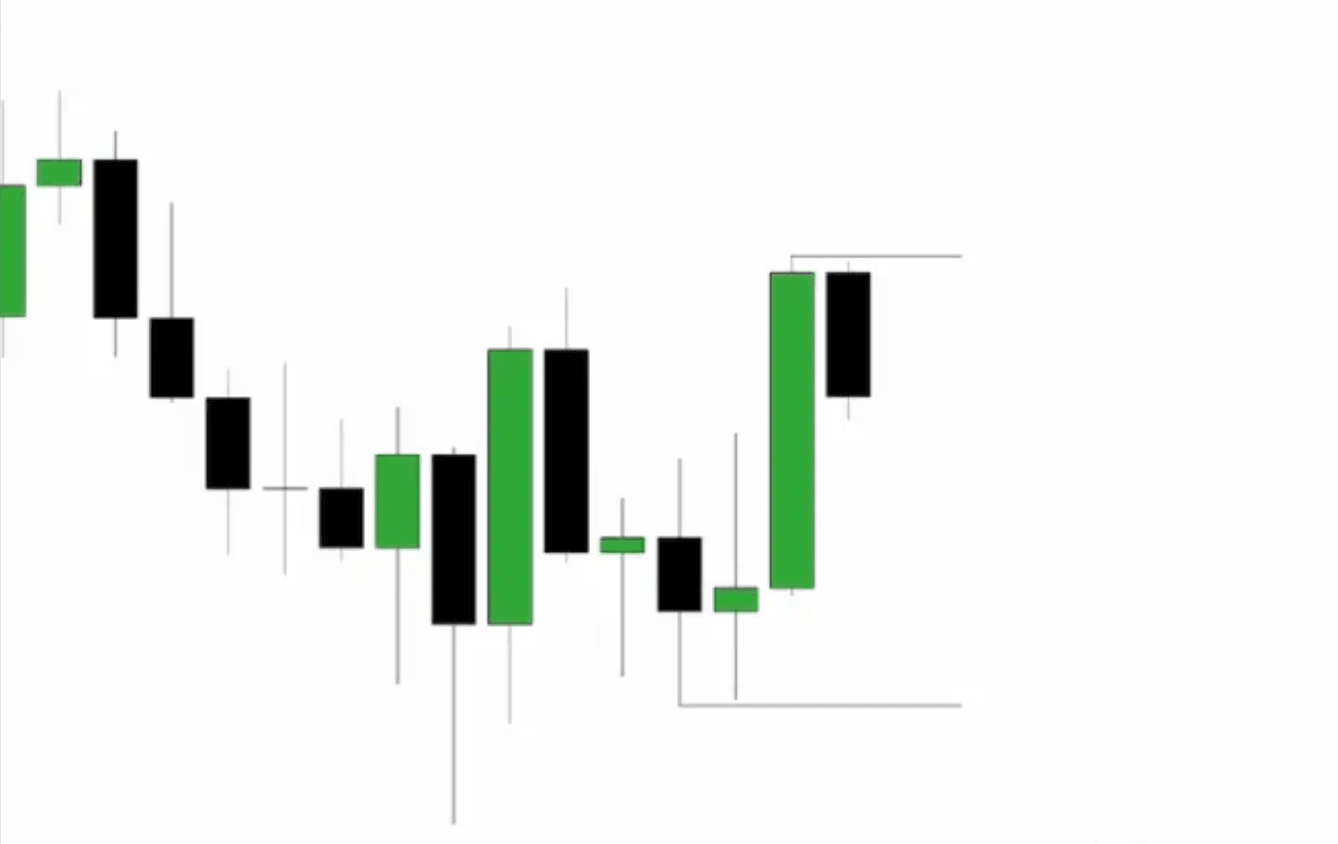
Next, it looks like this.
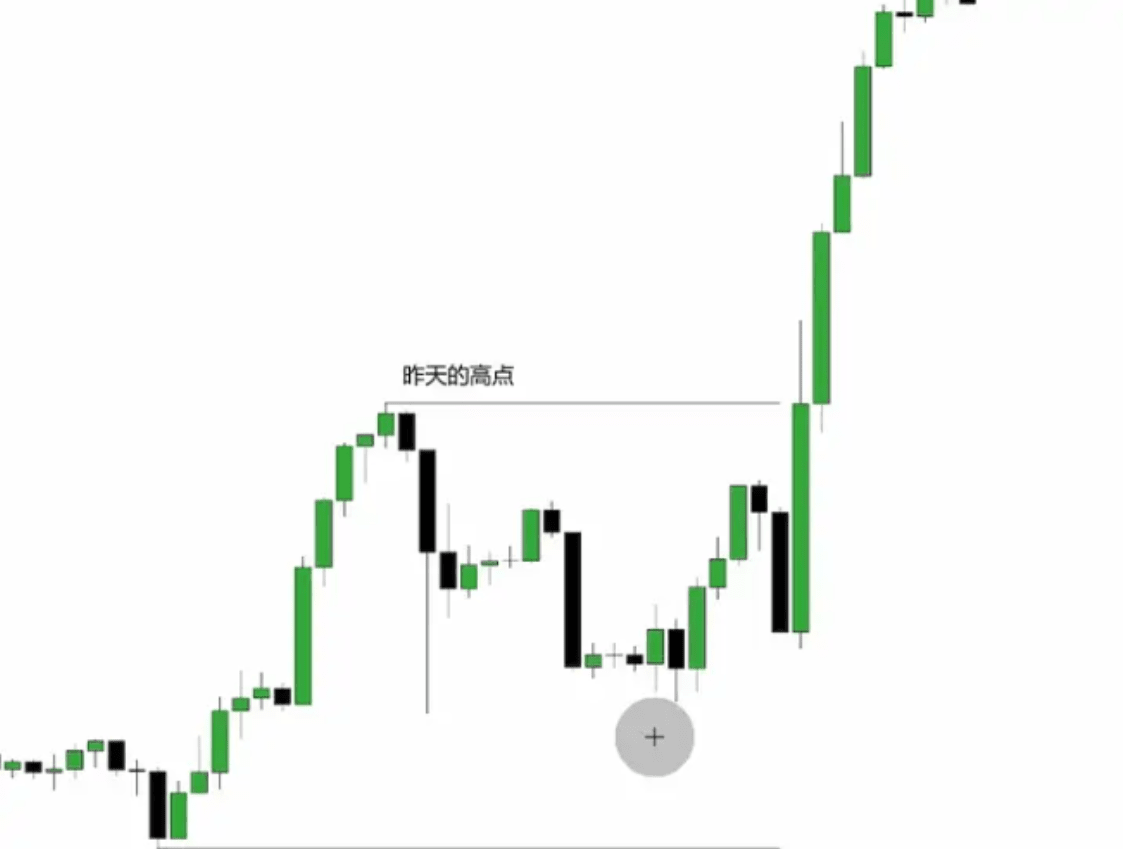
Another thing I will mark is the high and low points from the previous day as points for trend reversal or confirmation.
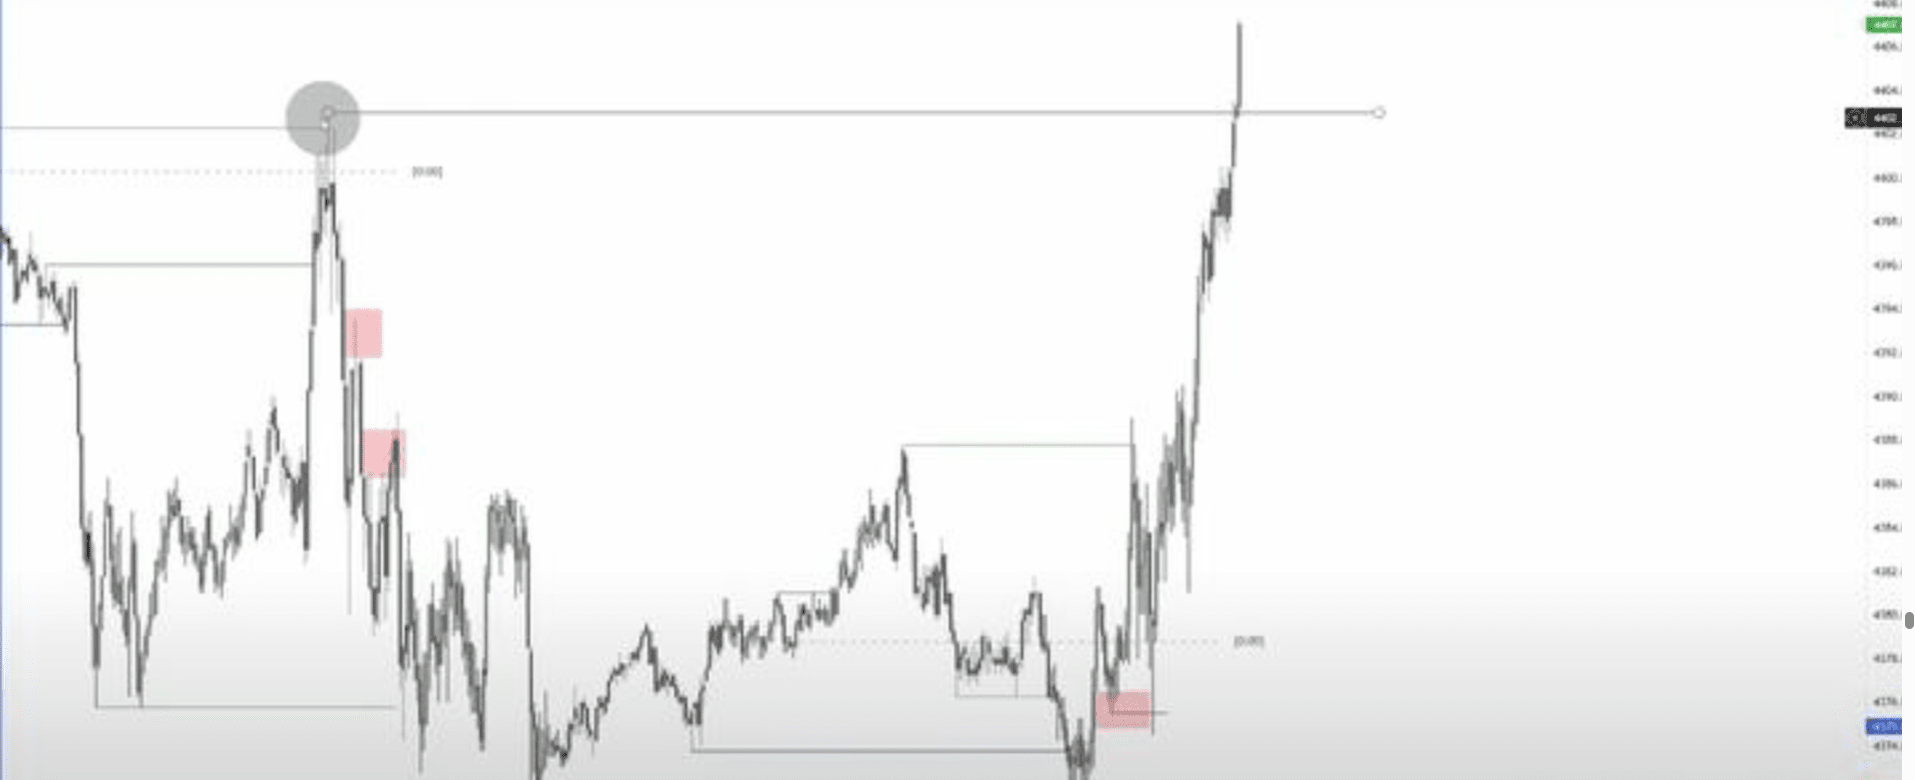
There is also something I will mark, which is the daily liquidity of each time zone.
For example, the high and low points in the Asian time zone, the high and low points in the London time zone, and the high and low points in New York time.
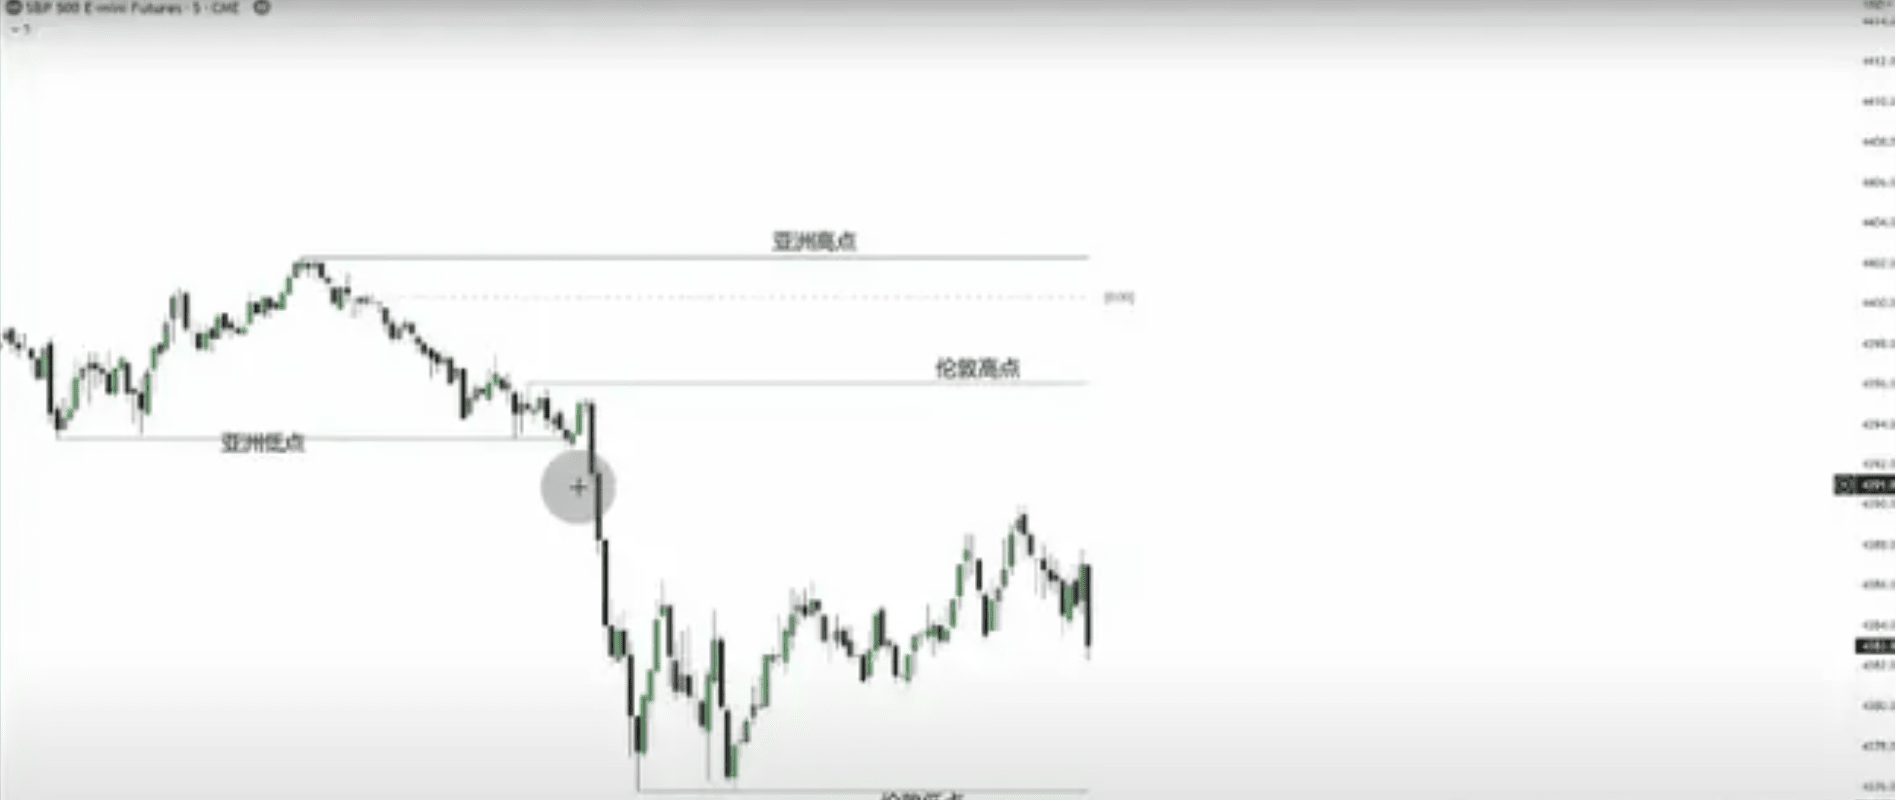
Currently, only the liquidity of the Asian low point has been filled; the other three have not.
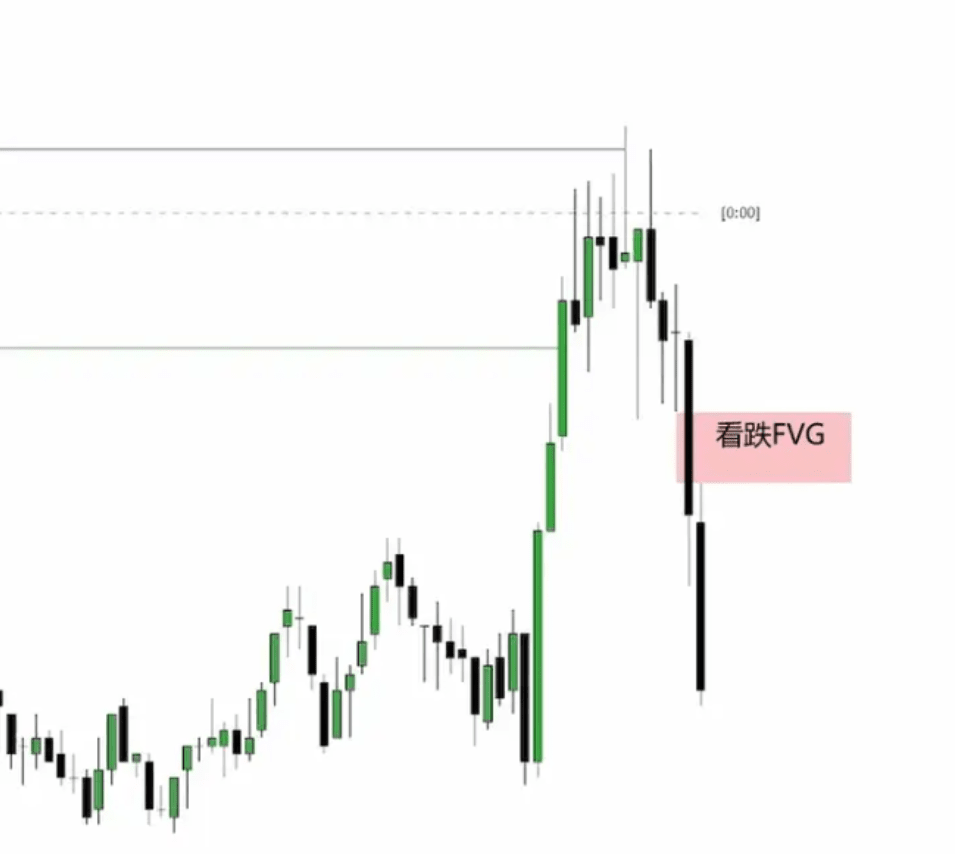
Then the price directly rose and filled the liquidity of two time zones, equivalent to reaching the resistance level, and immediately the price experienced a significant drop.
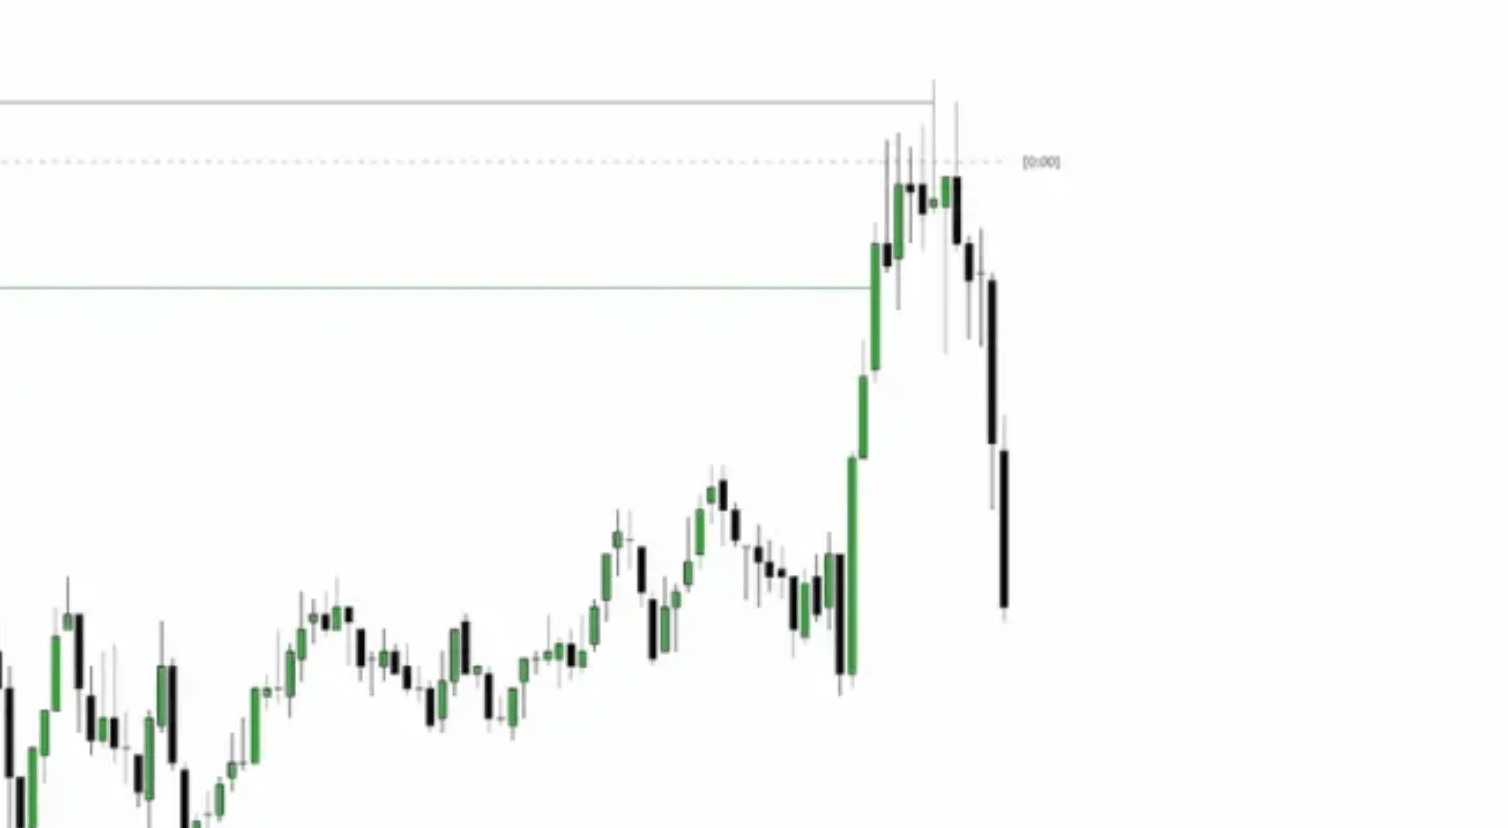
And it formed an FVG. Everyone can first look at the previous chart to find it themselves and practice.
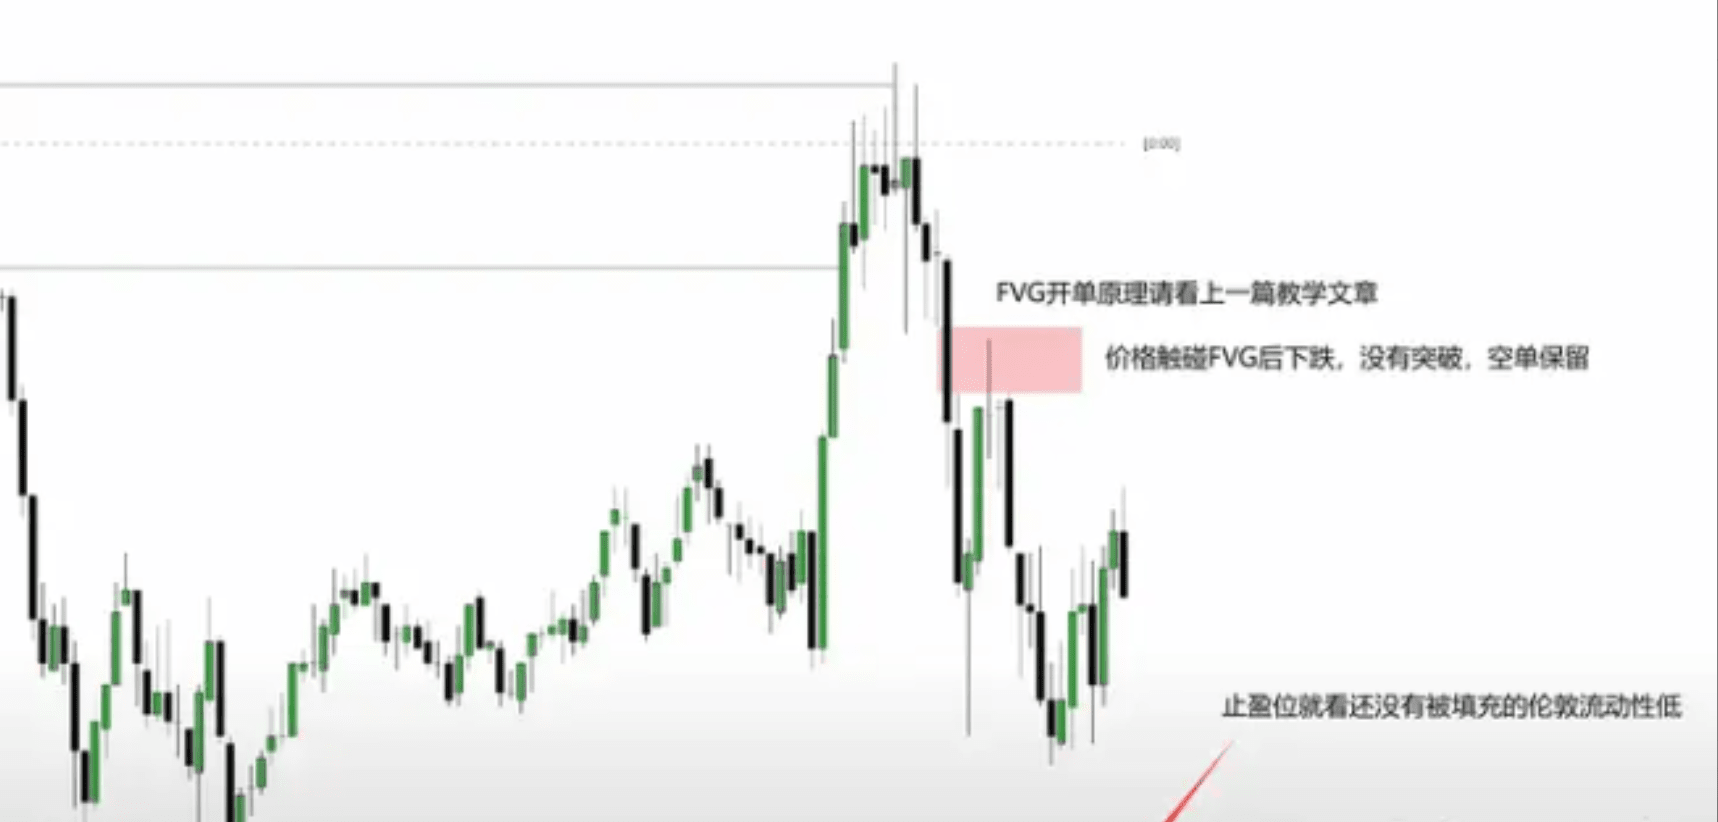
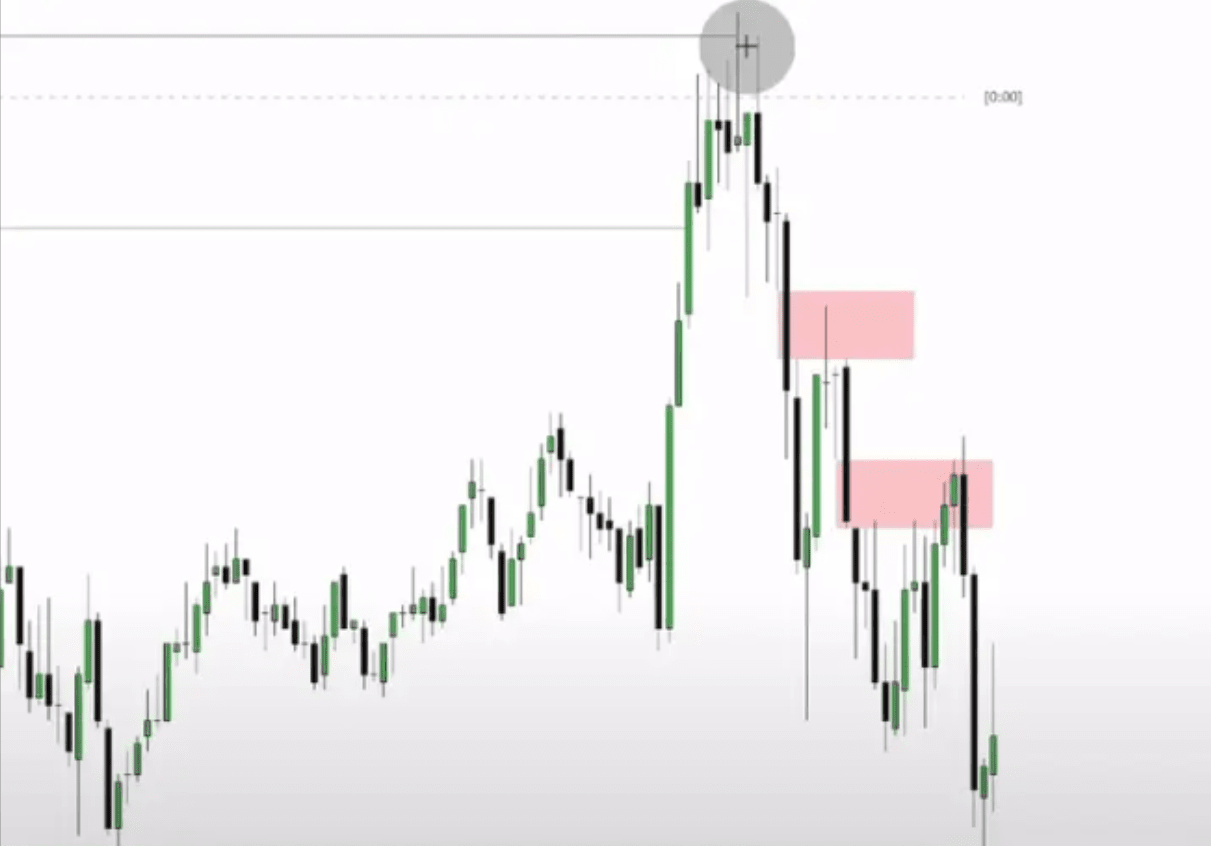
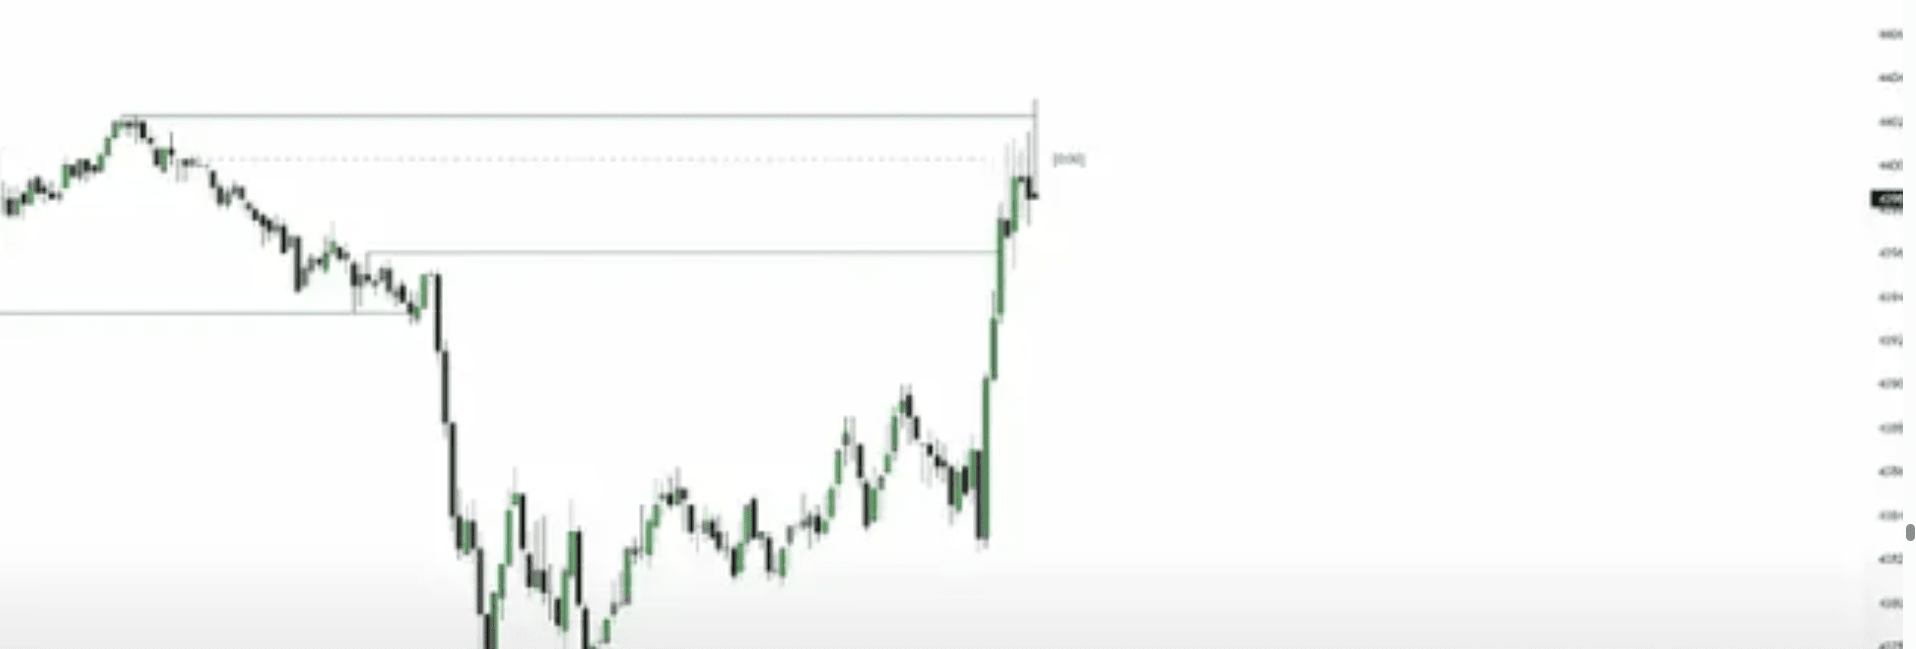
This trade is quite perfect; the price successfully touched the low liquidity point in London and took profit.
Then let's look at the next one.
Finally, the price also successfully reached the high liquidity point.
Ok, today's lesson ends here.
ICT has never relied on a single concept for trading. I do not hope for you to arbitrarily use any single concept for analysis. Under any circumstances, it must be used in combination, just like this time we use FVG in combination with liquidity for trading.


