Once you grasp stock trading, life feels like an enlightenment! 15 years ago, when I first entered the stock market, like most retail investors, profits and losses seemed entirely dependent on luck, and I couldn't grasp the patterns. However, after spending several years in the market, through continuous learning and absorption, as well as guidance and sharing from mentors and seniors, I gradually began to understand and formed my own investment system!
After spending 15 years in the stock market, I went from an initial loss of over 1 million to now gaining 27 million! Through countless losses and profits, I have summarized nine iron rules, and thus bid farewell to the fate of being a retail investor. These are practical tips for trading stocks to support a family, shared with those who are destined to receive them.
1. Respect the market; do not think you can easily take something from it. The returns obtained from the market are the accumulation and realization of one's own understanding, and the market always has an unknown aspect. No matter what method, there will be a day it fails. In times of success, maintain humility and continue learning; in times of failure, face the market's trials and reflect.
2. Go with the trend. 'Trend' refers to the behavior of the majority in the market. When a stock's 10-day line turns upward, it is in an upward trend. If it breaks below the 10-day line or fails to rebound above it, entering is usually easy but exiting is difficult. Therefore, participate more when it stands above the 10-day line, especially when it does not break the 10-day line on a second retest.
3. Do not blindly trust indicators. Indicators are useful, but there are three issues: one is lagging, two is distortion, and three is conflict. For example, if the price breaks your stop-loss level, it may be a bottom continuation drop, but the KDJ indicator seems to be at a low point, you must still stop loss in time. Remember, being at a low does not mean a reversal; it can also be a repeated dulling.
4. A true trader only cares about three things: Buy or not? After I buy, what should I do if the stock price rises? What should I do if the stock price falls after I buy? Do not guess how the market will move in the future; instead, be prepared regardless of whether it rises or falls.
5. Plan my trades, trade my plan! I like to set the trading plan for the next day after the market closes, and then during trading hours, I am responsible for executing the plan set the day before, especially not changing my mind easily.
6. Be cautious when adding positions. If a stock drops immediately after entering, it indicates that the timing of entry and your short-term judgment are problematic. At this time, one should consider exiting rather than adding positions. It should be noted that strong stocks do not need to add positions, while weak stocks, even if added, will not help, except for value investors who regularly increase their positions and hold for the long term!
7. Forget about costs. The entry and exit of stocks are unrelated to costs, only related to trends and breakouts. Do not overly focus on positions, which leads to the awkward situation of 'not selling when it should be sold, and not holding when it should be held.' This is also a common problem among many stock investors!
8. Do not touch ST stocks. This is advice for ordinary small investors, especially under the registration system, where shell resources have lost value. Even if ST stocks surge in the short term, that is only a small part; more are on the brink of delisting. If not careful, they may either fall continuously or get delisted, which is not worth the loss for retail investors, so it is better not to participate.
9. Keep a close eye on trading volume! Volume cannot be deceived; a significant volume bar is also an important sign of a stock's activation. If a stock's trading volume has been low for a long time, it means the stock is not popular, and there is no need to participate in the short term, as both the main force's building positions and launching require accompanying volume.
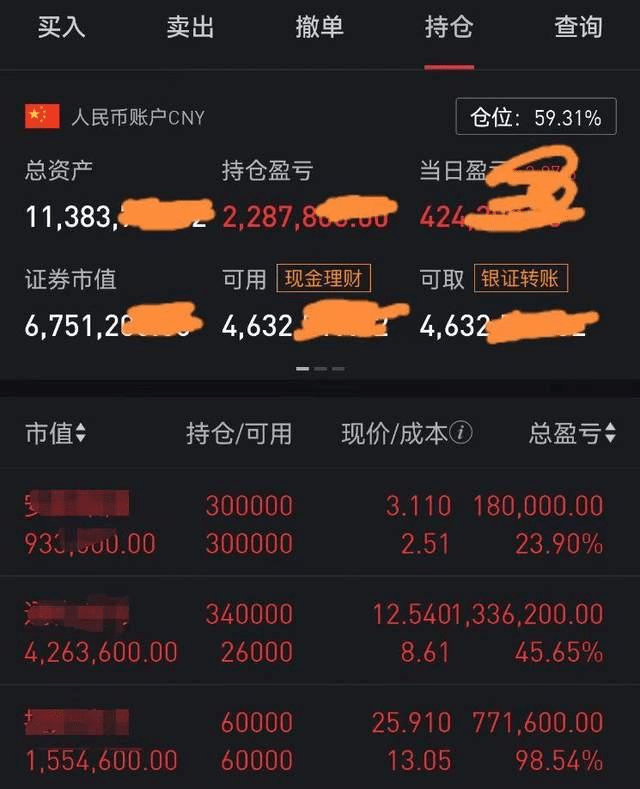
Without further ado, let's get straight to the point! From a loss of 280,000 to now earning 27 million! All because of using the intraday buying and selling strategy! Remember.
What is an intraday chart?
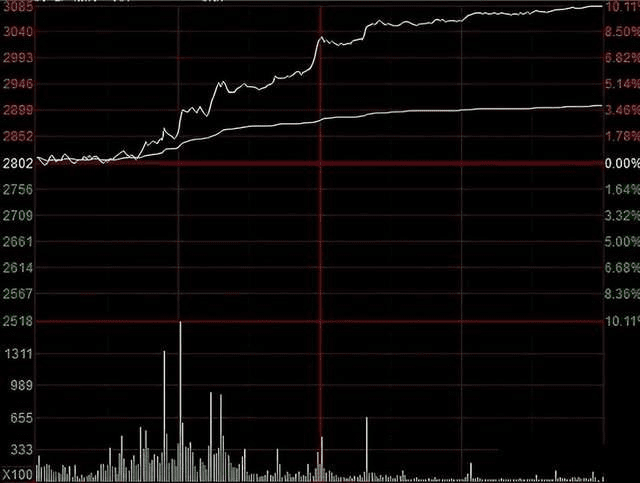
The white curve in the intraday chart represents the price change trend of stocks every minute, and the yellow line represents the average price curve, which serves as a guide for operations.
If the stock price is running above the average price line, it belongs to a bull market, and the trend is relatively strong. Investors should mainly hold stocks to wait for a rise.
If the stock price is running below the average price line, it belongs to a bear market, and the trend is relatively weak. Investors should primarily hold cash.
The meanings of the yellow line and white line in the intraday chart.
1. The white line fluctuating around the yellow line is normal; the white line is always above the yellow line, occasionally breaking below it, and if it quickly pulls back above the yellow line, it indicates strength. The yellow line serves as support for the white line.
The white line and yellow line are always downward, occasionally crossing above the yellow line, and quickly returning below it. The pressure of the yellow line on the white line indicates a weak trend.
2. In normal market conditions, especially for stocks in consolidation, the mixed movement of small bullish and bearish candles can be adopted in the intraday chart.
This means buying when the white line is far below the yellow line, and selling the next day when the white line is above the yellow line. This is a method used by skilled traders during consolidation to make short trades, which may not be suitable for new traders.
The intraday chart is the most essential representation of price movement and trading volume. All actions of the market makers must be reflected in the intraday chart; it is absolutely impossible to skip it.
Therefore, the foundation of stock analysis is intraday, with K-lines being secondary, so everyone must master the method of intraday analysis.
Intraday trading principles:
1. Look for high selling opportunities in the morning session, and low buying opportunities at 2:30 in the afternoon.
2. A rapid surge is a high selling opportunity, and a panic drop is a low buying opportunity.
3. The highest red bar in the MACD red wave is a high selling opportunity, while the highest green bar in the green wave is a low buying opportunity.
4. Breaking below the average price line indicates that the yellow line is a selling opportunity, while rising above the average price line indicates that the yellow line is a buying opportunity. If one buys poorly and later finds further downward space, decisively cut losses and admit mistakes.
The four major rules of intraday charts:
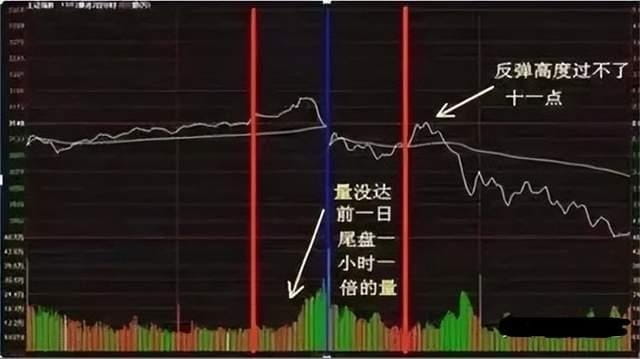
1. 10:30 excessive volume rule.
In a downward trend, if the trading volume from the morning until 10:30 does not exceed the volume of the last hour of the previous trading day, the rebound height usually will not exceed 11 o'clock and there will be no significant changes.
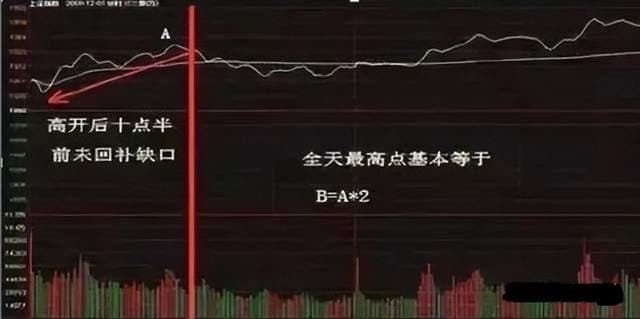
2. Gap multiple rule.
If the market opens high or low by more than 5 points, and if there is no gap filled by 10:30, then the maximum decline of the day is a multiple near the first low or high.
3. Reduced volume reverse arc rule.
If the market opens high or low without filling the gap, and after a significant rise in the first hour, if it falls back, then if the volume in the second hour is lower, and the cumulative volume does not reach 1.5 times the first peak, then the second peak is usually a false high, leading to an upper shadow throughout the day.
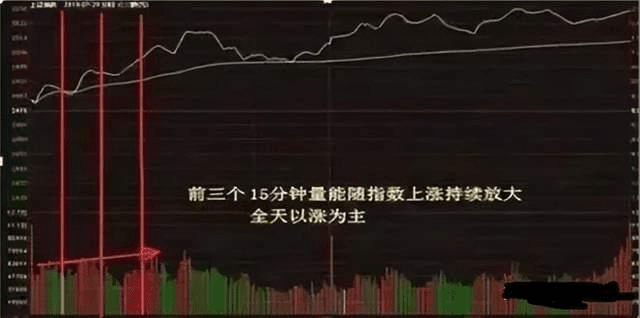
4. 15-minute excessive volume rule.
If the morning session opens high or low and the volume in three consecutive 15-minute intervals is constantly increasing, and there are also three consecutive 15-minute bullish or bearish candles, then the day will show an upward or downward trend throughout the day.
Seven intraday trading techniques.
The white line represents the real-time price of the day, also known as intraday.
The yellow line represents the average price, also known as the average price line.
1. The intraday line crosses above the average price line, and volume begins to increase significantly, one can participate.
2. Intraday three bottoms gradually rise, accompanied by volume, can be followed.
3. After a significant gap up in intraday trading, if it rapidly turns down to form a dead cross and volume is released, be cautious of risks.
4. After a rapid dive in intraday trading, if it quickly turns up and crosses above the average price line, forming a golden cross, one can participate.
5. When the intraday line and the average price line fluctuate gently and show a diverging upward trend, it can be considered for participation.
6. If the intraday line tests the average price line three times but does not break it, wait for volume to increase before following in.
7. Intraday fluctuations within the average price line show entangled states and have no reference value.
Intraday selling point diagram:
1. High divergence selling points:
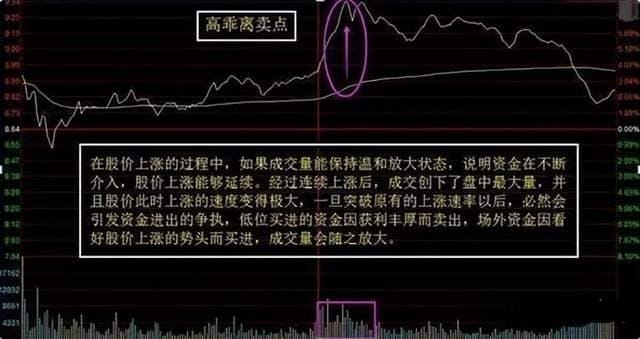
High divergence selling points are methods of selling high during a rapid increase in stock price. Proper use of high divergence selling points can help us sell at the highest fluctuation point in intraday trading.
2. Breakout selling points:
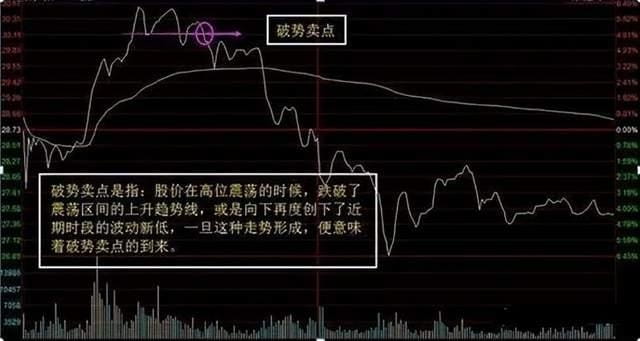
If the distance between the intraday line and the average price line is considerable, we need to operate using 'breakout selling points.'
3. Break average line selling points:
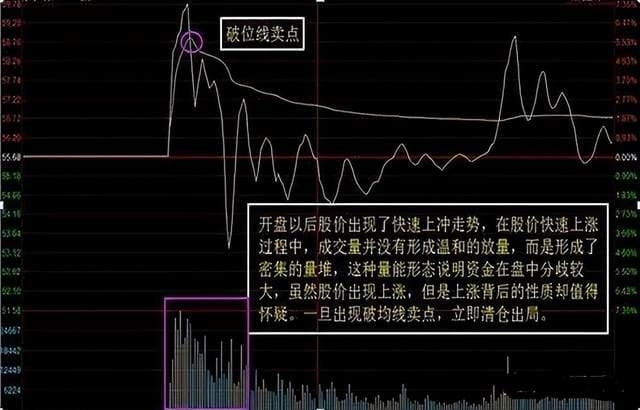
Sell points on breaking the average line are determined in the case of missing high divergence opportunities. If the intraday line continues to fall from a high position and breaks the average price line, it must be sold in time.
4. After opening high, if it breaks below the opening price, it is a selling point.
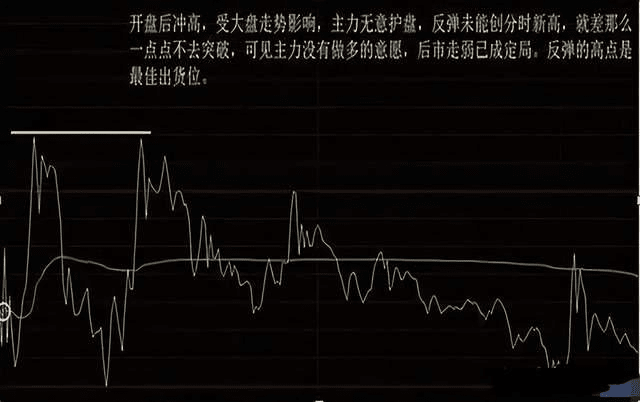
Due to the market's trends, the main force has no intention of protecting the market, and one should not have high hopes for the market's strength. Exiting when the price falls below the opening price or rebounds is a necessary measure for short-term operations.
If the market changes from weak to strong in the future, even if the stock may attempt to test previous highs, the trend will not be very strong, so it's better to choose another target.
Intraday stock selection principles.
1. When the market is still continuing its downward trend, investors should start actively selecting stocks to lay the foundation for timely participation in speculation when the market stabilizes in the future. At this time, it is important to select stocks that have previously dropped significantly and are now leading the market in stabilizing.
2. When the market stops falling and stabilizes, one should select stocks that can successfully build a small bottom pattern in their formation. The stabilization time of individual stocks should be significantly longer than that of the market, and after successfully hitting the bottom, the stocks should have a certain degree of independence in their trends.
3. Further select stocks from the shortlisted ones that have gently increasing volume at the bottom.
4. Confirmation. When the market has confirmed the stop of the decline and shows signs of strengthening, among the stocks that have undergone strict screening, if a stock can show a strong rally with volume, it can be confirmed as a short-term buying signal and should be followed up promptly.
Unconsciousness leads to psychological activities (human nature's defects) that can severely affect your behavior in trading. Common psychological traps in trading include the following:
The psychology of resistance.
There is a stubborn tendency in human nature to defend one's own views and be unwilling to admit mistakes in judgment. Therefore, regardless of whether one is right or wrong, they will stick to their attitude to the end. Because that viewpoint is their own, they are not defending the truth but rather their ego.
Why does human nature like to resist? Because through resistance, one says 'no' to others, and a person's self will be enhanced. Through resistance, they feel powerful and see themselves as important. Compliance and submission are damaging to the self. This is why so many people like to argue with others.
This natural tendency of resistance in human nature, unwillingness to submit, and unwillingness to give up one's mistakes is the greatest obstacle to trading.
Pursuit of perfection.
The pursuit of perfection is a very greedy mentality, an extreme mindset.
Because of the pursuit of perfection, you do not allow any flaws and cannot bear even a small loss, making it difficult to execute stop losses when necessary. Because of the pursuit of perfection, you try to catch all fluctuations, not wanting to miss any market movement. Everyone has their own limitations and areas they are not good at; the pursuit of perfection can easily lead to heavy trading and frequent trades.
Achieve success in one battle.
Putting too much weight on the results of a single trade, hoping to get rich from one trade. Or refusing to cut losses and exit when obviously wrong about the market, stubbornly holding onto losing positions.
Trading is a long-term process, and there is no need to be overly fixated on the results of a single trade. Sometimes accepting small losses is very healthy, as it can prevent larger losses. It is like a minor cold that is beneficial rather than harmful to a person's overall health.
The psychology of counting money.
This is a kind of gain-loss mentality. Once we build a position, we constantly worry about the fluctuations of the account balance and let these changes affect our emotions, neglecting the real market itself. This greatly interferes with our normal judgment.
We should focus more on the correctness of the process; the results will follow. If we think about the results in advance, it will disrupt the entire trading process, leading to distorted actions. The human mind always jumps ahead to think about illusory results and neglects what is actually happening right now, which is the greatest absurdity and inversion in our lives.
Change the time frame.
Originally, a short-term trade was forced to be converted into a medium to long-term trade, and a medium-term trade was handled as a short-term trade, resulting in chaotic and disorderly trading.
Predict the market, trying to catch the peak or bottom.
Any prediction is subjective. Once you predict the market, you project your subjective view onto the market, viewing it through a distorted lens, which leads to paralysis in the entire speculative activity.
Once you predict the market, you are reluctant to set or execute stop-loss levels because you believe that any unfavorable fluctuations are temporary, and the market will ultimately return to your predicted direction. Many speculators suffer heavy losses when trying to catch market bottoms or tops.
The defects of human nature are like a 'raging wild boar' preparing to rush into your garden and wreck everything. In trading, only by clarifying the defects of human nature and constantly being vigilant can one build a strong 'fence' to protect their soul's 'sanctuary.'
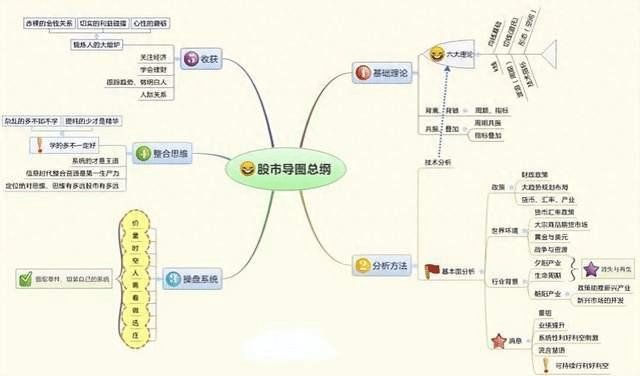
Next, I would like to share the overview of the stock market map, K-lines, average lines basics, tangents, indicator analysis, stock selection methods, sector rotation, and various stock market scams. I hope to provide everyone with a comprehensive overview of stock knowledge and help stock friends find suitable methods they want to learn.
1. Overview of the stock market map.
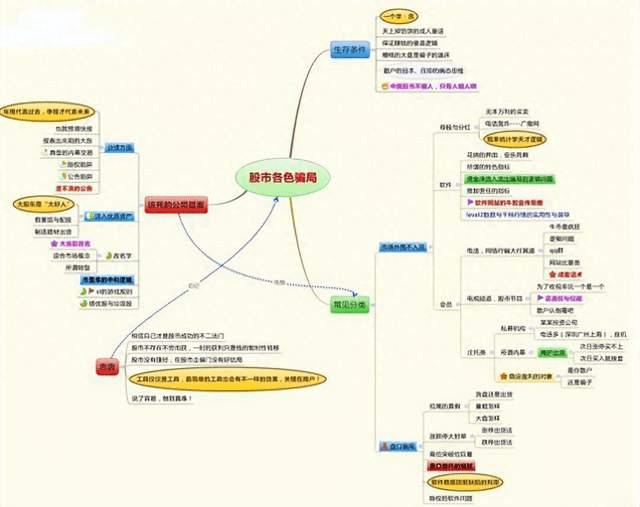
2. Various stock market scams.
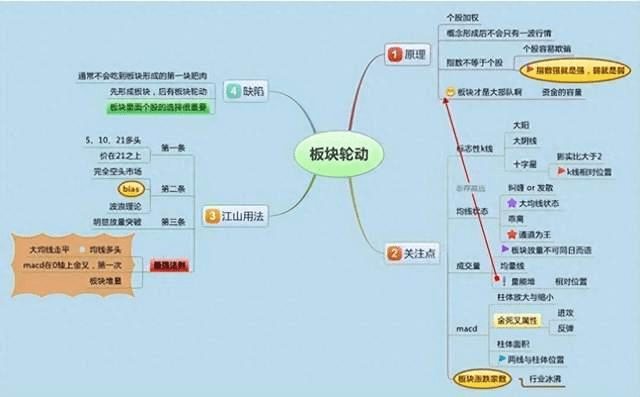
3. Sector rotation.
4. Stock selection methods.
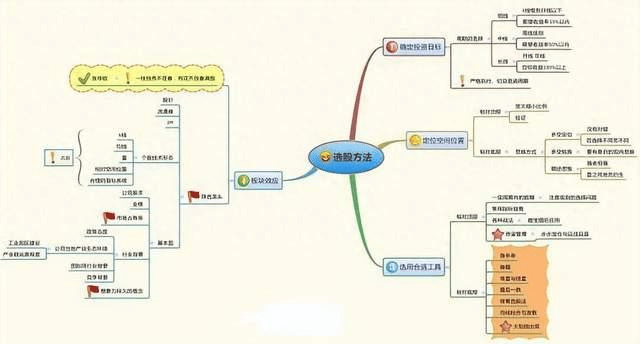
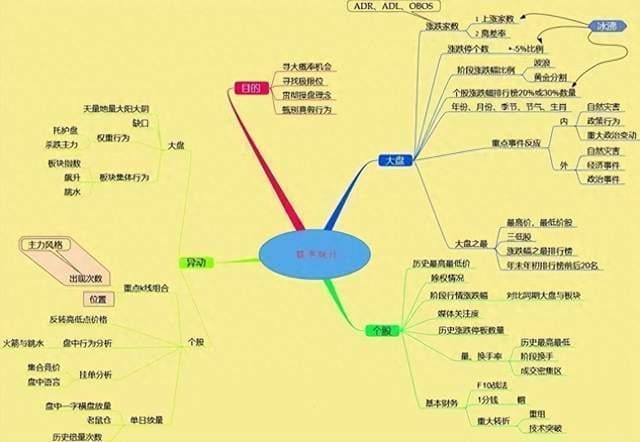
5. Statistical analysis.
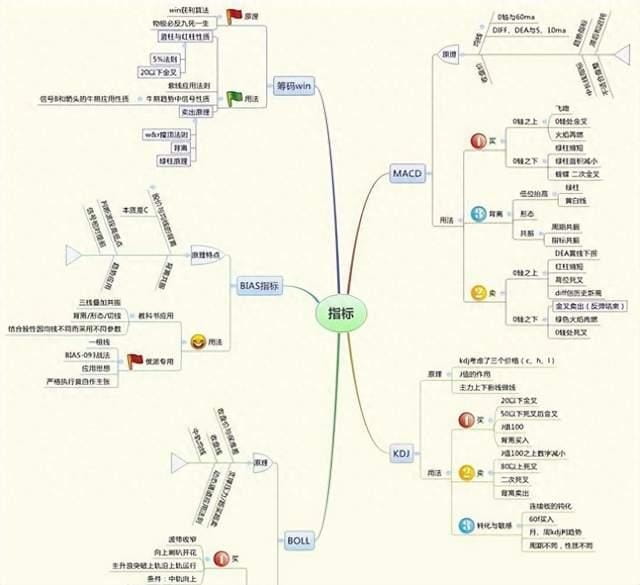
6. Indicator analysis.
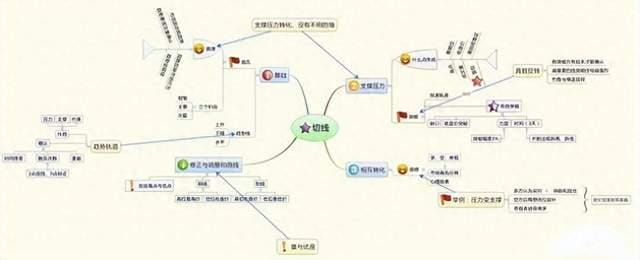
7. Tangent.
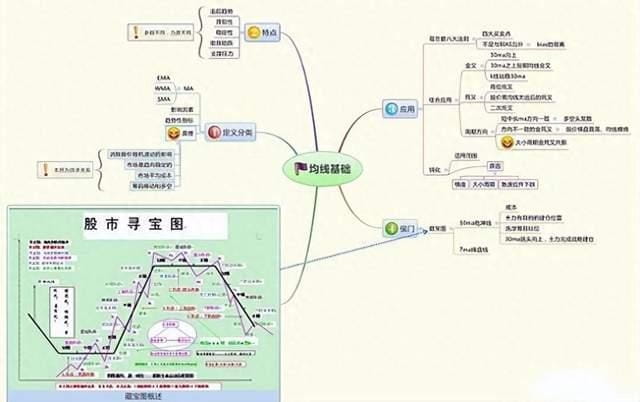
8. Basics of moving averages.
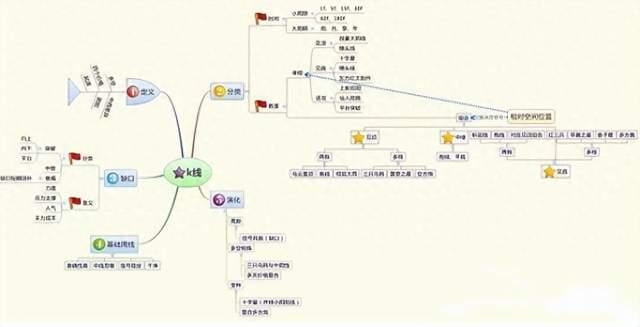
9. K-line.
10. Overview of the stock market map.


