🔥 Technical analysis for the currency $BNB :
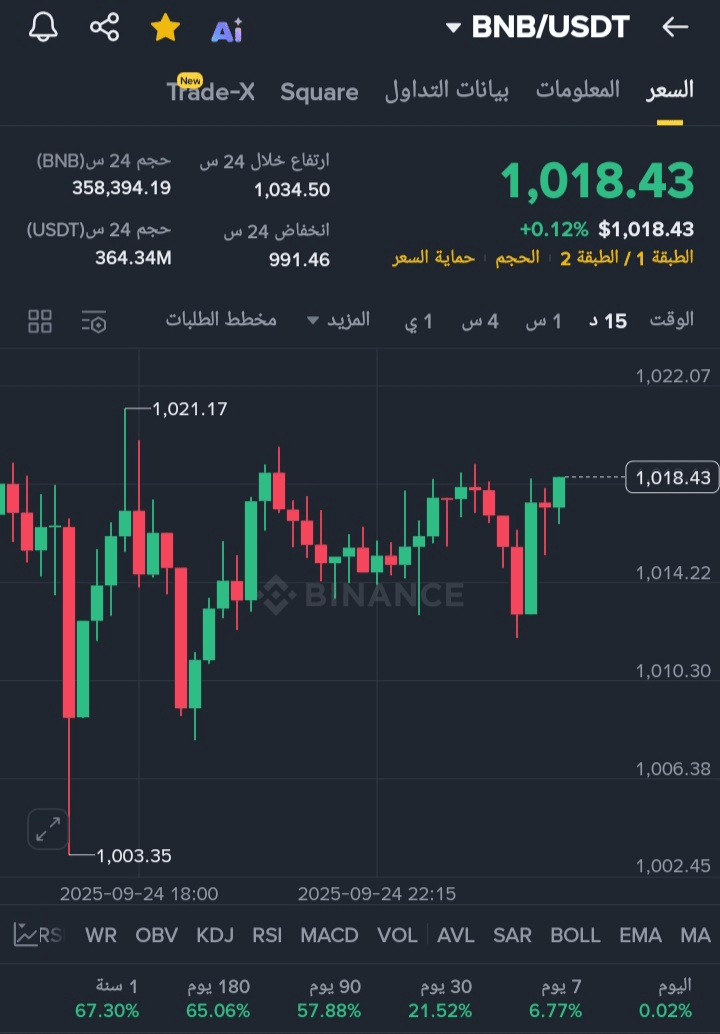
The BNB currency is currently trading at $1,018.43 after hitting a low of $1,003.35 and a daily high near $1,034.50.
The chart shows us a strong consolidation above the support level of $1,003, reflecting clear liquidity entering from buyers as the price approaches this barrier.
📊 Technical indicators like RSI and MACD:
It shows that momentum is in a phase of gradual improvement, as the candles approach testing the resistance area of $1,022 – $1,034, which if breached could open the door to a new bullish wave.
🔮 Price forecasts:
In the short term: If the price successfully breaches the level of $1,022 and holds above it, we may see a surge towards $1,050 – $1,080.
In the medium term: Continued buying flows support targeting the level of $1,120 then $1,200.
Strong support: remains at $1,000, and only breaking it could bring the price back to the areas of $980 – $970.
📎 Summary:
The BNB coin proves once again that it is one of the strongest digital assets in the market! 🔥
As it approaches breaking important resistances, any upcoming rise could open the door to a historical upward wave pushing it towards new peaks.
📌 It is a golden moment for followers to seize the opportunity before the next launch.
🔰 I am honored to have you following me and joining our humble family, my best regards to everyone along with my wishes for your success.. ❤