On Wednesday (September 24), during the Asian market session, Bitcoin continued to consolidate at low levels below $112,000, after Federal Reserve Chairman Powell stated that interest rates remain 'moderately restrictive', opening the door for further rate cuts.
Bitcoin is currently hovering around $112,000, due to negative ETF capital flows. According to data compiled by SoSoValue, investors withdrew $363 million from Bitcoin ETFs earlier this week. Meanwhile, Ethereum's short-term performance lags behind Bitcoin, due to weakened speculative demand and declining risk sentiment, although long-term driving factors such as staking and decentralized finance (DeFi) continue to support its development.
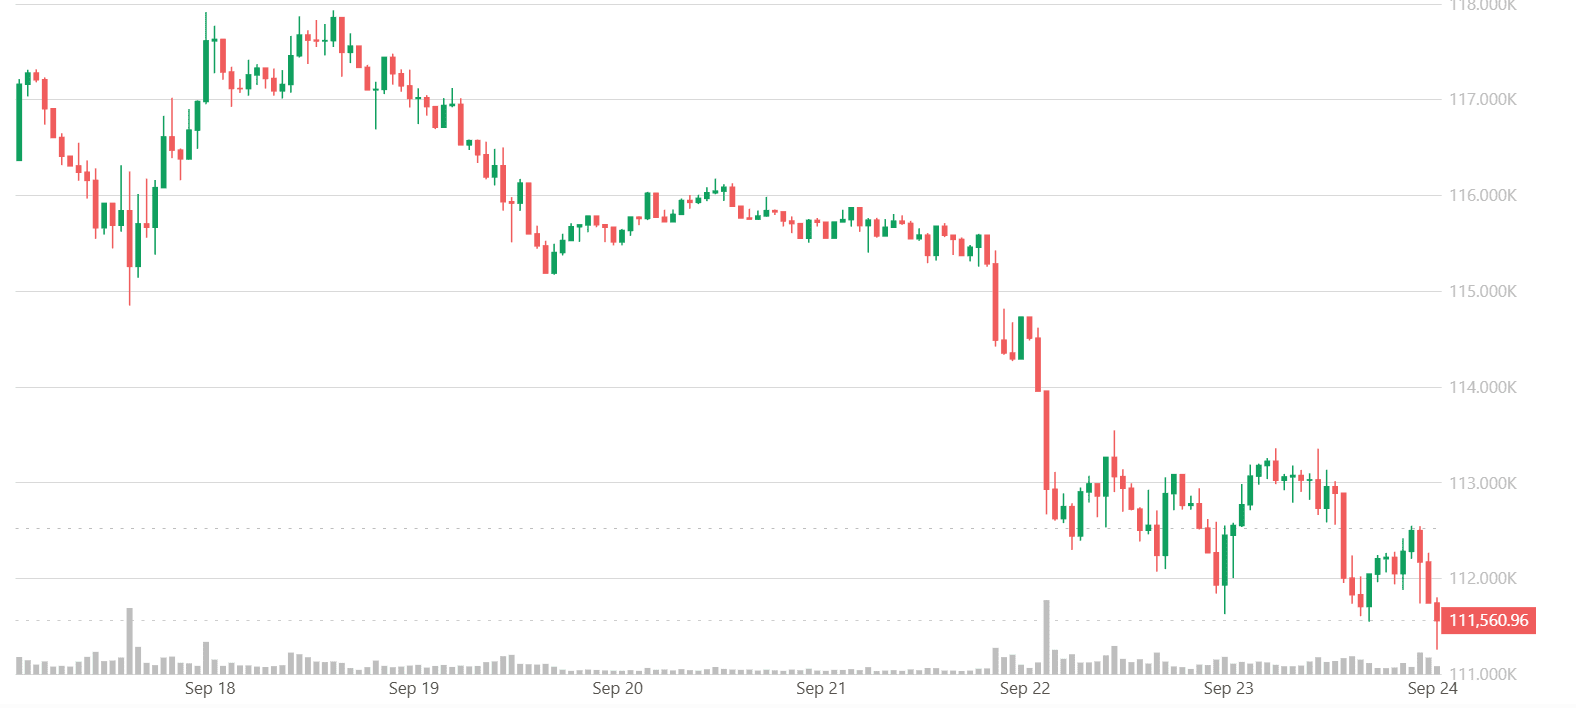
The downward trend of Bitcoin that started on the 19th continues. Yesterday, Bitcoin briefly fell to around $111,400, hitting a low for the past 10 days.
Due to Federal Reserve Chairman Powell's cautious stance on further interest rate cuts during his speech and suggesting limited cuts, Bitcoin's performance is weak.
Powell's speech in the early hours of the 24th caused all gains to be wiped out. In his speech to the Rhode Island Chamber of Commerce, Powell stated: 'In the short term, inflation risks are tilted to the upside, while employment risks are tilted to the downside. This is a challenging situation.'
'When there is such a two-way risk, there is no risk-free choice.' He said, 'If we are too aggressive in cutting rates, it will undermine the work of suppressing inflation, and we may have to raise rates again to restore the 2% inflation target.'
Significant outflows from Bitcoin ETFs
Due to this round of declines, $167.75 million worth of long positions in the cryptocurrency market were forcibly liquidated in the past 24 hours. At the same time, due to extreme volatility, short positions also saw $87.27 million liquidated. After experiencing a sharp decline, the market is currently in a sideways consolidation state.
As investors reduce risk after a period of turbulent fund flows, Bitcoin and Ethereum exchange-traded funds (ETFs) have seen a decline at the start of this week. Data from Monday revealed significant fund outflows from both markets, with not a single ETF untouched by the wave of sell-offs.
Bitcoin ETFs recorded a total outflow of $363.17 million, the largest single-day exit since early September. Fidelity's FBTC was hit hardest, with an outflow of $276.68 million, followed closely by Ark 21Shares' ARKB with a redemption of $52.3 million. Ethereum ETFs also showed a downward trend, recording a total outflow of $75.95 million. Fidelity's FETH had the largest loss at $33.12 million, followed closely by Bitwise's ETHW with a loss of $22.3 million.
The synchronized retreat indicates that cryptocurrency ETF investors are acting cautiously, with capital withdrawal after a large influx of funds last week making the market more cautious.
Historically, ETF fund outflows often exert downward pressure on prices. If this trend continues, Bitcoin may lose the $110,000 support level, triggering a chain of liquidations and falling to the $100,000 to $105,000 range. This pessimistic scenario suggests that, at least in the short term, Bitcoin is more likely to experience adjustments rather than a surge.
Despite heavy selling pressure, optimists are looking at the recent rise in gold. Gold has broken out of a long consolidation, and Bitcoin seems to be replicating this trend. Analysts believe that if Bitcoin continues on the same path, breaking through the $124,000 to $126,000 range, it could surge above $140,000.
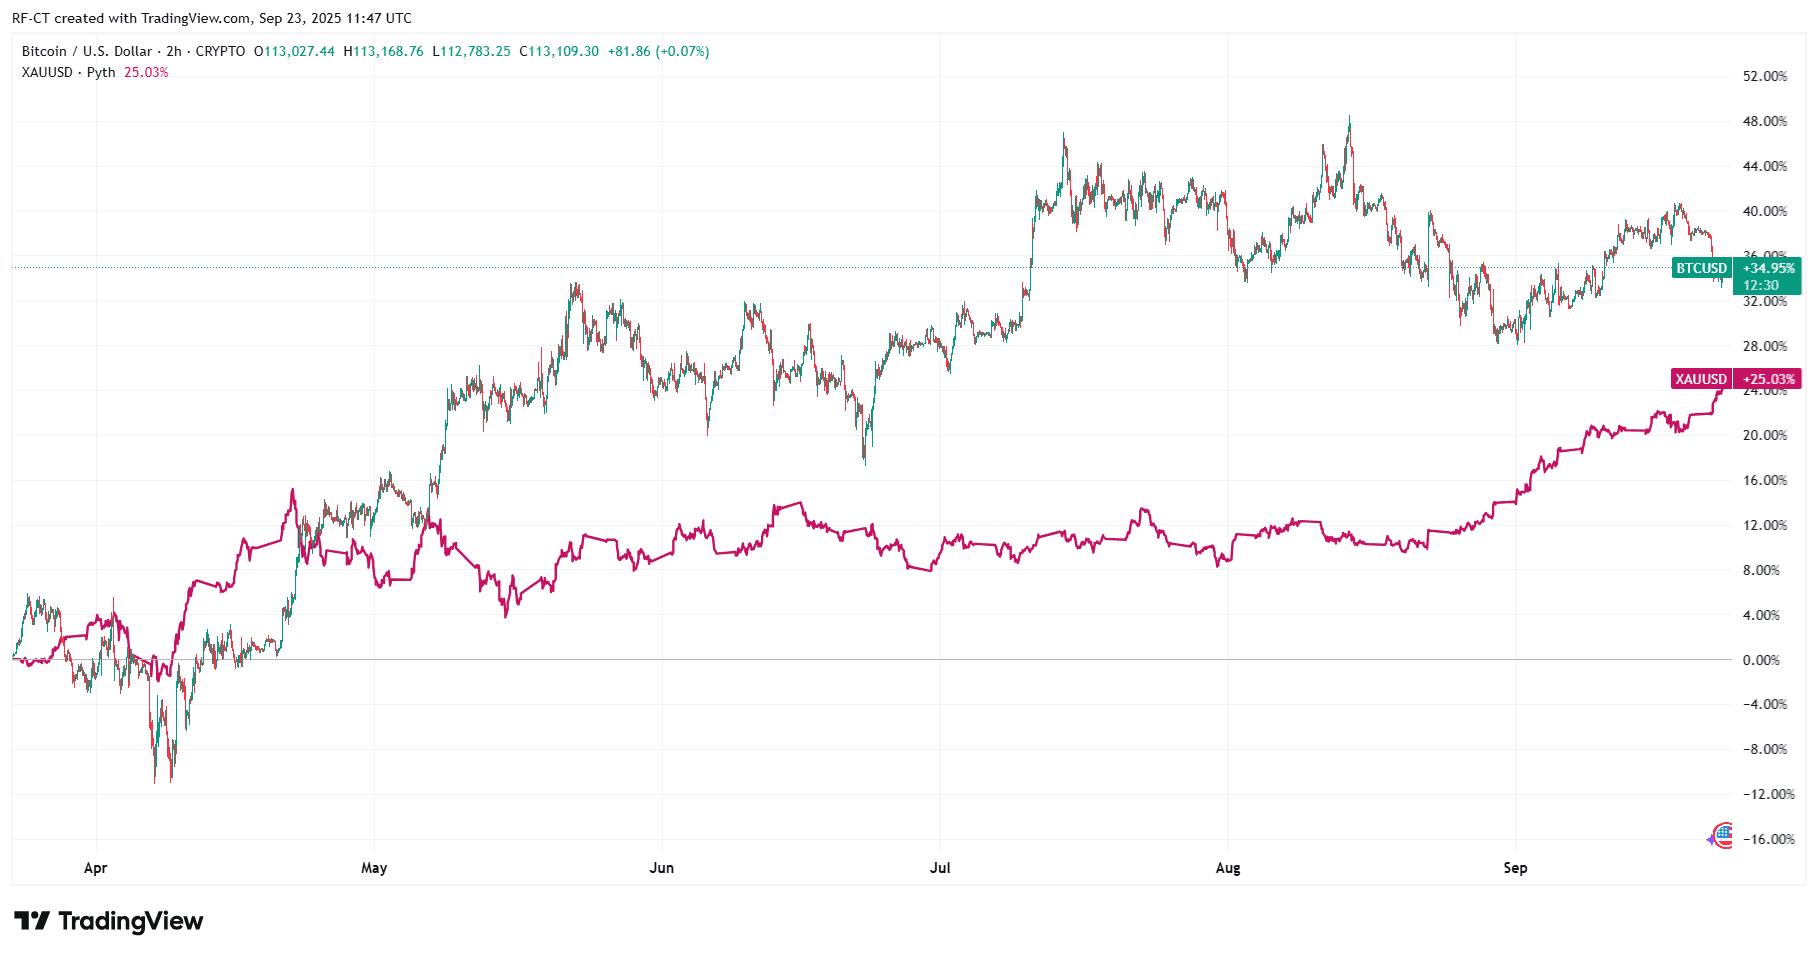
This viewpoint is known as the 'Bitcoin Super Cycle' theory, which argues that long-term adoption trends, ETF approvals, and the scarcity brought about by halving can drive Bitcoin higher after a brief pullback.
Crash, rise, or sideways?
Bitcoin does not move in a straight line. Current market conditions suggest three possibilities:
Crash scenario: Accelerated ETF fund outflows → BTC breaks $110,000 → tests $100,000.
Bullish breakout: Bitcoin breaks $124,000 → replicating gold's rise to above $140,000.
Sideways range: oscillating between $110,000 and $124,000, waiting for stronger macro or institutional catalysts.
For traders and investors, the key level remains $110,000. Holding this level maintains a bullish logic; losing it faces deeper selling risks.
Will Bitcoin crash?
The answer depends on which force is stronger: the bearish pressure from ETF fund outflows or the bullish momentum from a gold-like breakout.
Short-term risks point to volatility and potential pullbacks, but the long-term logic remains unchanged. As always, Bitcoin thrives in uncertainty—whether this moment will mark the beginning of a crash or the prelude to a super cycle rise remains to be seen.
Bitcoin Technical Analysis
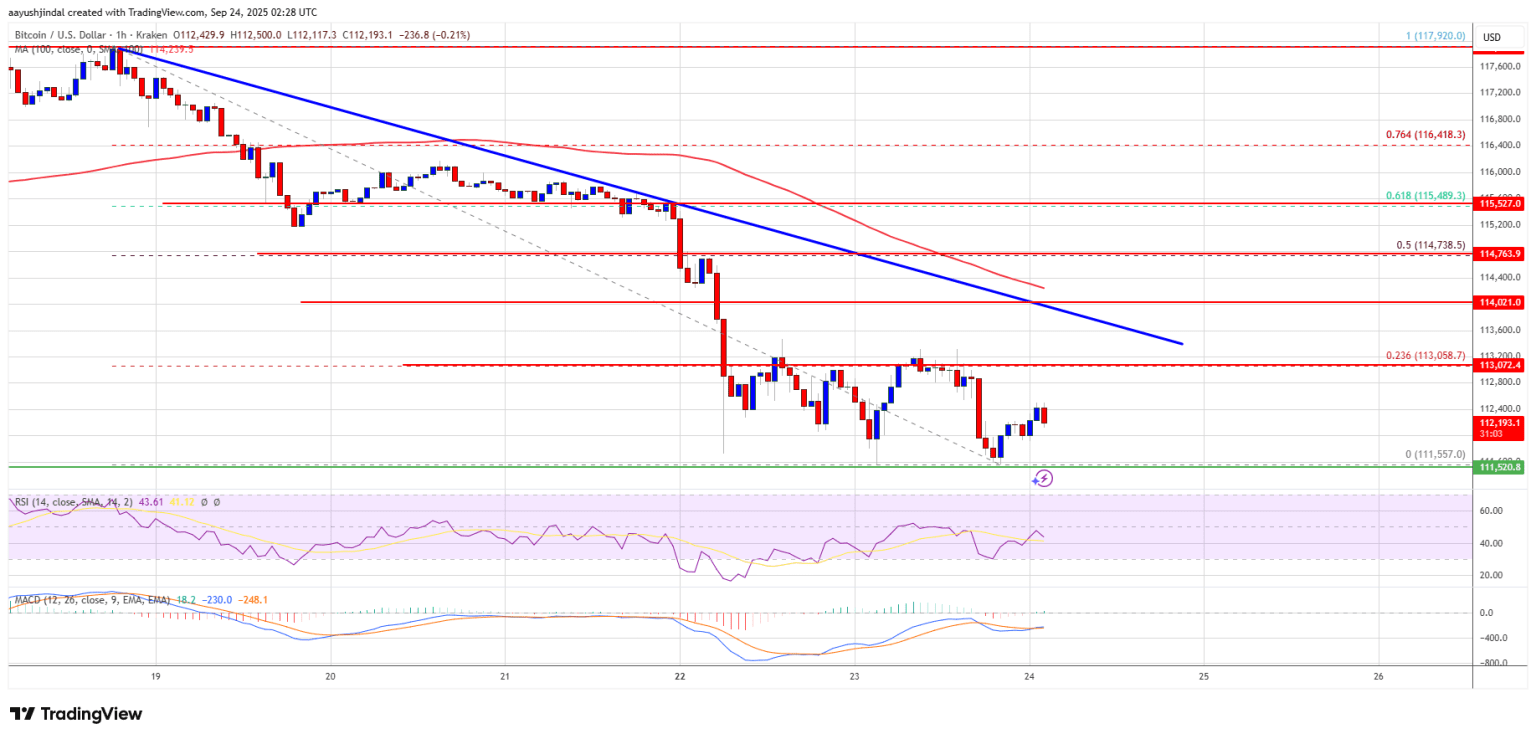
Bitcoin failed to maintain above $115,500 and began a new round of declines. BTC broke below the $115,000 and $114,000 support levels, entering a short-term bearish range. The decline accelerated below $113,500. It fell to a low of $111,557, and the current price is consolidating below the 23.6% Fibonacci retracement level of the decline from the $117,920 high to the $111,557 low.
Bitcoin is currently trading below $113,200 and is below the 100-hour simple moving average. Additionally, a bearish trendline has formed on the BTC/USD hourly chart, with resistance near $113,600.
On the upside, recent resistance is around $113,000. The first key resistance is at $113,500 and the trendline position. The next resistance may be at $114,000. If it closes above the $114,000 resistance, the price may rise further. In this case, the price could increase and test the $114,750 resistance or the 50% Fibonacci retracement level from the $117,920 high to the $111,557 low. If it breaks further, the price may rise to $115,500. The next bullish barrier may be at $116,250.
On the downside, if Bitcoin fails to break through the $114,000 resistance area, it may open a new round of declines. Recent support is near $112,000. The first major support is around $111,750. The next support is at $110,500. If it further loses support, the price may fall to the $108,800 support level in the short term. The main support level is at $107,500, and if it breaks below this level, BTC may gain stronger bearish momentum.
Technical Indicators:
Hourly MACD: The MACD is currently accelerating in the bearish zone.
Hourly RSI: The RSI for BTC/USD is currently below the 50 level.
Main support levels: $112,000, followed by $111,750.
Main resistance levels: $113,600, followed by $114,000.

