XRP price has started a new round of decline below the 2.920 USD area. The current price has shown bearish signs and may break below the 2.80 USD area again.
XRP price is breaking below the support zone of 2.920 USD.
The current price is below 2.90 USD and the 100-hour simple moving average.
A bearish trend line has formed on the hourly chart for XRP/USD, with resistance at 2.920 USD (data source: Kraken).
If it breaks below 2.80 USD, this currency pair may continue to decline.
XRP price has dropped significantly.
XRP price failed to maintain its upward momentum and break the 3.120 USD mark, and like Bitcoin and Ethereum, it has started a new round of decline. The price has fallen below the support levels of 3.00 USD and 2.920 USD.
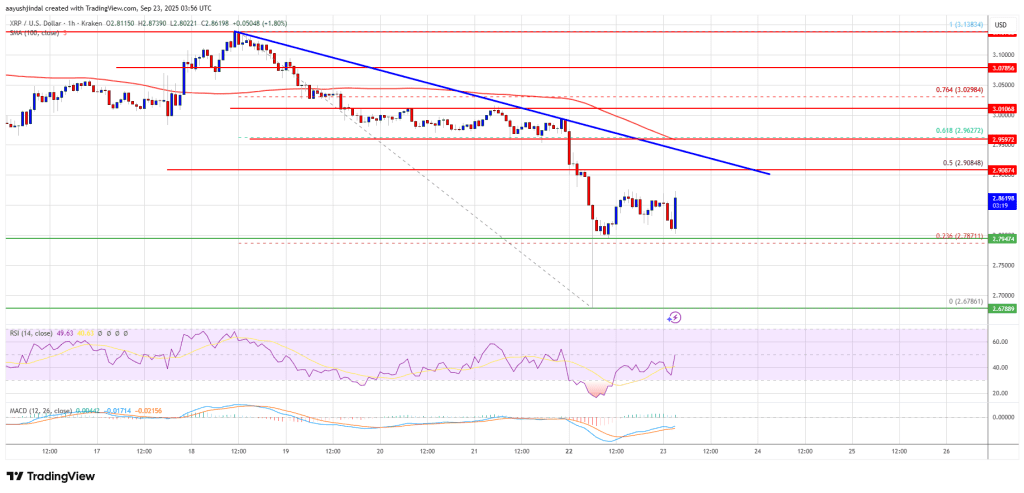
Bears have even pushed the price below $2.80. A low is forming near the support level of $2.678, and the current price is correcting part of the decline. The price has broken through the 23.6% Fibonacci retracement level from the recent swing high of $3.138 to the low of $2.678.
Currently, the price is below $2.90 and the 100-hour simple moving average. Additionally, there is a bearish trend line forming on the hourly chart of XRP/USD, with resistance at $2.920. If the bulls hold the support level at $2.80, the price may attempt to steadily rebound.
On the upside, the price may face resistance around $2.90. The first major resistance level is around $2.920 and its trend line. This resistance level is close to the 50% Fibonacci retracement level from the recent swing high of $3.138 to the low of $2.678.
 If the price clearly breaks above the resistance level of $2.920, it may push up to the resistance level of $3.00. If the price rises further, it may push up to the resistance level of $3.050. The next major resistance level for the bulls may be around $3.120.
Another decline?
If XRP fails to break through the resistance level of $2.920, it may continue to decline. The initial support level in the downward direction is around $2.820. The next major support level is around $2.80.
If a downward breakout occurs and closes below $2.80, the price may continue to decline to $2.740. The next major support level is around $2.650; if this support level is broken, the price may gain bearish momentum.
Technical indicators
Hourly MACD - The MACD for XRP/USD is currently losing momentum in the bearish zone.
Hourly RSI (Relative Strength Index) - The RSI for XRP/USD is now below the 50 level.
Major support levels - $2.820 and $2.80.
Major resistance levels - $2.90 and $2.920.

