On Tuesday (September 23), during the Asian market session, Bitcoin continued its decline from yesterday, further weakening below $112,000. Although the Federal Reserve's rate cut last Wednesday briefly stimulated Bitcoin to rise to $117,500, the market failed to form a bullish breakout structure, leading to the current pullback.
Bitcoin is currently priced at $112,446. Despite a total inflow of over $385 million in ETF funds over two consecutive days from September 18 to 19, Bitcoin's price still struggles to gain momentum, reflecting a broader trend of profit-taking and cautious market sentiment.
Ethereum is currently trading at around $4,200, with a short-term decline significantly greater than Bitcoin. Although there was a net inflow of over $260 million in spot Ethereum ETFs between September 18 and 19, the pullback highlights ETH's greater sensitivity to changes in risk sentiment and a reduction in speculative demand. However, its long-term fundamentals related to decentralized finance, staking, and institutional adoption remain solid.
Yesterday, Bitcoin briefly dropped below $111,500, clearing internal liquidity between $115,000 and $114,000, and testing the daily demand zone between $110,700 and $113,200.
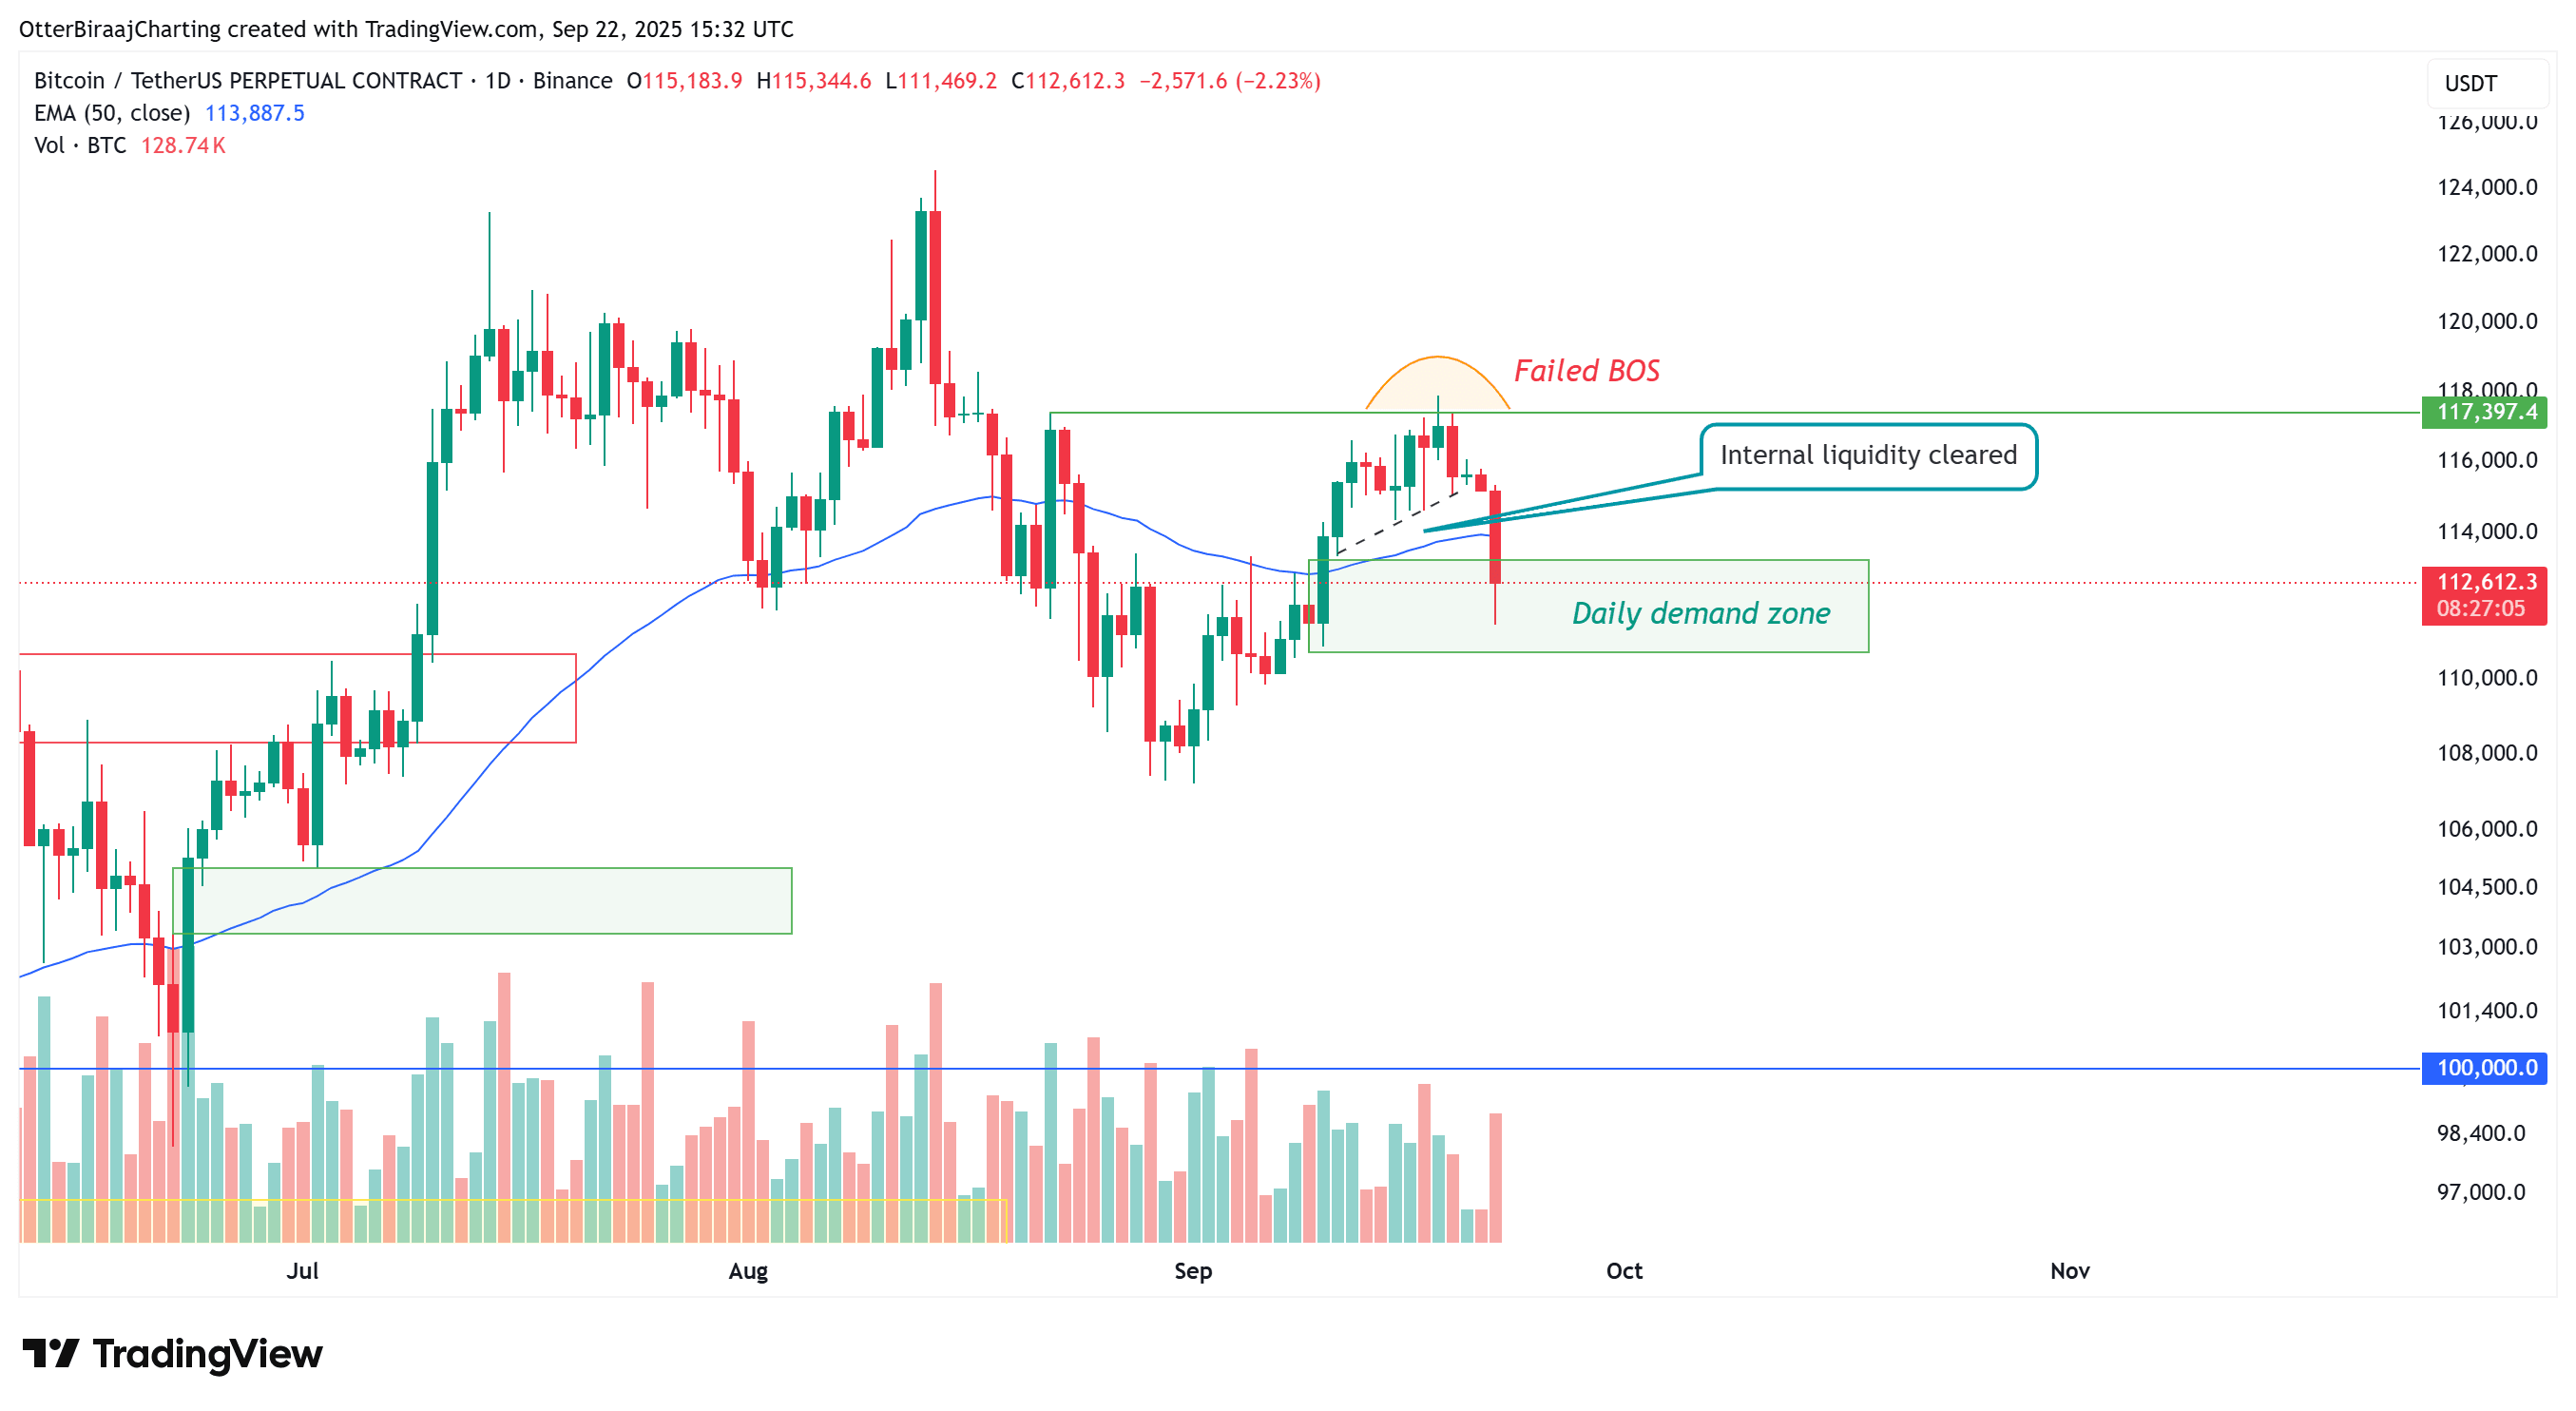
If the daily closing price is below $113,200, Bitcoin may lose support from the 50-day Exponential Moving Average (EMA). Cointelegraph pointed out the possibility of this pullback last week, expecting the price to drop below $113,000 before resuming its upward trend.
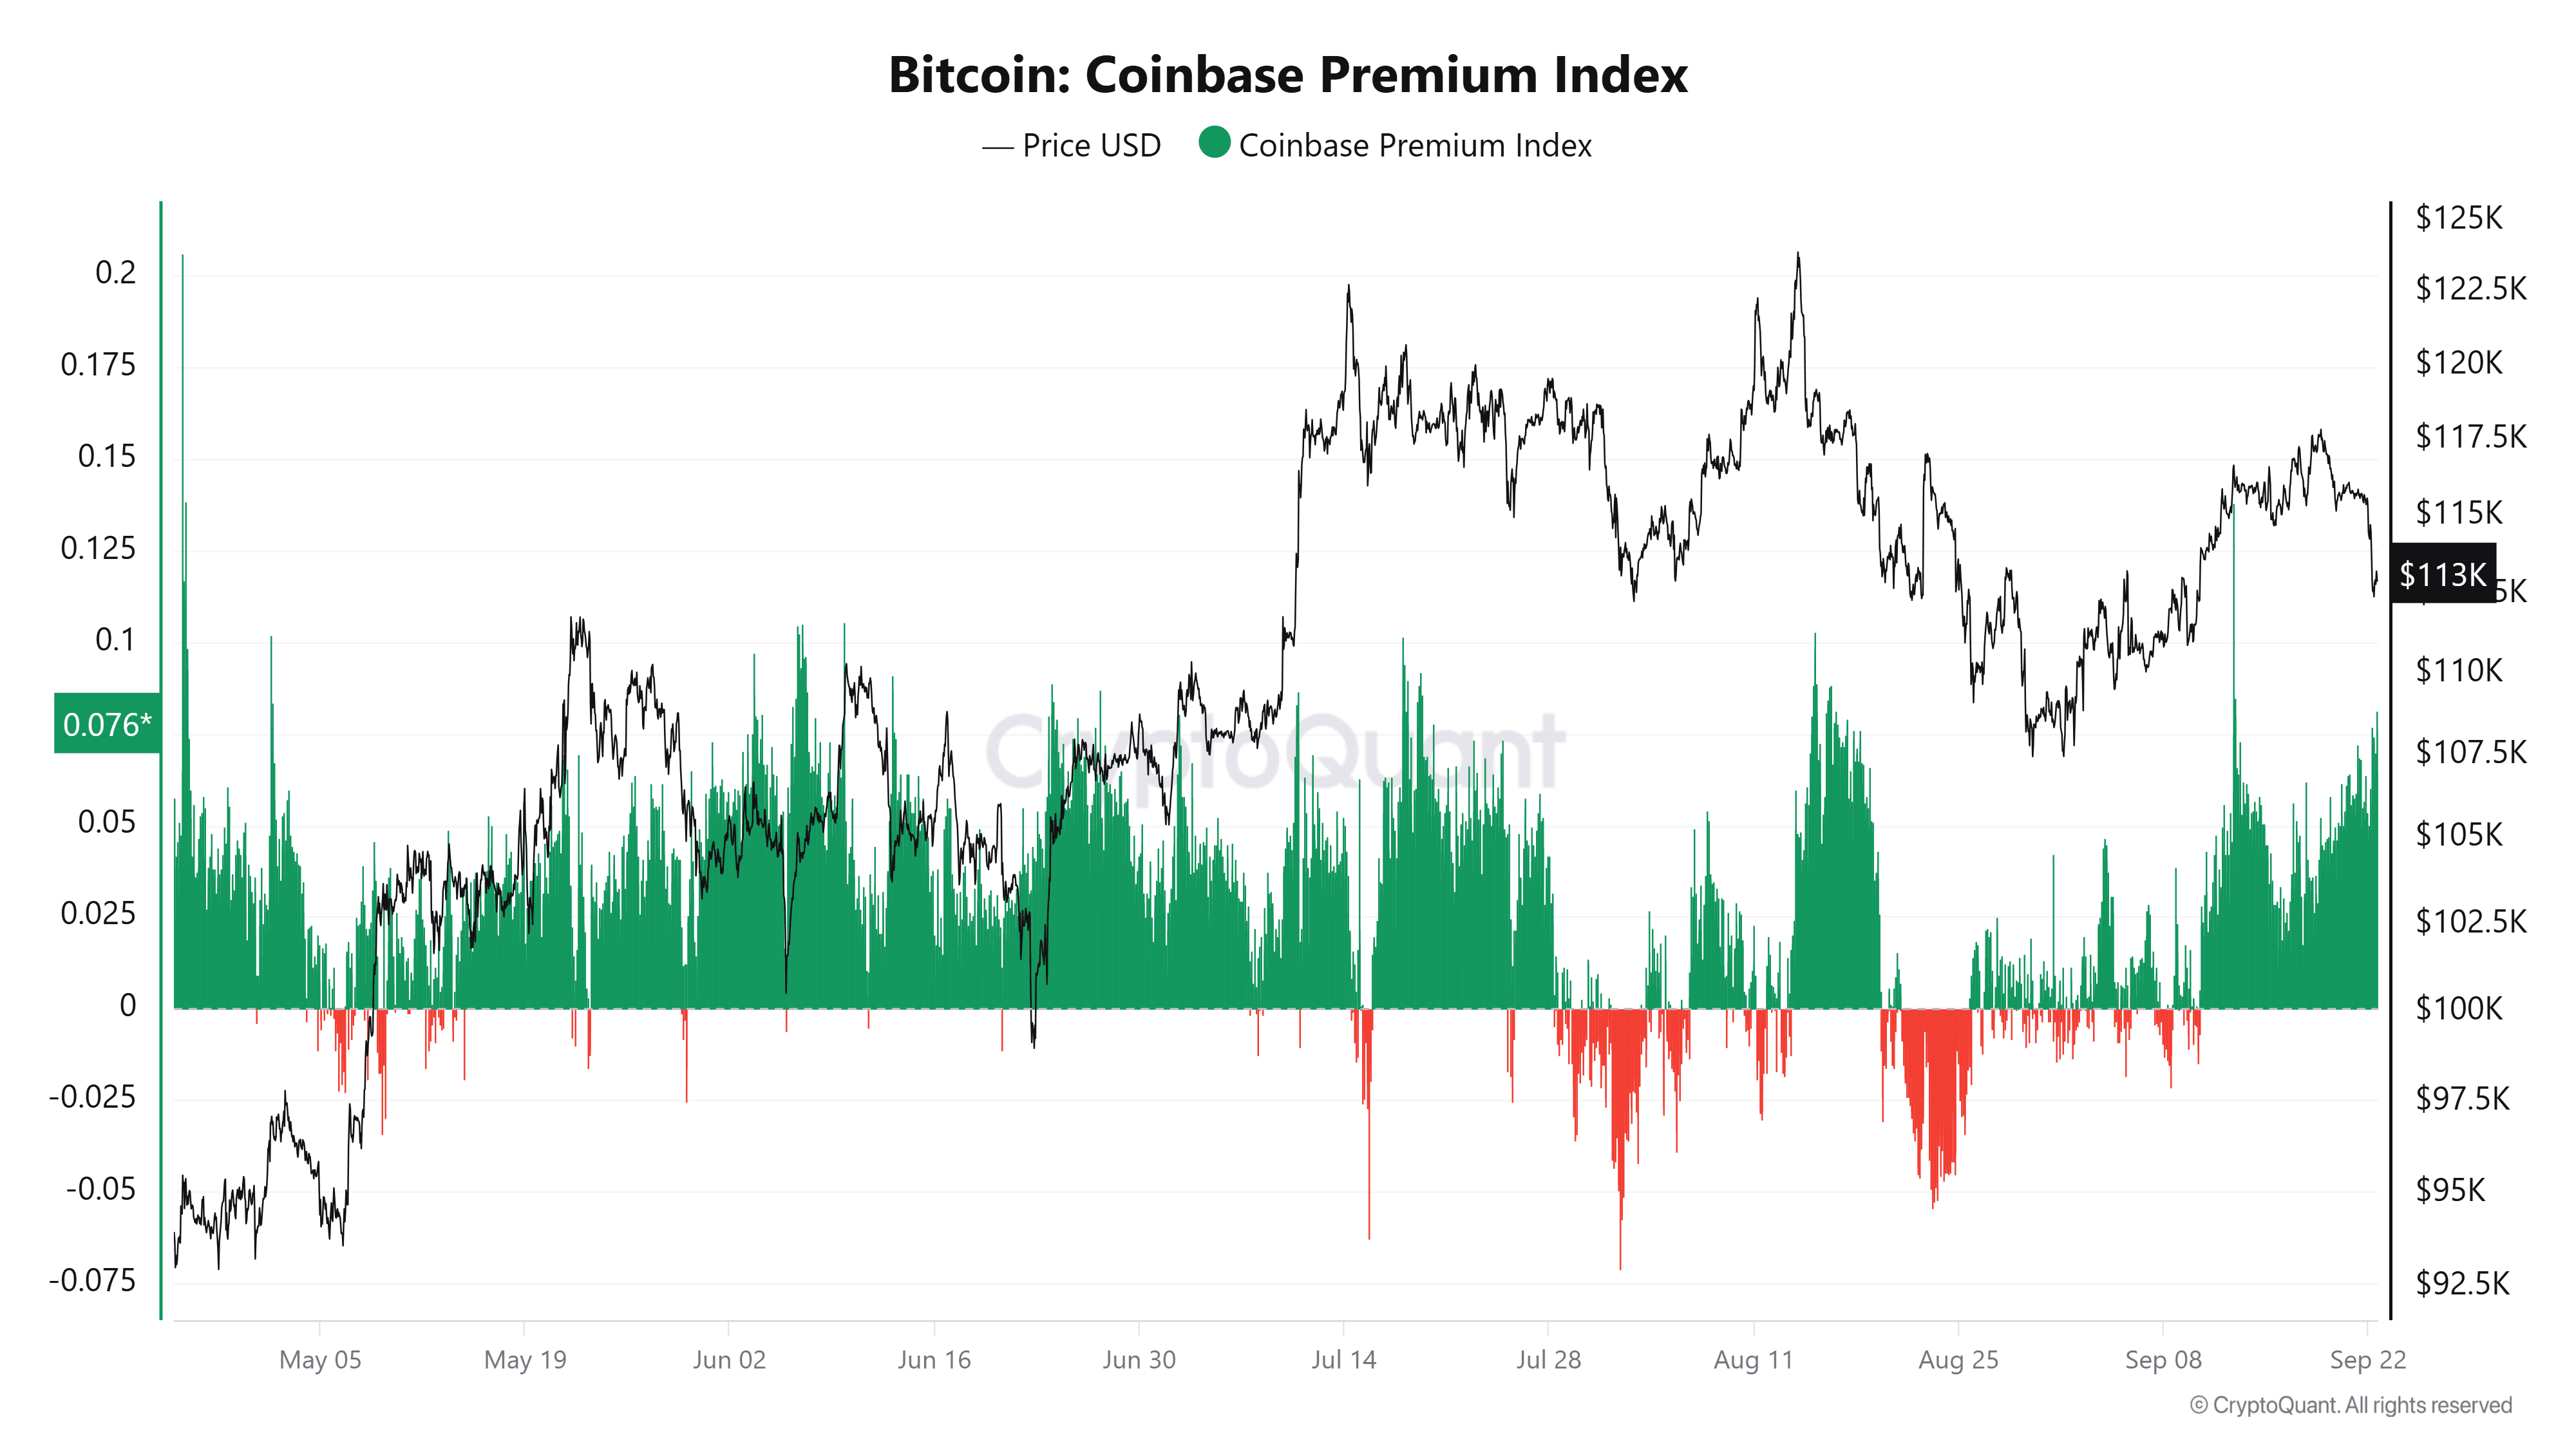
Despite the downward trend, the overall market structure remains constructive. CryptoQuant data shows that investors are actively buying on the dip, and the Coinbase premium index is strongly positive, indicating that U.S. spot demand is supporting the market against deeper downward pressure.
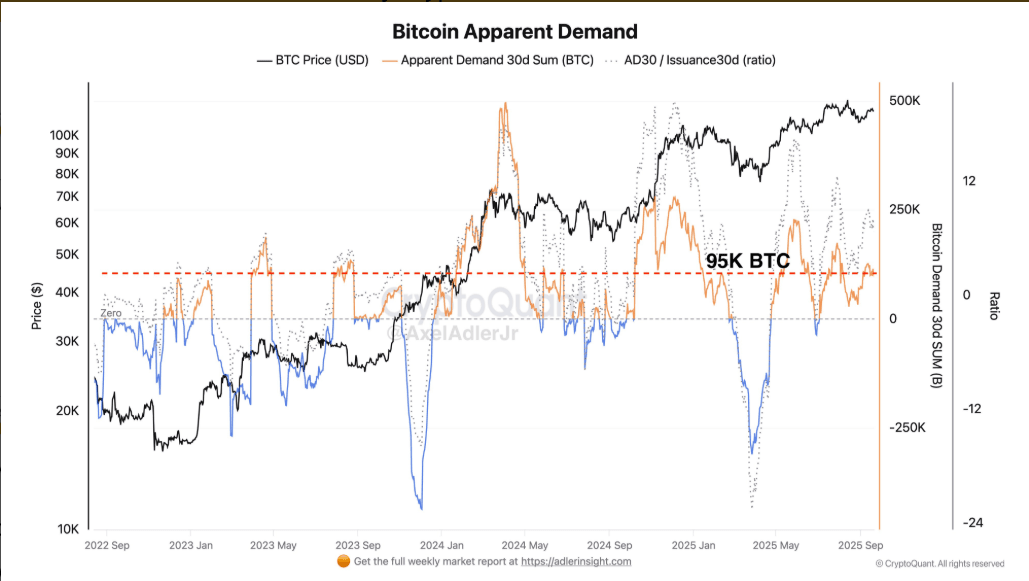
On-chain data also supports this view. Bitcoin researcher Axel Adler Jr. noted that spot demand has remained stable over the past month, with cumulative demand reaching 95,800 BTC. Continued buying pressure keeps the price trend at the upper end of the recent range, even with a short-term weakness in the futures market.
Additionally, during this round of adjustment, about $280 million in Bitcoin futures positions were liquidated, squeezing out the leverage accumulated during Bitcoin's rise from $107,000 to $117,500 in September. With the excessive leverage cleared, if spot demand persists, the market may be more favorable for a healthy continuation of the upward trend.
Bitcoin Key Price Level Observation
Currently, Bitcoin is trading slightly below $113,000, with three key price levels from a trend perspective:
The first demand zone is between $110,700 and $113,200. A strong rebound from this area would indicate that the recent pullback was merely a leverage washout, clearing out excessive speculative positions.
Crypto analyst Dom pointed out that the futures market has seen the largest scale of long liquidation in recent months, with nearly 80% concentrated on Bybit. Such events often reset the market environment, paving the way for a cleaner upward move. If there is a swift rebound, Bitcoin could temporarily rise above $117,000.
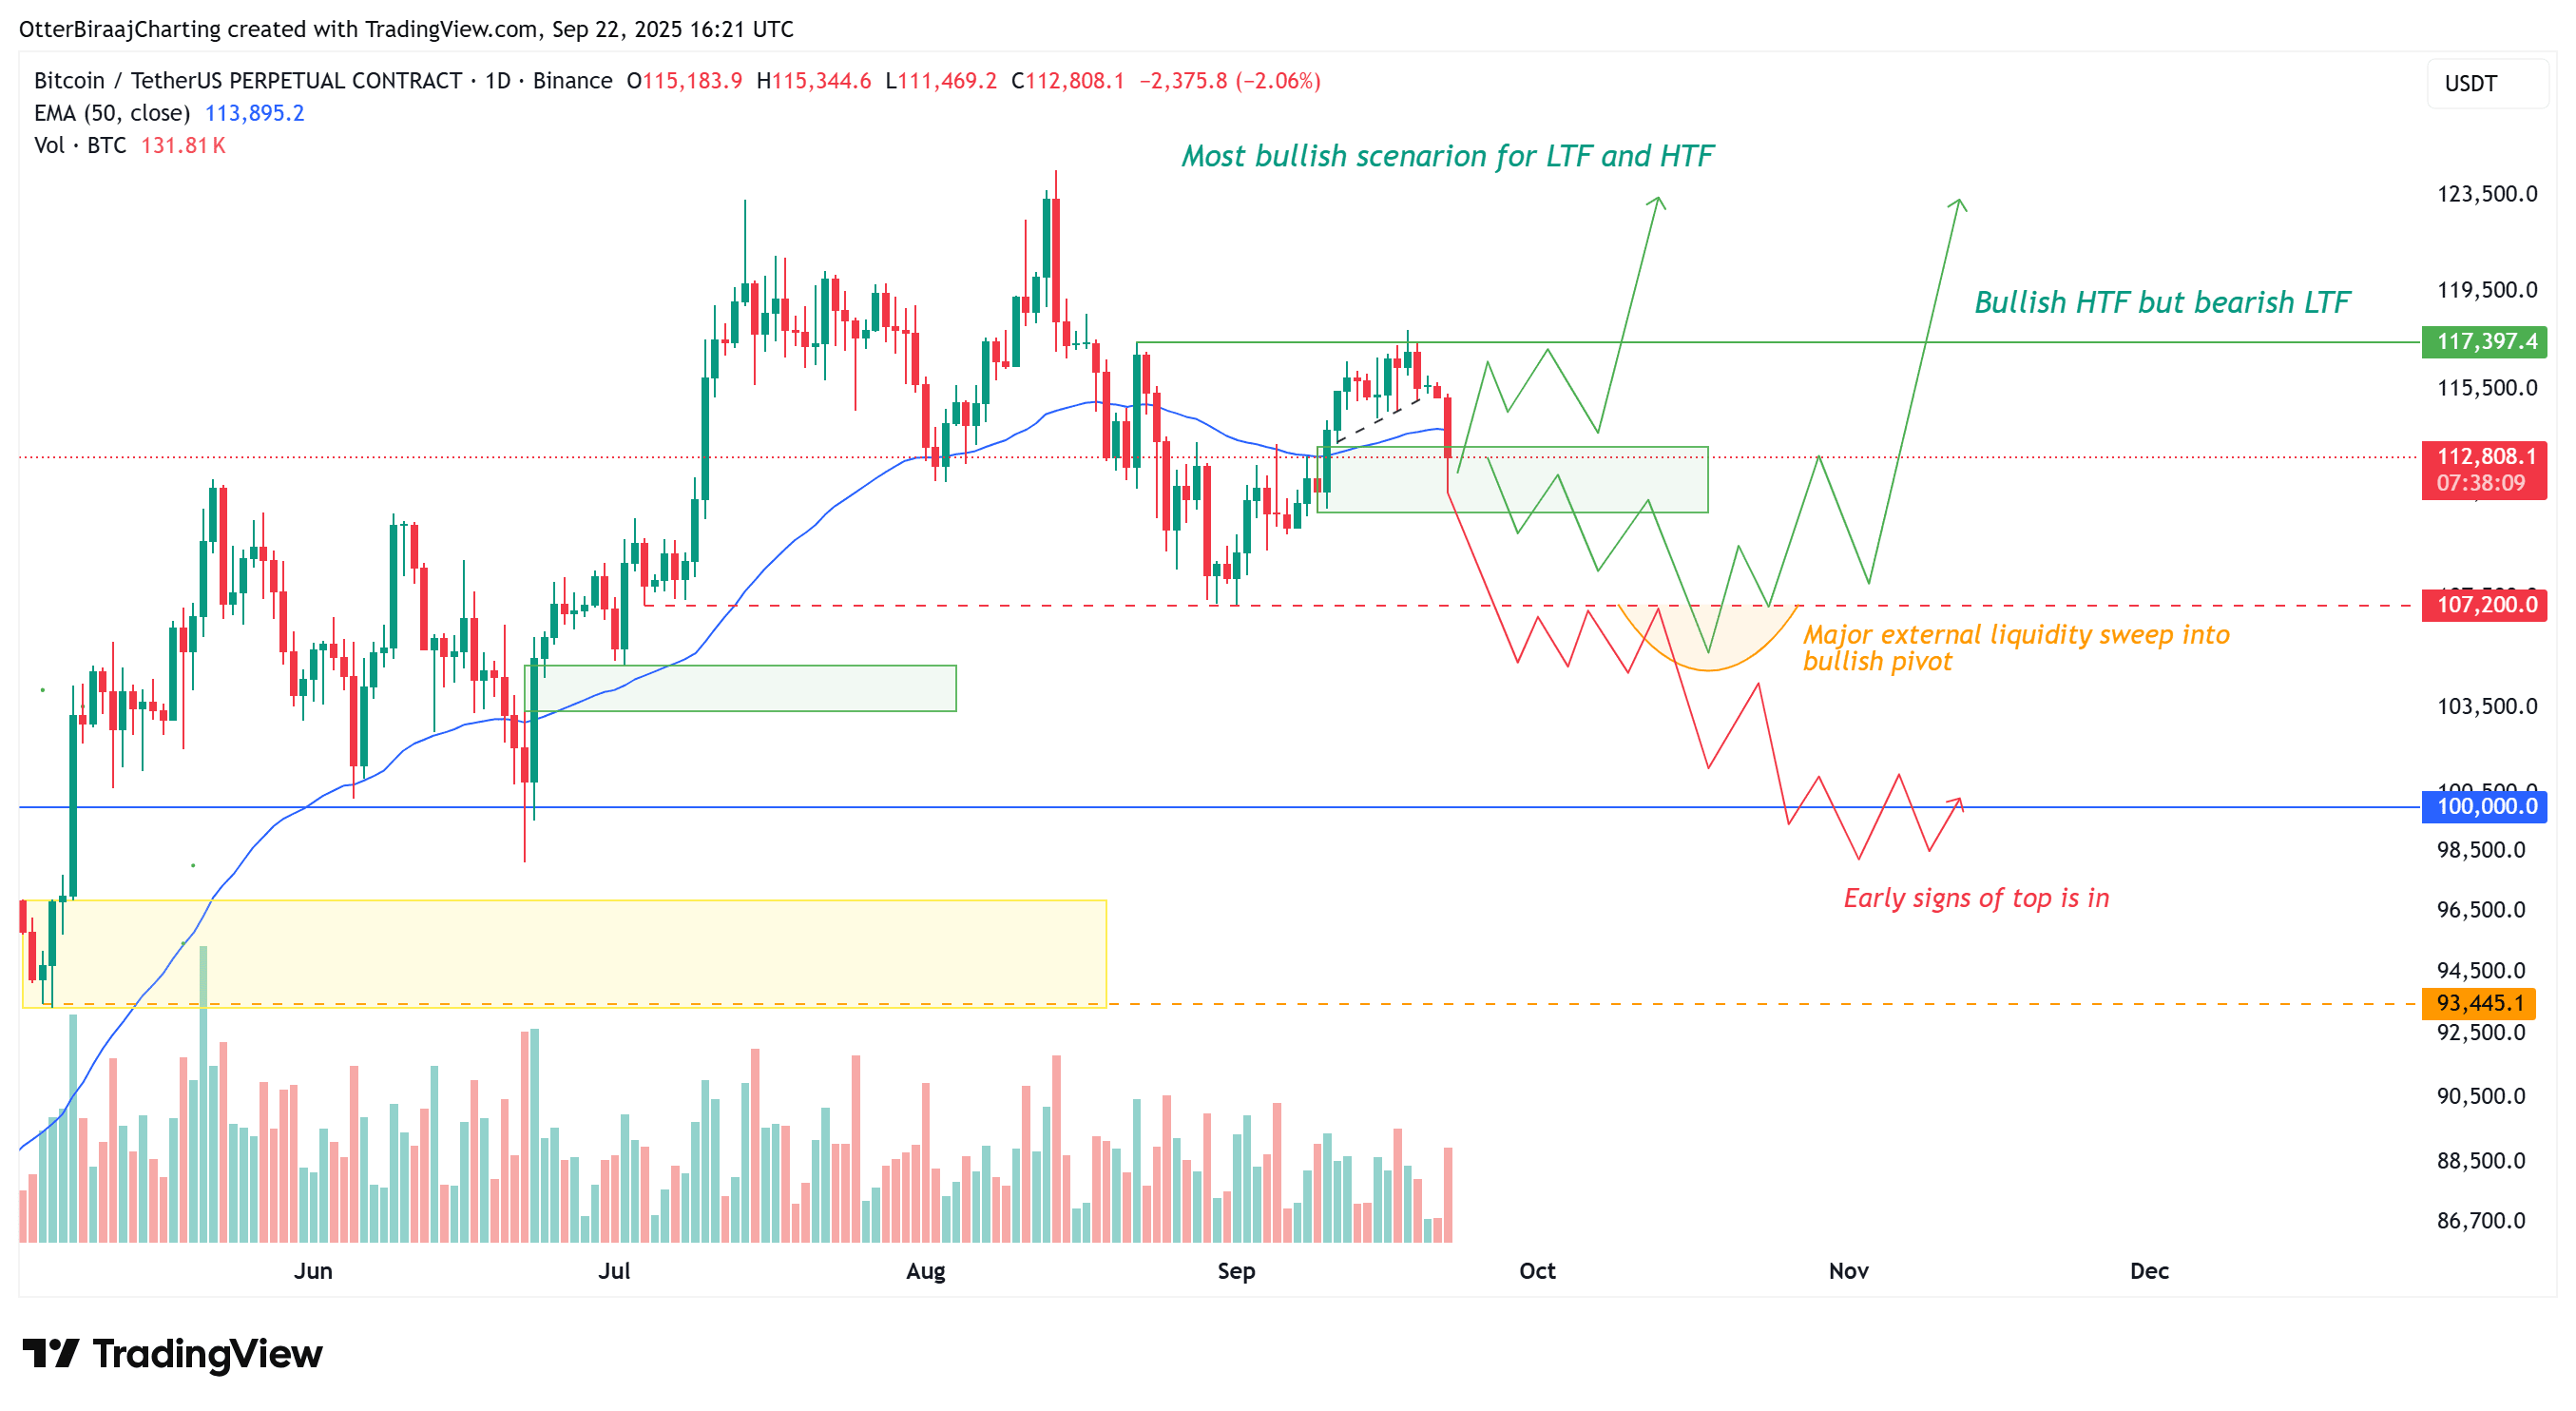
If the rebound is slow, Bitcoin may turn towards external liquidity or support near $107,200. Historically, Bitcoin has fluctuated multiple times between the high and low points of larger time frames before resuming a broader trend. Currently, over $3 billion in long positions remain exposed at this level, with a possibility of a deep liquidity test followed by a reversal to the upside. Seasonally, September has historically been bearish, making the scenario of gaining stronger upward momentum in the fourth quarter after this short-term washout reasonable.
The third and most pessimistic scenario is that the price falls below $107,200 for an extended period, possibly probing further down to $100,000. This would indicate a shift in market structure to bearish, oscillating and consolidating in lower ranges, suggesting that the current cycle has entered exhaustion.
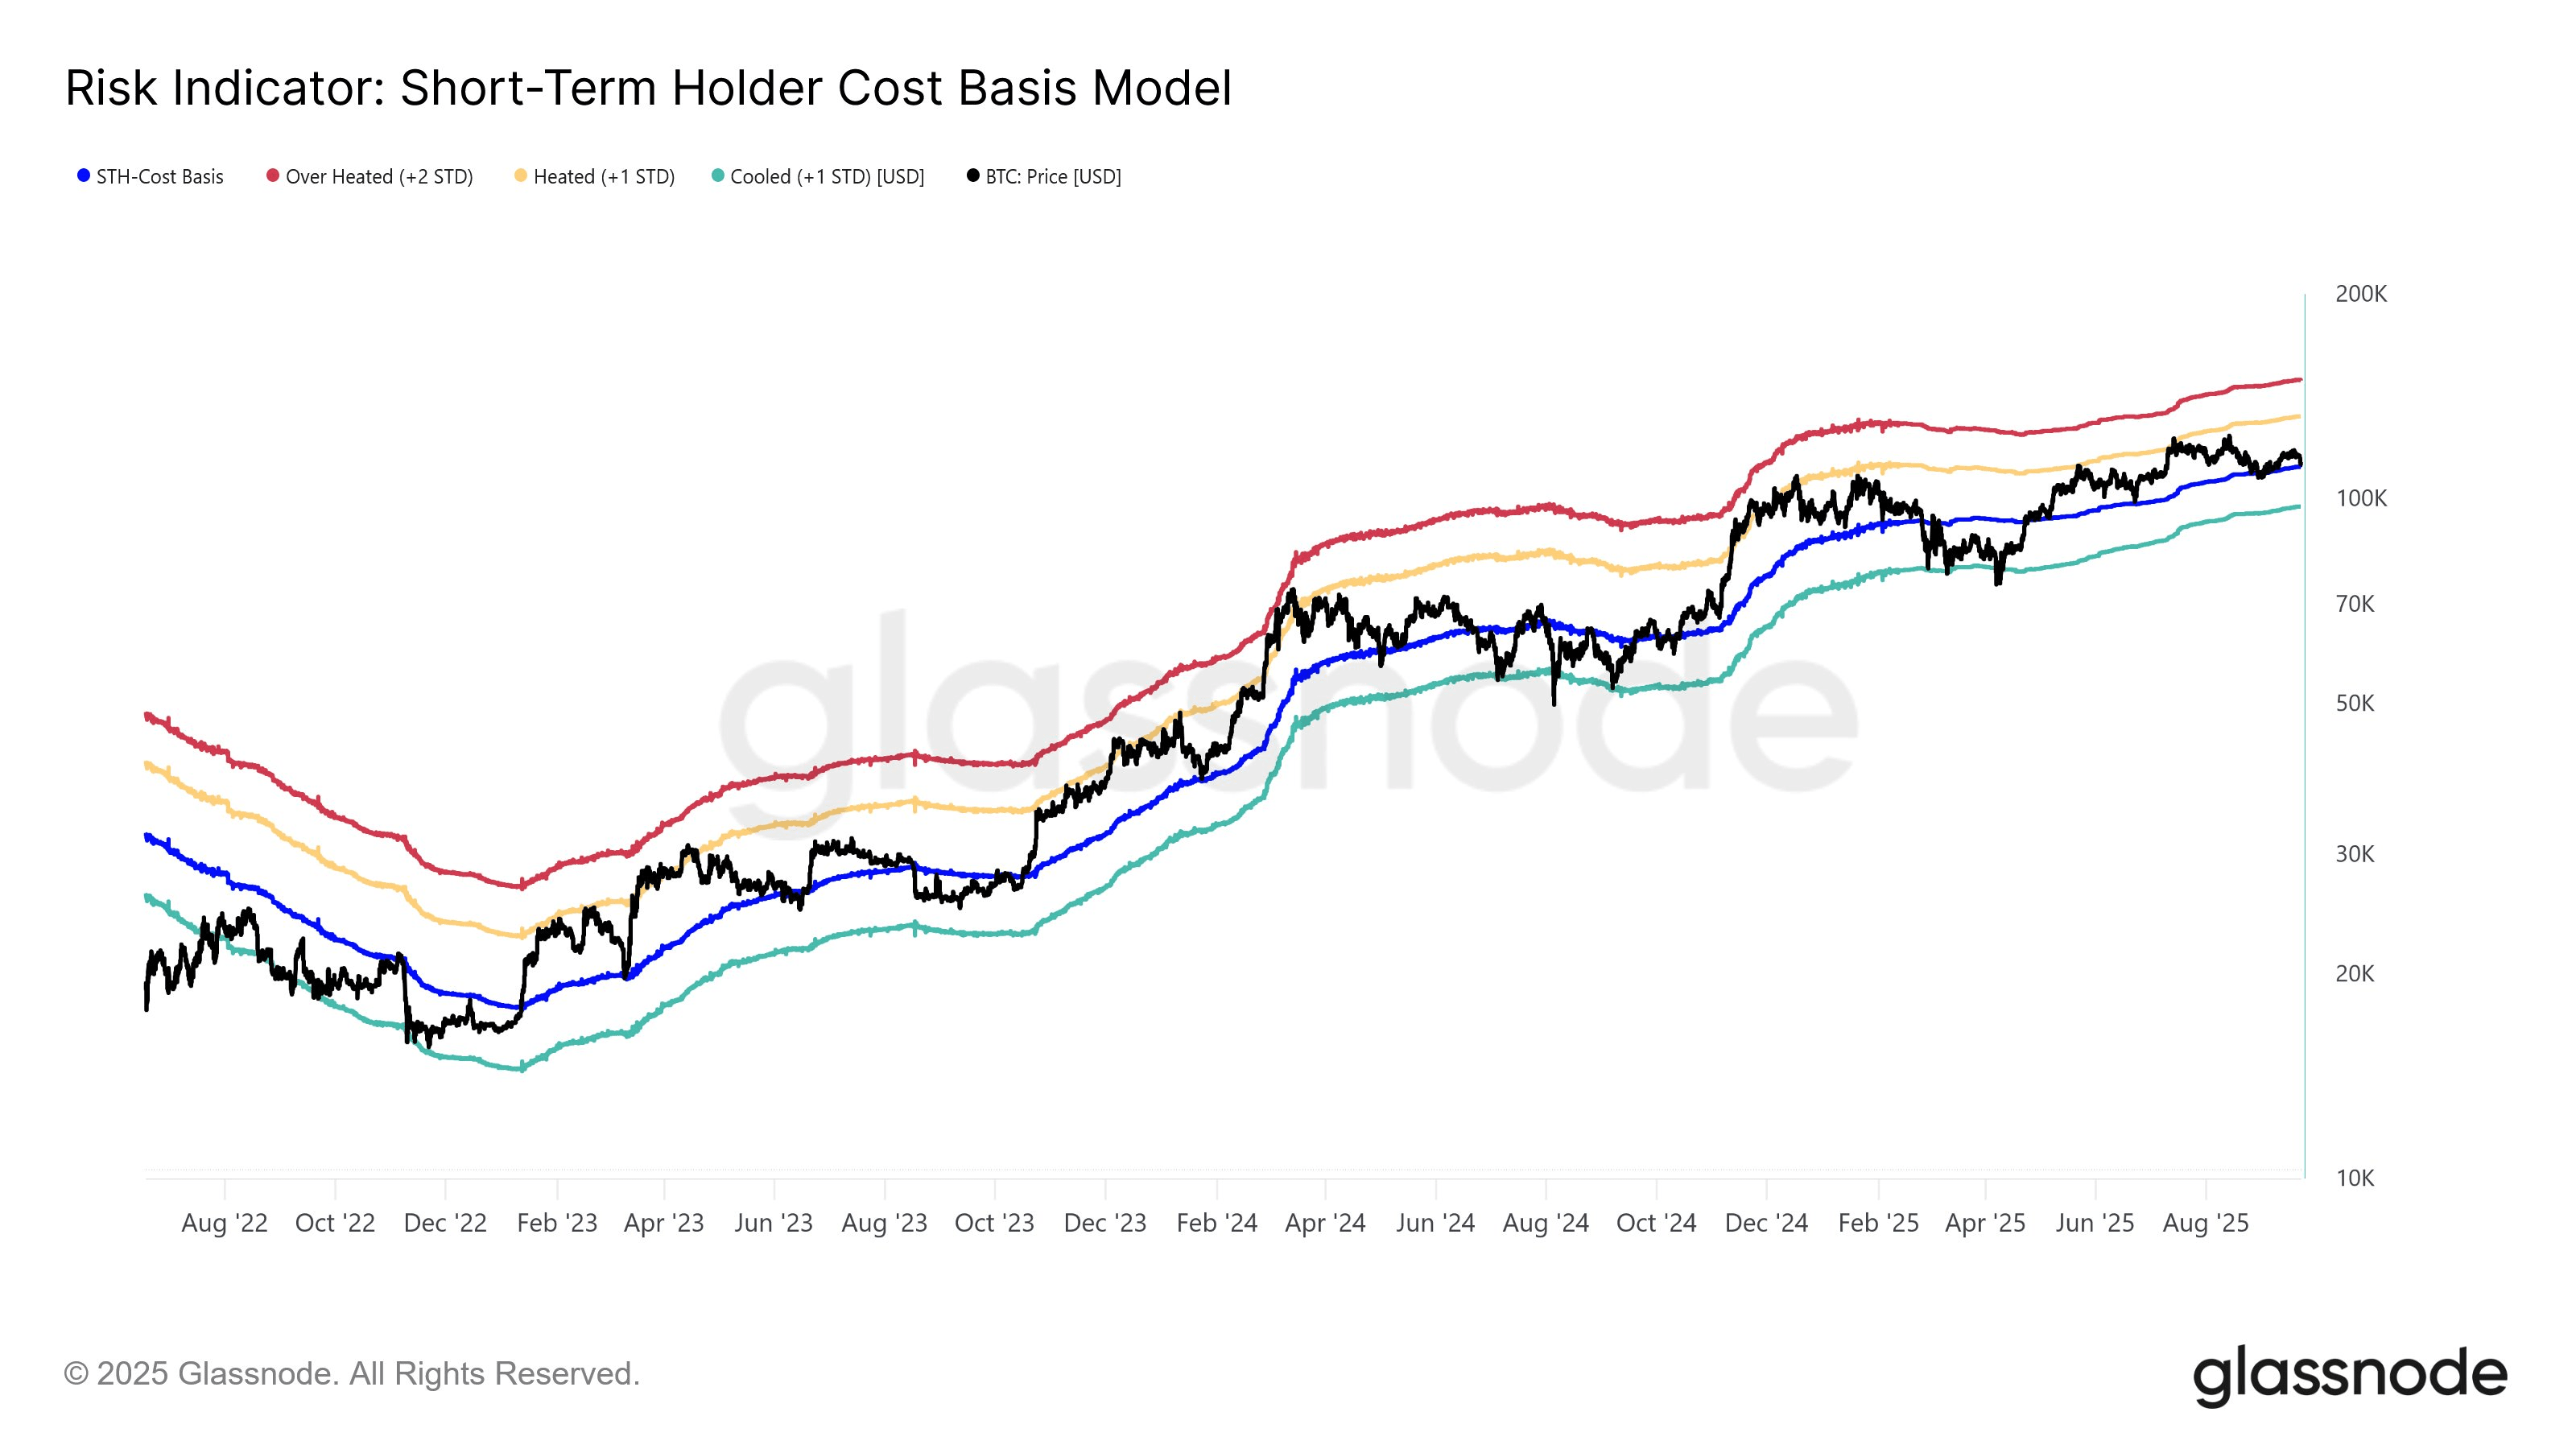
Regarding this risk, Glassnode points out that the cost basis for short-term holders is around $111,400. If Bitcoin continues to trade below this 'bull-bear boundary', it may solidify a bearish structure in the medium to long term.
Bitcoin Technical Analysis
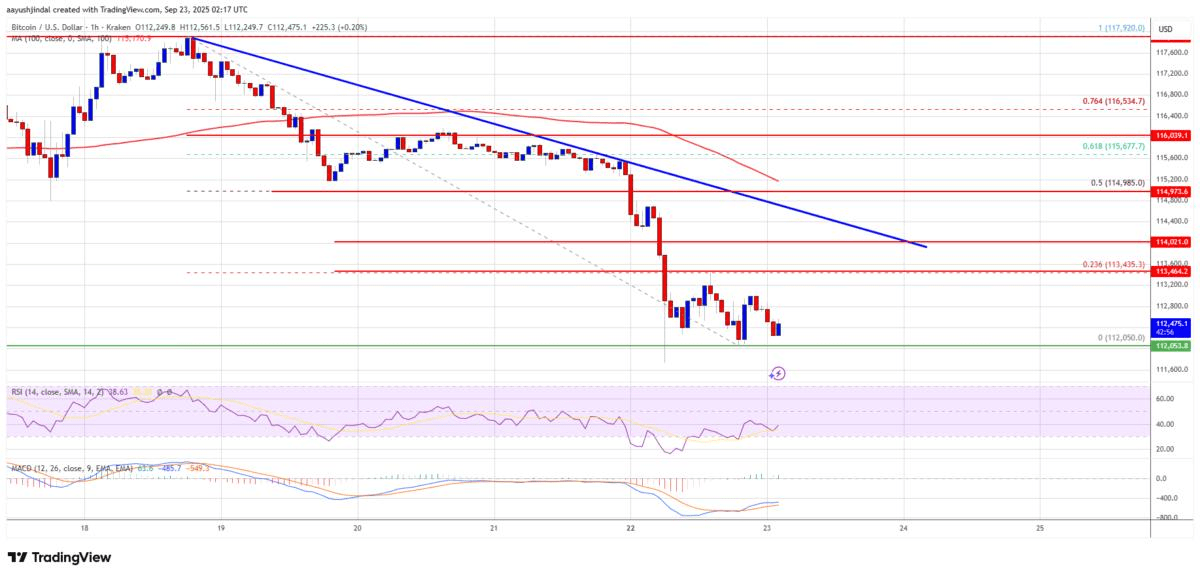
Bitcoin failed to hold the $116,500 range and initiated a new round of decline. BTC broke below the support levels at $115,500 and $115,000, entering a short-term bearish zone. The decline accelerates below $114,000, hitting a low of $112,050. The current price is consolidating below the 23.6% Fibonacci retracement level from the low of $112,050 to the high of $117,920.
Bitcoin is currently reported below $113,500 and the 100-hour moving average. Furthermore, a descending trend line with a resistance level at $114,000 is forming on the BTC/USD hourly chart.
The direct resistance on the upside is near $113,450. The first key resistance level is at $114,000 and the trend line position. The next resistance may be at $115,000 or the 50% Fibonacci retracement level of the drop from the low of $112,050 to the high of $117,920. If the closing price breaks the $115,000 resistance, the price may rise further. In this case, BTC could rise to the $116,500 resistance level, and if it continues to rise, the next resistance may be at $116,800, followed by $117,250.
On the downside, if Bitcoin fails to break the $114,000 resistance zone, it may initiate a new round of decline. Direct support is near $112,000, with the first major support at $111,250. The next support is in the $110,500 area. If it continues to decline, the price may test the $108,800 support in the short term. The main support level is at $107,500, and if broken, BTC may gain stronger bearish momentum.
Technical Indicators:
Hourly MACD: Currently accelerating in the bearish zone.
Hourly RSI (Relative Strength Index): The RSI for BTC/USD is currently below 50.
Major support levels: $112,000, followed by $111,250.
Major resistance levels: $114,000, followed by $115,000.

