Solana ($SOL ) has been consolidating lately, with little weekend movement on the smaller time frames. That’s why today, we’re shifting focus to the larger time frame chart—and it’s looking increasingly interesting.
🔎 The 365-Day Return Indicator
I’ve been tracking an indicator that compares Solana’s current price to where it was exactly one year ago.
It highlights overheated zones and buy zones.
The last major buy zone appeared back in March–April, when SOL also had a bullish setup.
What’s fascinating is how rallies keep getting capped below a trend line on this indicator.
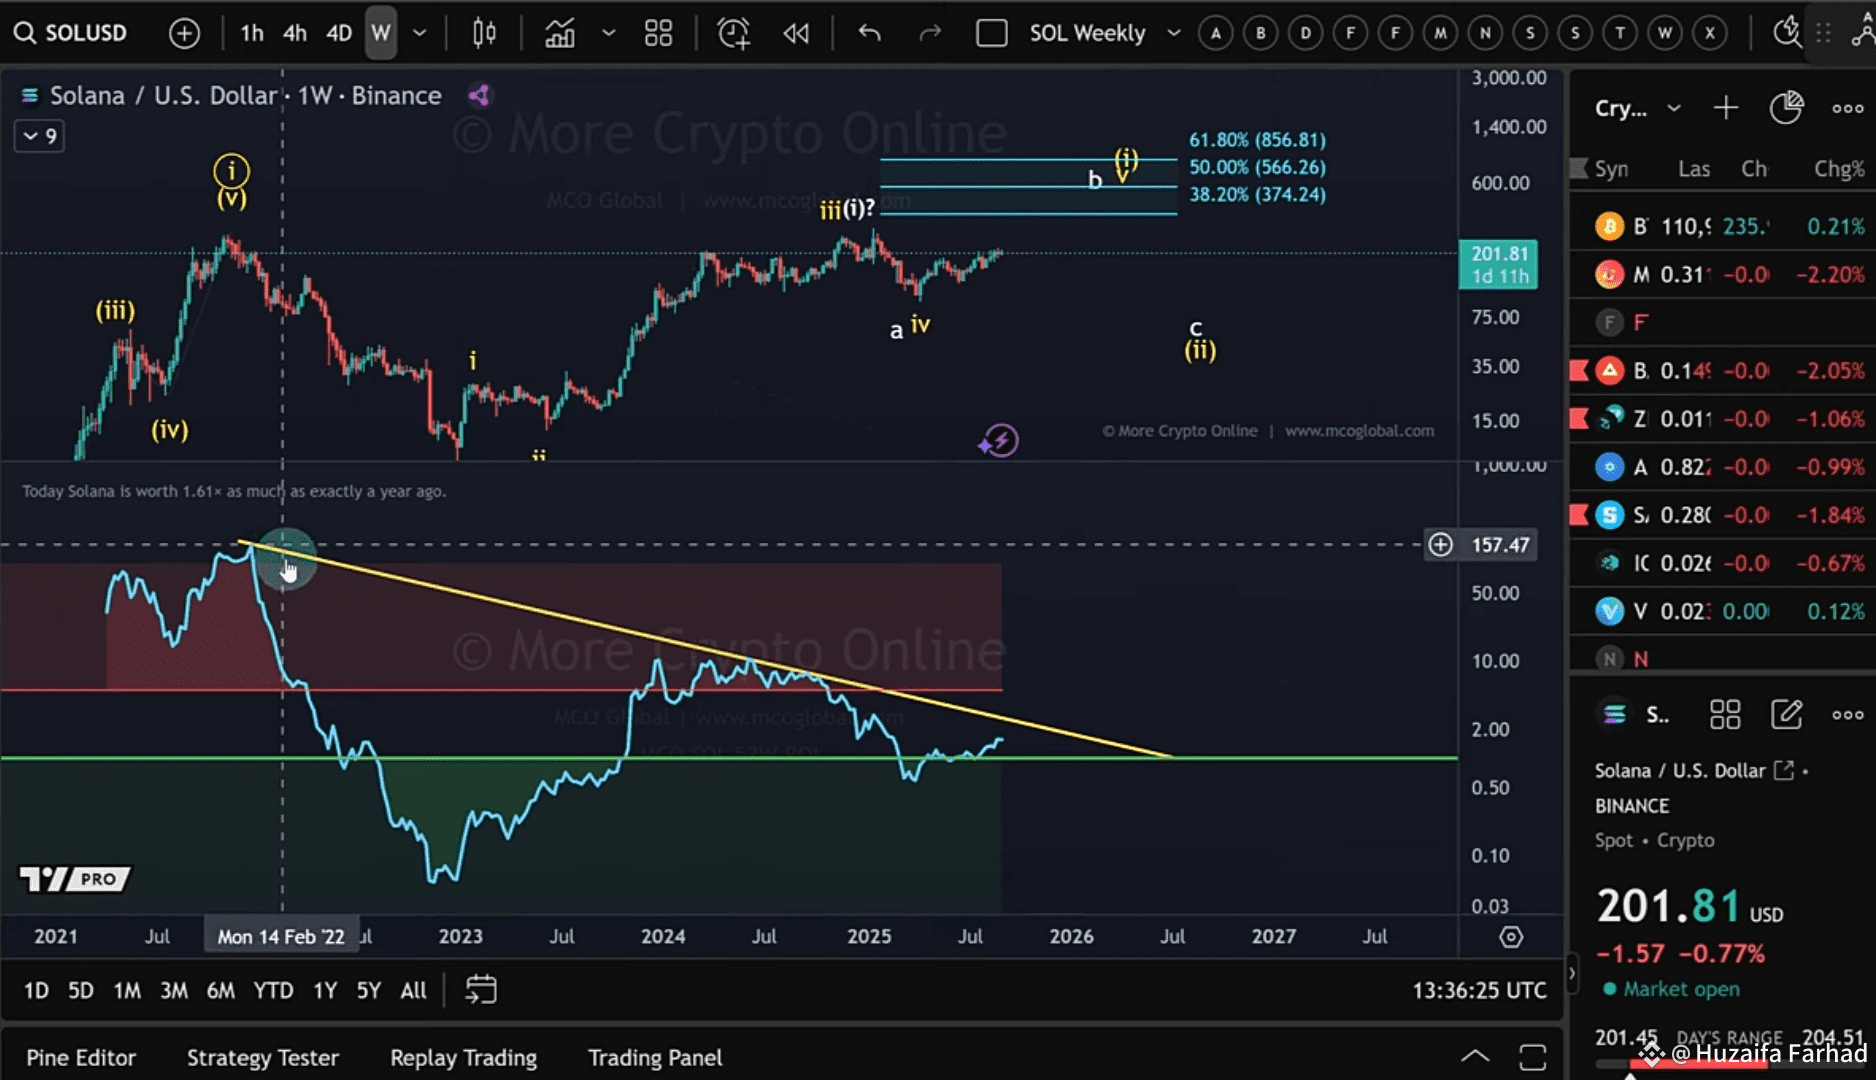
This trend line has 3 to 5 touch points, depending on how you count the smaller taps. Historically, momentum indicators like RSI also create meaningful trend lines—and this one is coming in around 2.5.
Currently, $SOL sits at 1.66. If price trends toward 2.4–2.5, that could line up with a key resistance zone.
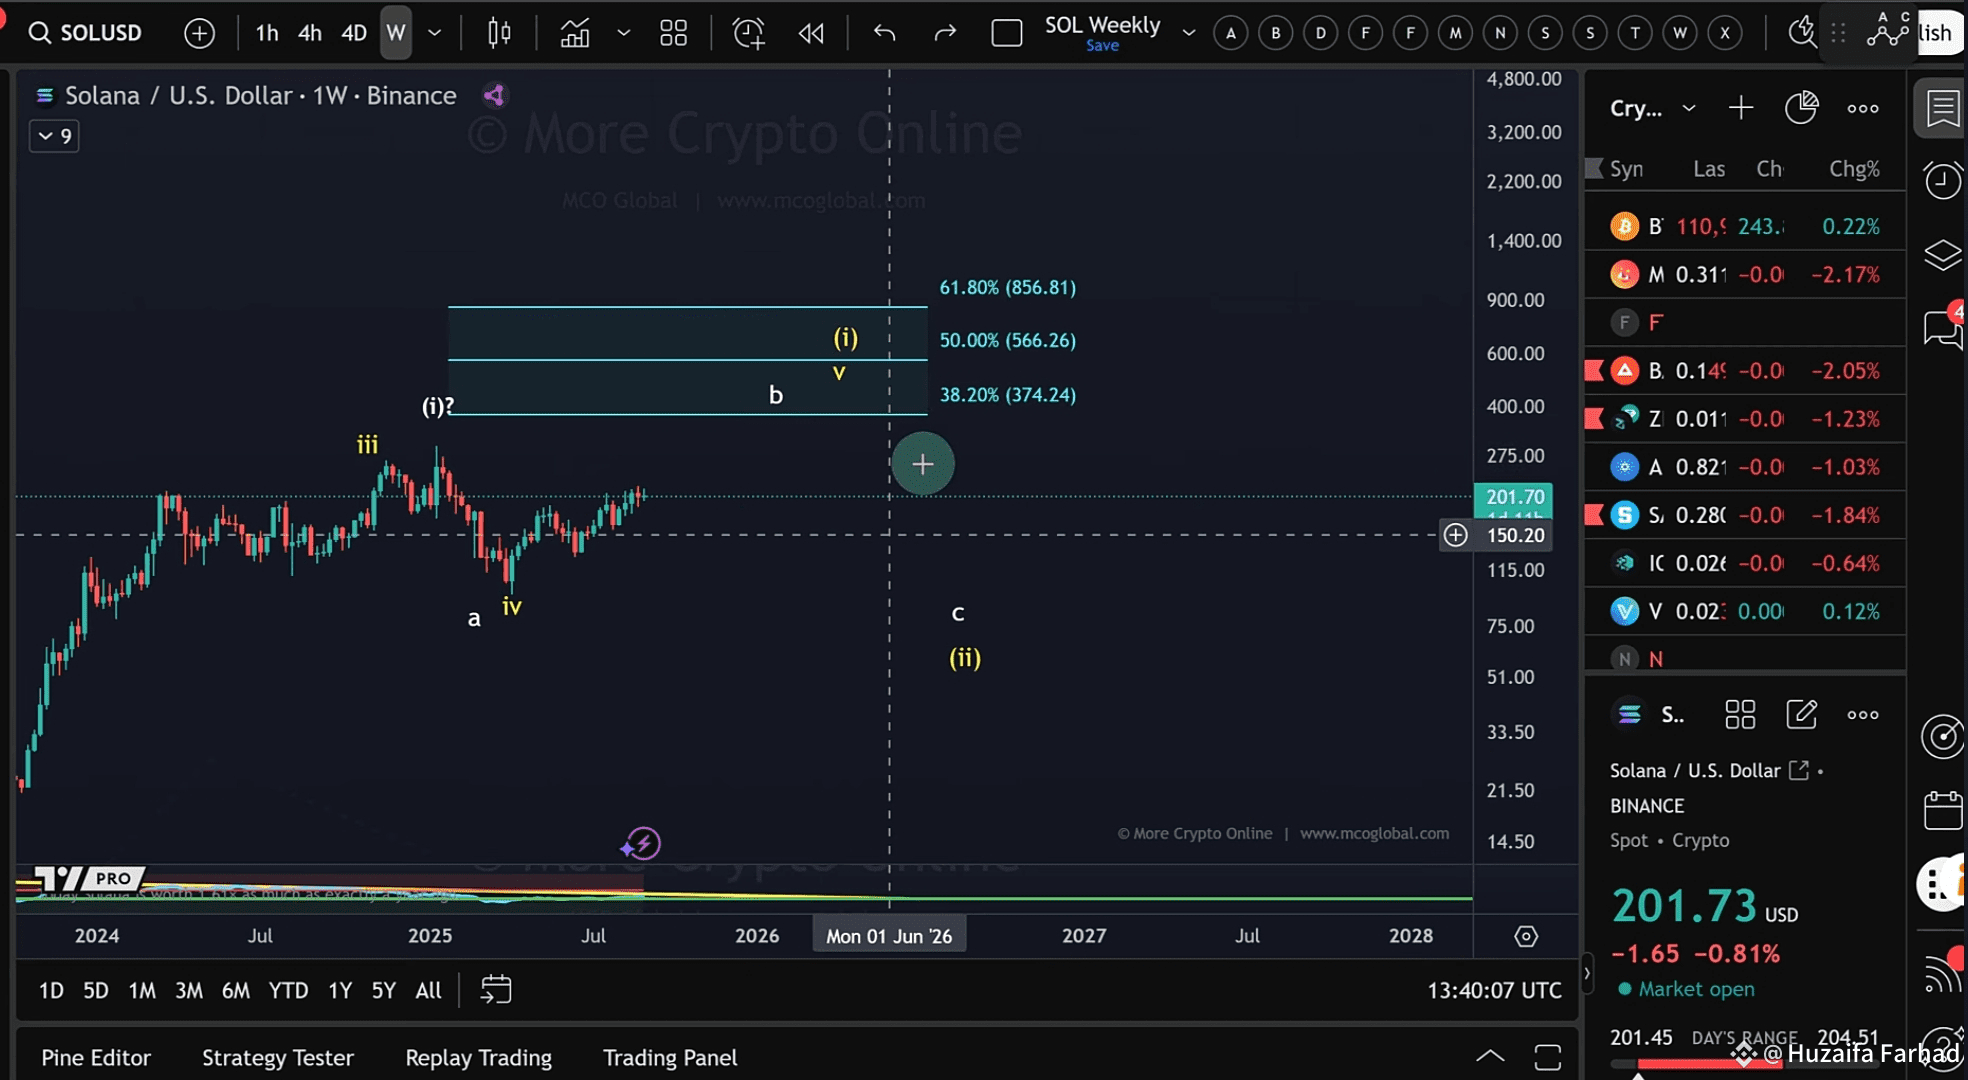
🌀 Elliott Wave Perspective
From an Elliott Wave standpoint, Solana’s structure allows for two possible scenarios:
1. White Scenario – The cycle has already topped.
Current move is a B-wave rally.
B-wave could overshoot before a C-wave correction.
This correction might revisit $20–$30, though it could also hold above the April low.
2. Yellow Scenario – One more high before this cycle ends.
This would complete a five-wave sequence.
Potential target: $360–$380.
🎯 Key Levels to Watch
$360–$380: Multiple Fibonacci confluences align here.
365-Day Return @ 2.5: Historically a resistance zone.
Q4 Outlook: September may be the “calm before the storm.”


