Bitcoin continues to trade in a tight range, hovering just below key resistance on the lower time frames. While the move from the September 1st low has been constructive, it still looks more corrective than impulsive. Let’s break down the bigger picture, the shorter-term structure, and what to watch heading into Q4.
🔹 Key Support & Resistance Levels
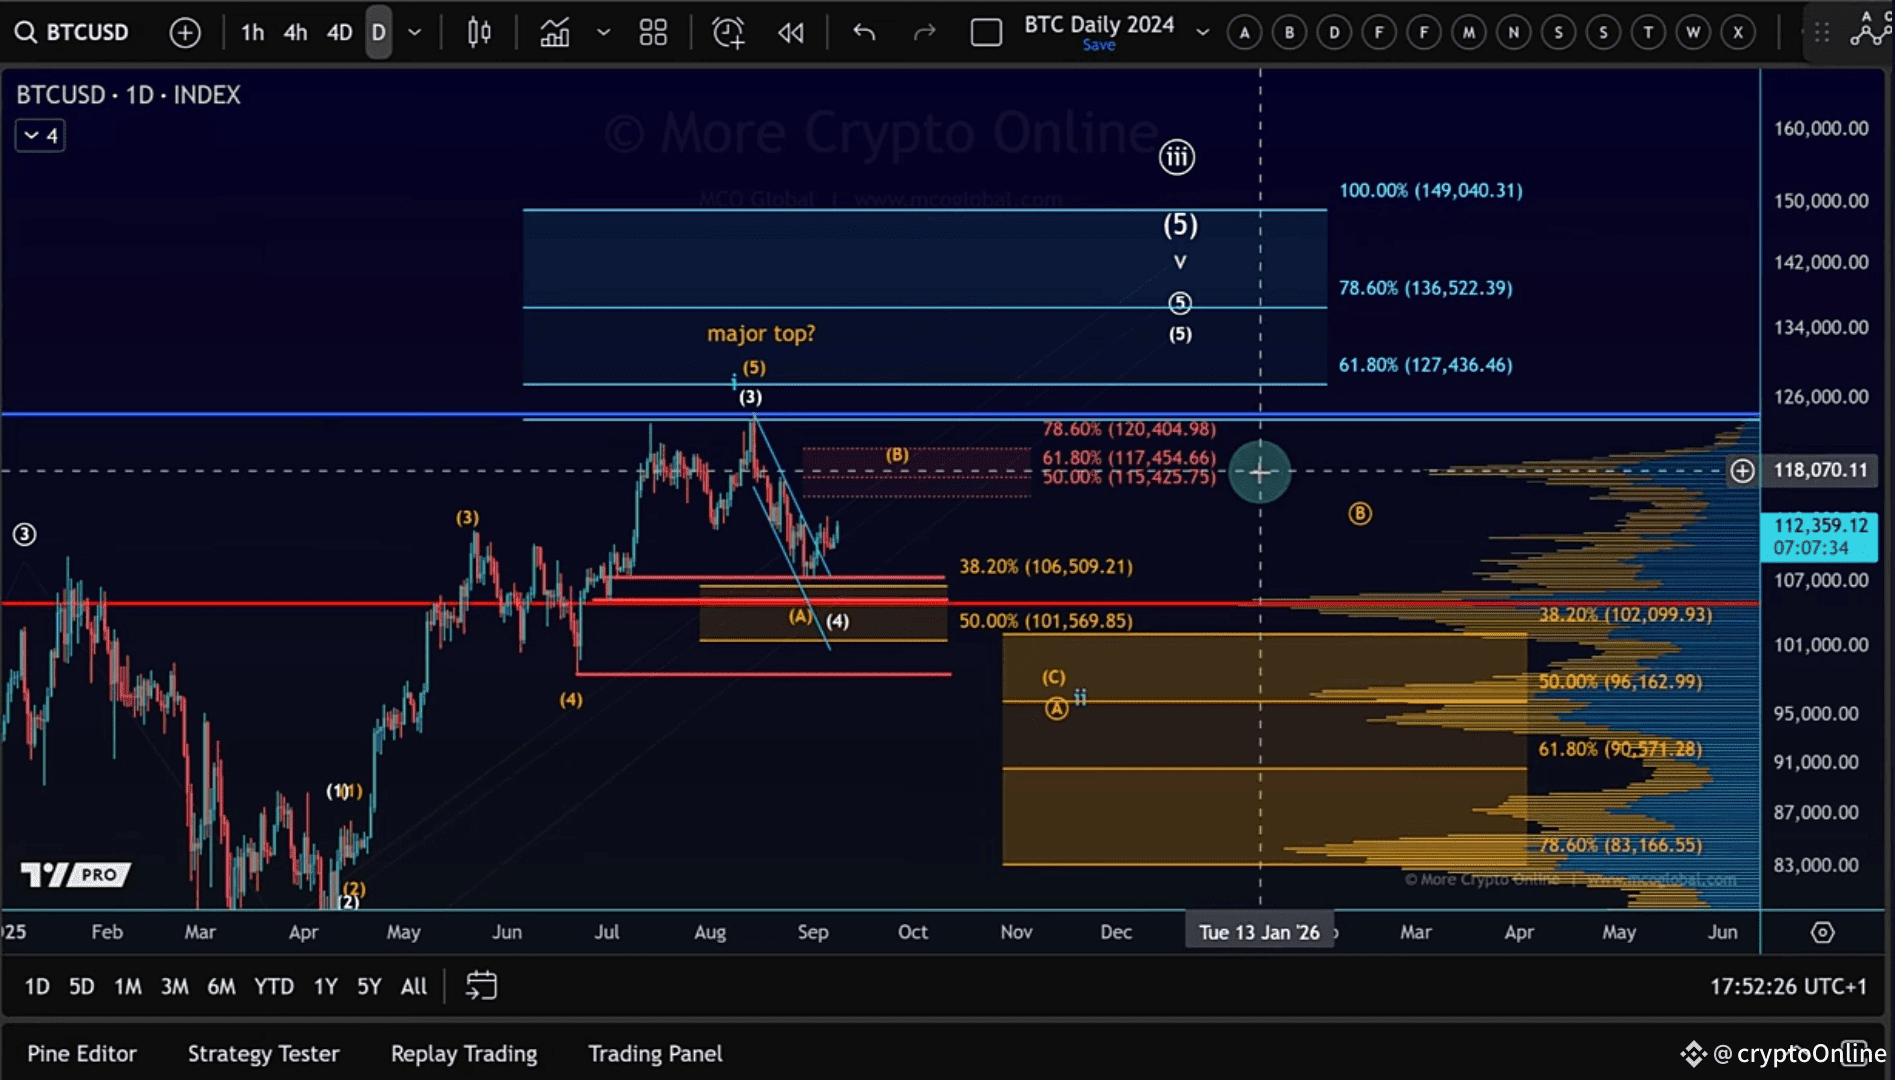
Support zone (this week): $101,569 – $106,590
Resistance zone: $115,425 – $120,400
Liquidity hotspot: Around $118K, highlighted by the VRVP indicator and multiple heatmaps.
🔹 Has Bitcoin Already Found a Low?
Historically, September is a weak month for Bitcoin, often producing cycle lows.
October, on the other hand, tends to ignite rallies.
While it’s possible the September 1st low was “the low,” there’s not enough evidence yet to confirm it.
The bounce since September 1st still looks corrective rather than impulsive.
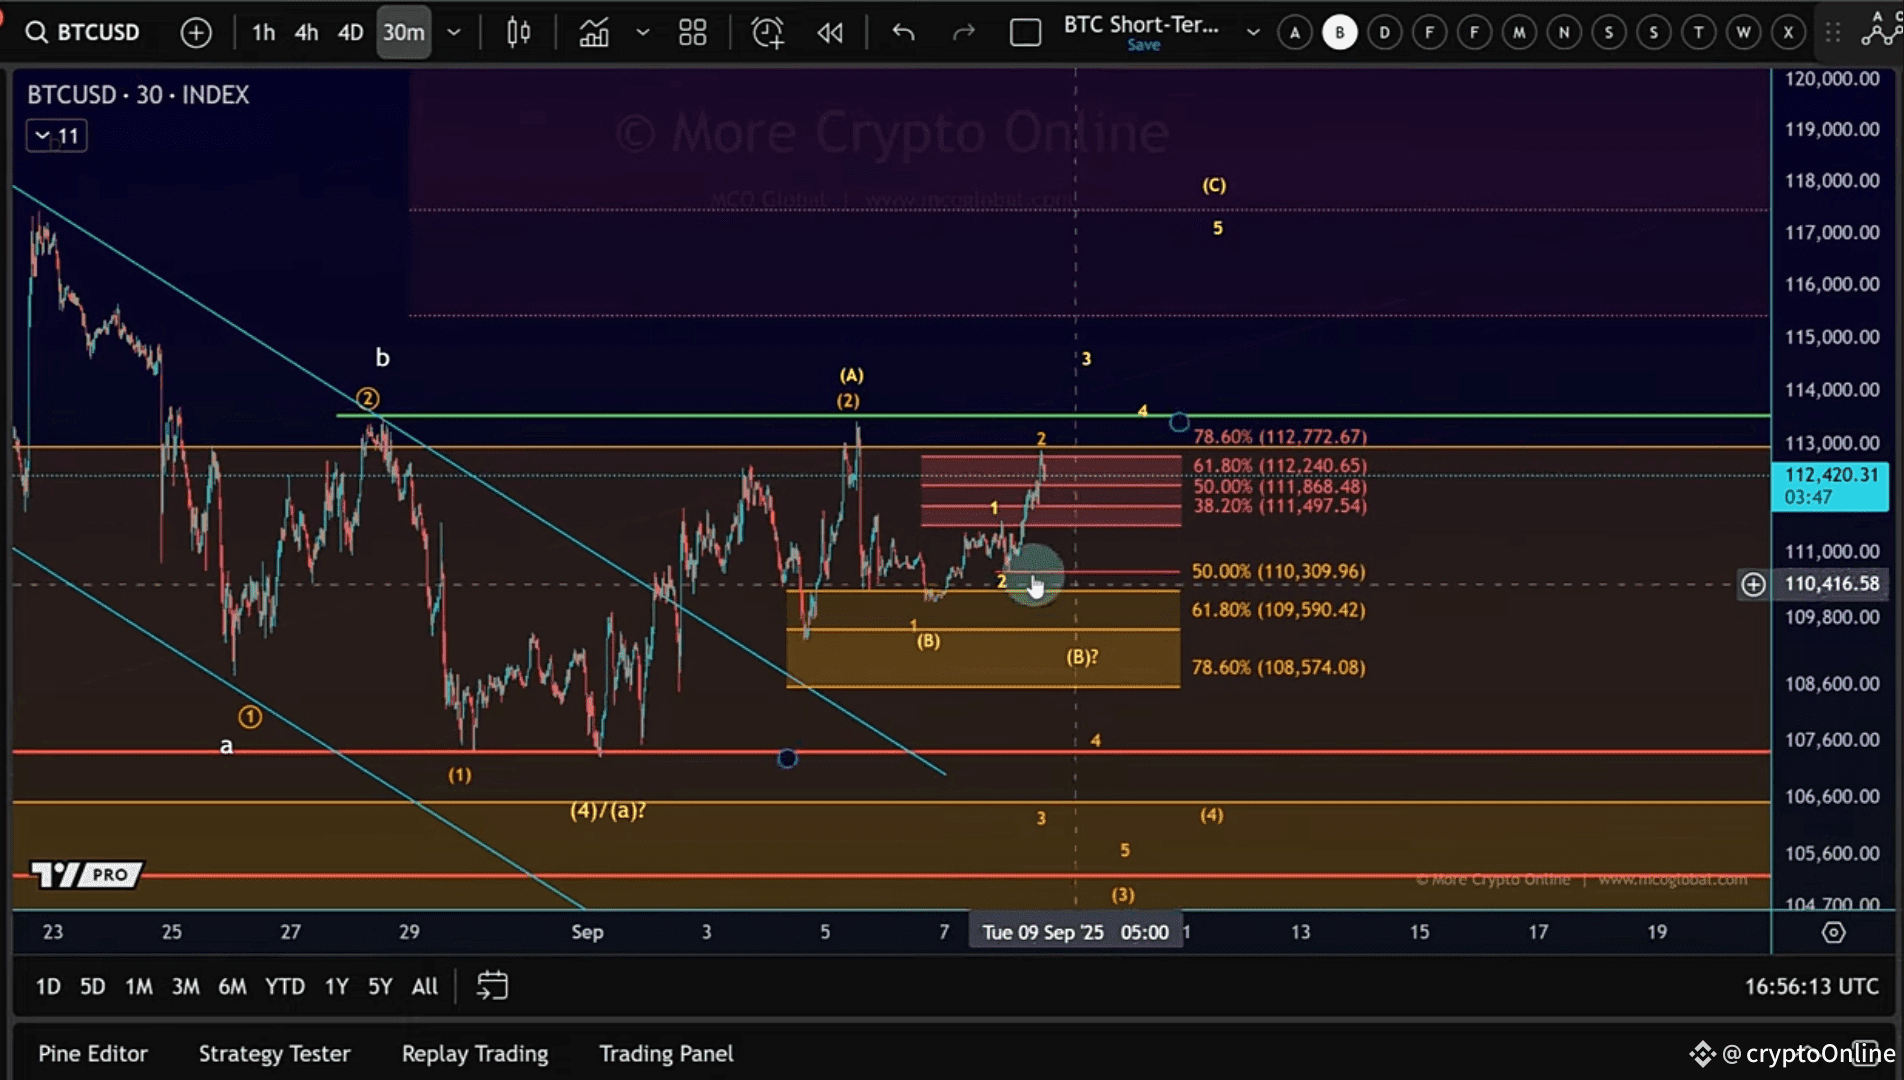
🔹 Short-Term Structure (30-Minute Chart)
Bitcoin is currently holding above Fibonacci support but below micro resistance.
Local resistance: $112,770 – $113,500
Breaking these opens the door toward $118K.
For now, Bitcoin is stuck in a range, waiting for a decisive breakout.