Solana is once again at a critical juncture. On the daily timeframe, $SOL continues to move within the ascending wedge pattern we’ve been tracking for several weeks. While this pattern often breaks to the downside, we’ve yet to see any decisive move either way — the structure is still intact.
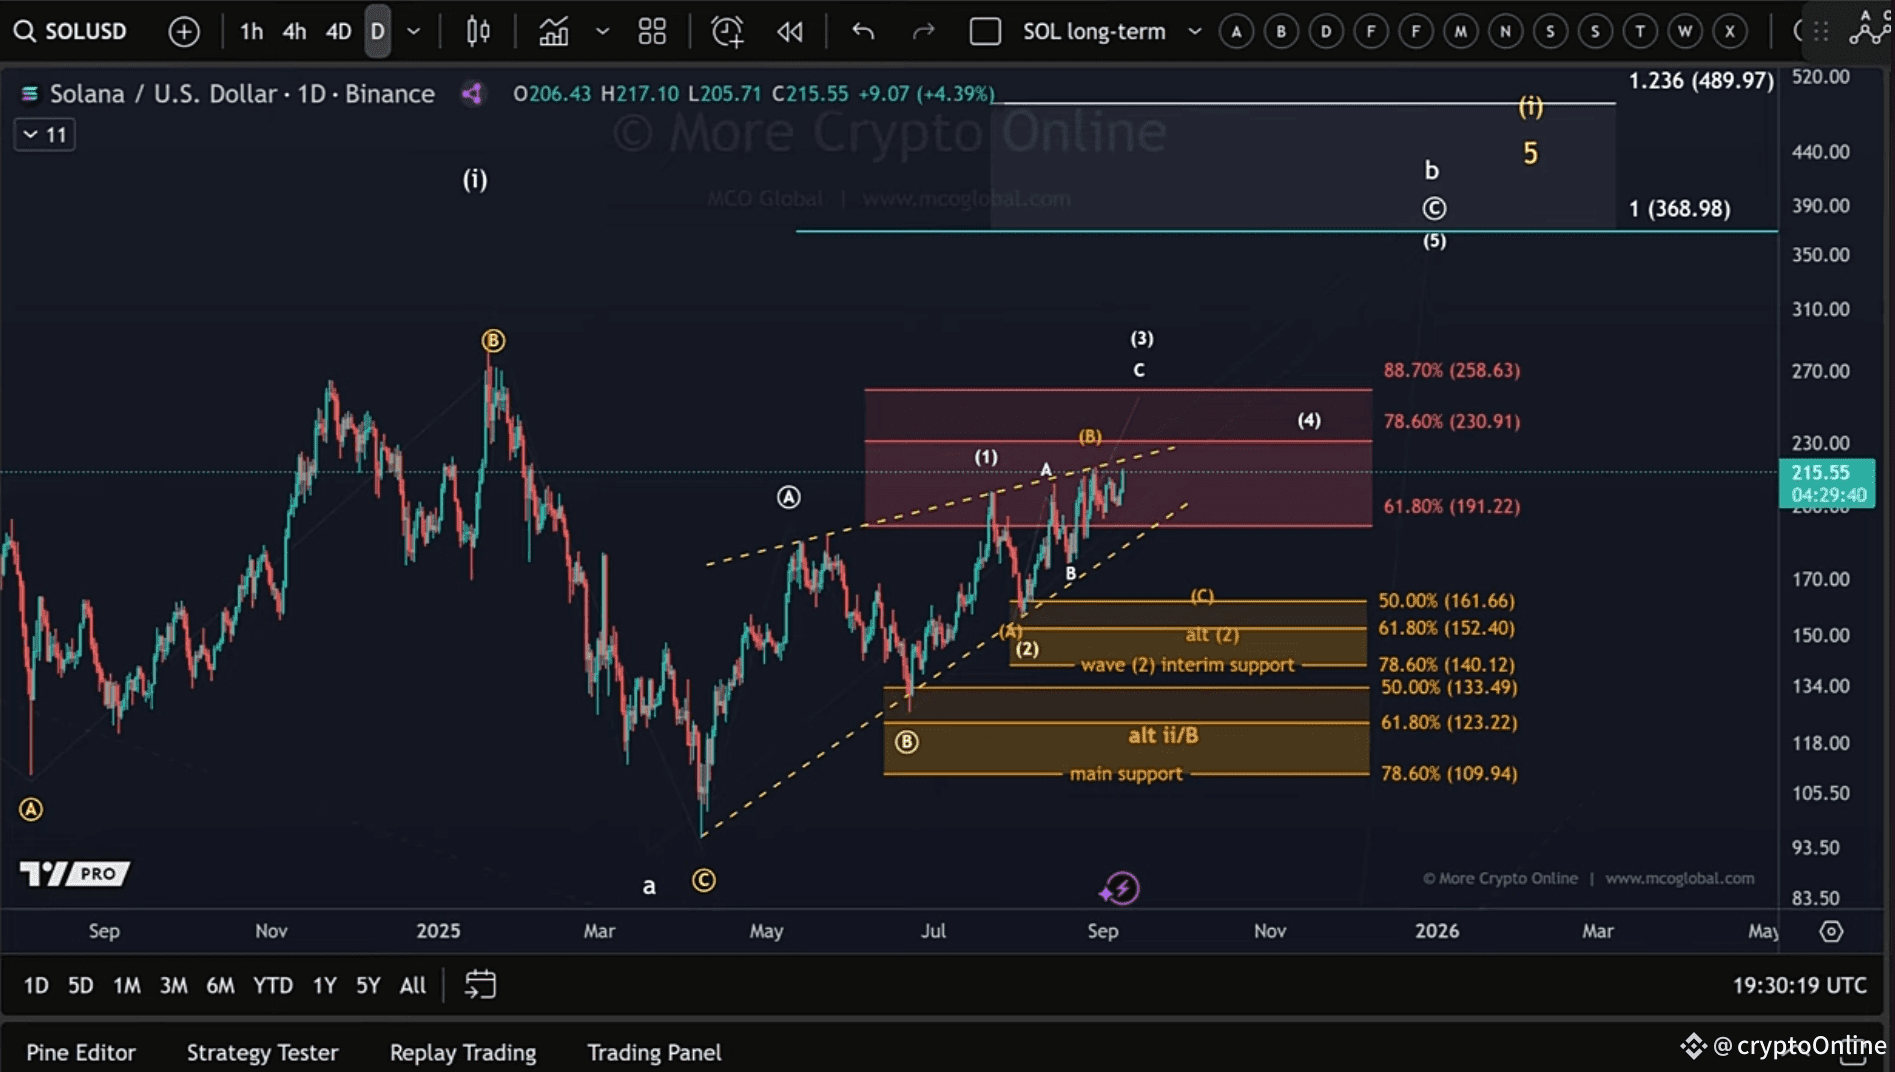
Current Situation on the Daily Chart
The uptrend remains intact no support levels have been broken.
Solana is closer to the upper boundary of the wedge rather than the lower one.
Concerns about this being a leading diagonal seem unlikely, since the initial wave up looks more like a 5-wave move rather than corrective 3-wave structures.
As long as we don’t break below upper micro support, there’s no evidence that a top has formed.
If Solana breaks below the wedge’s lower boundary, probabilities increase that we’ll test the first daily support zone between $140 – $161. While this is not the preferred scenario, it’s a valid alternative.
The preferred scenario remains bullish:
A potential wave 3 move higher, followed by wave 4 and 5.
Upside targets: $360 – $380.
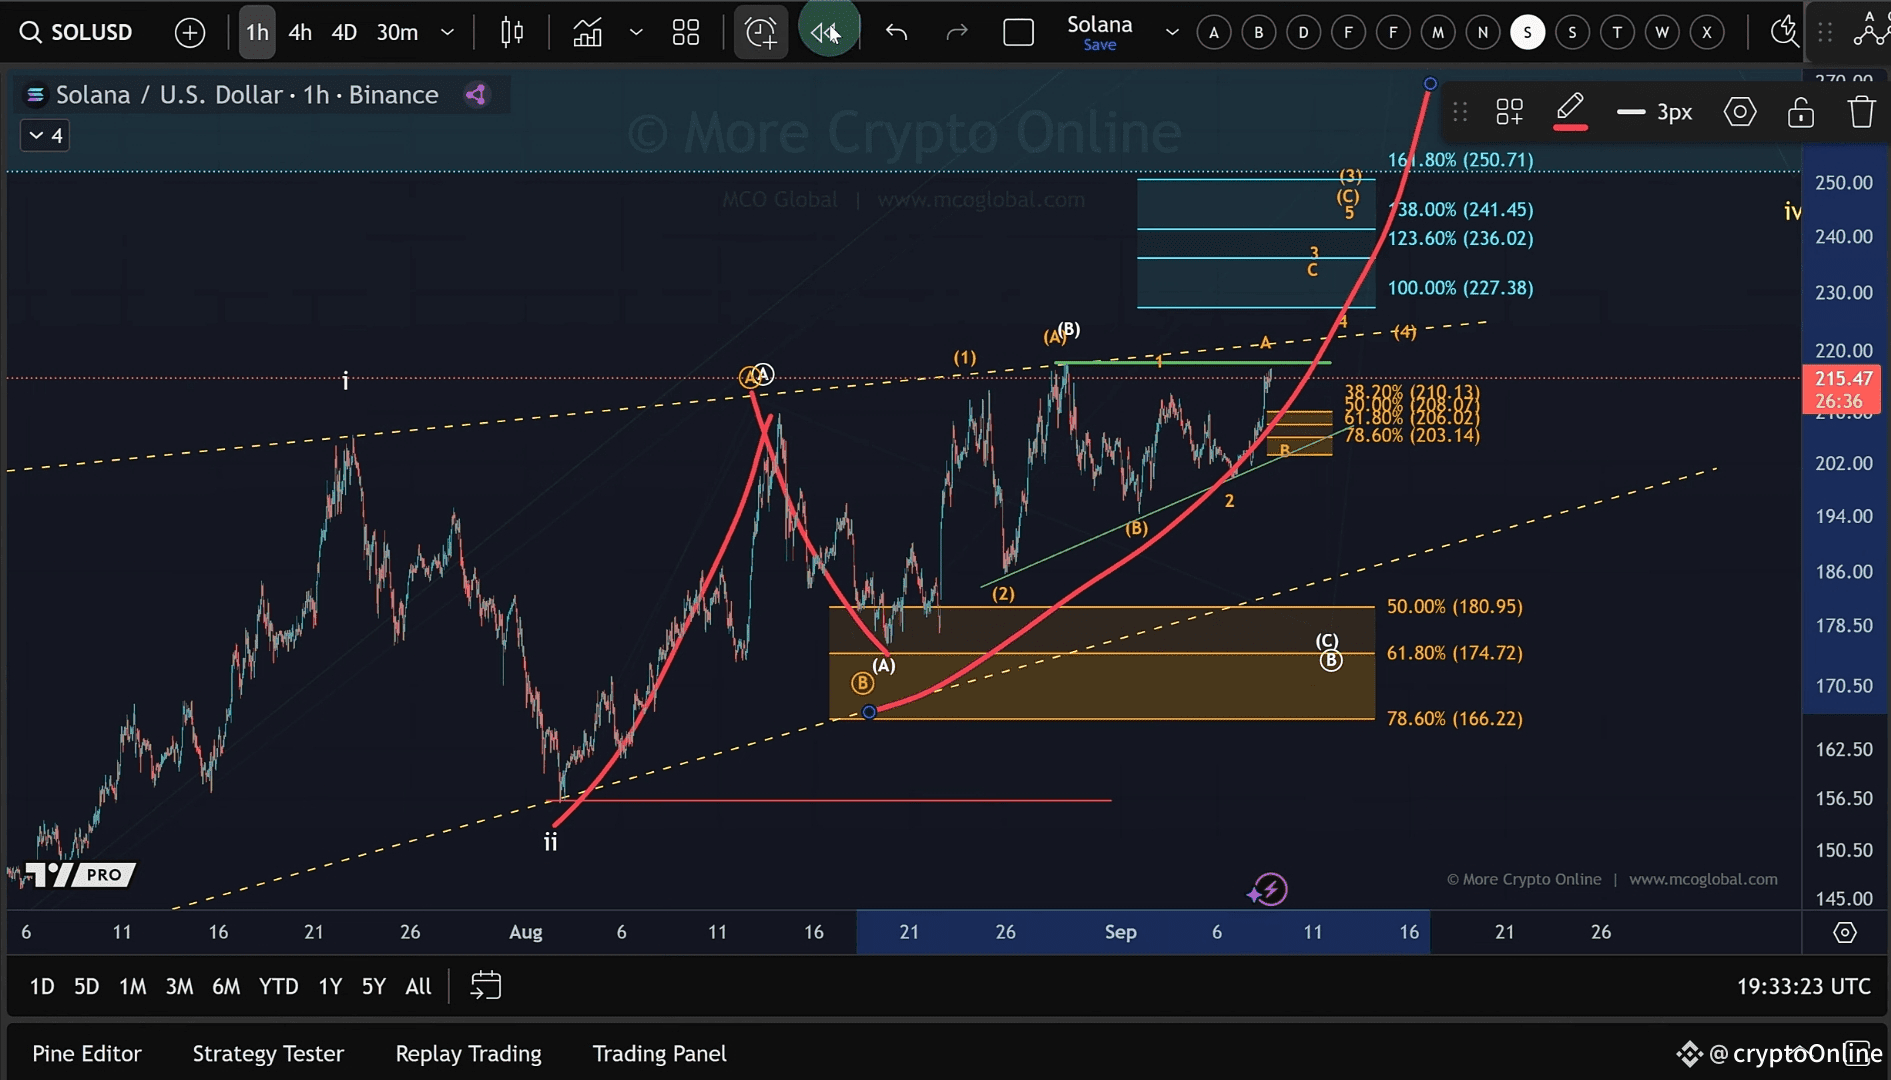
Zooming Into the Short-Term Chart
Switching to the 1-hour timeframe, we’ve been following the thesis that wave 2 bottomed on August 2nd. Since then, the market has moved upward in ABC structures.
Wave A looks completed.
Wave B may already be in, or still unfolding as an ABC.
That leaves us with Wave C up as the next move.