---
🚨 MOCA/USDT 4H Technical Analysis Update 🚨
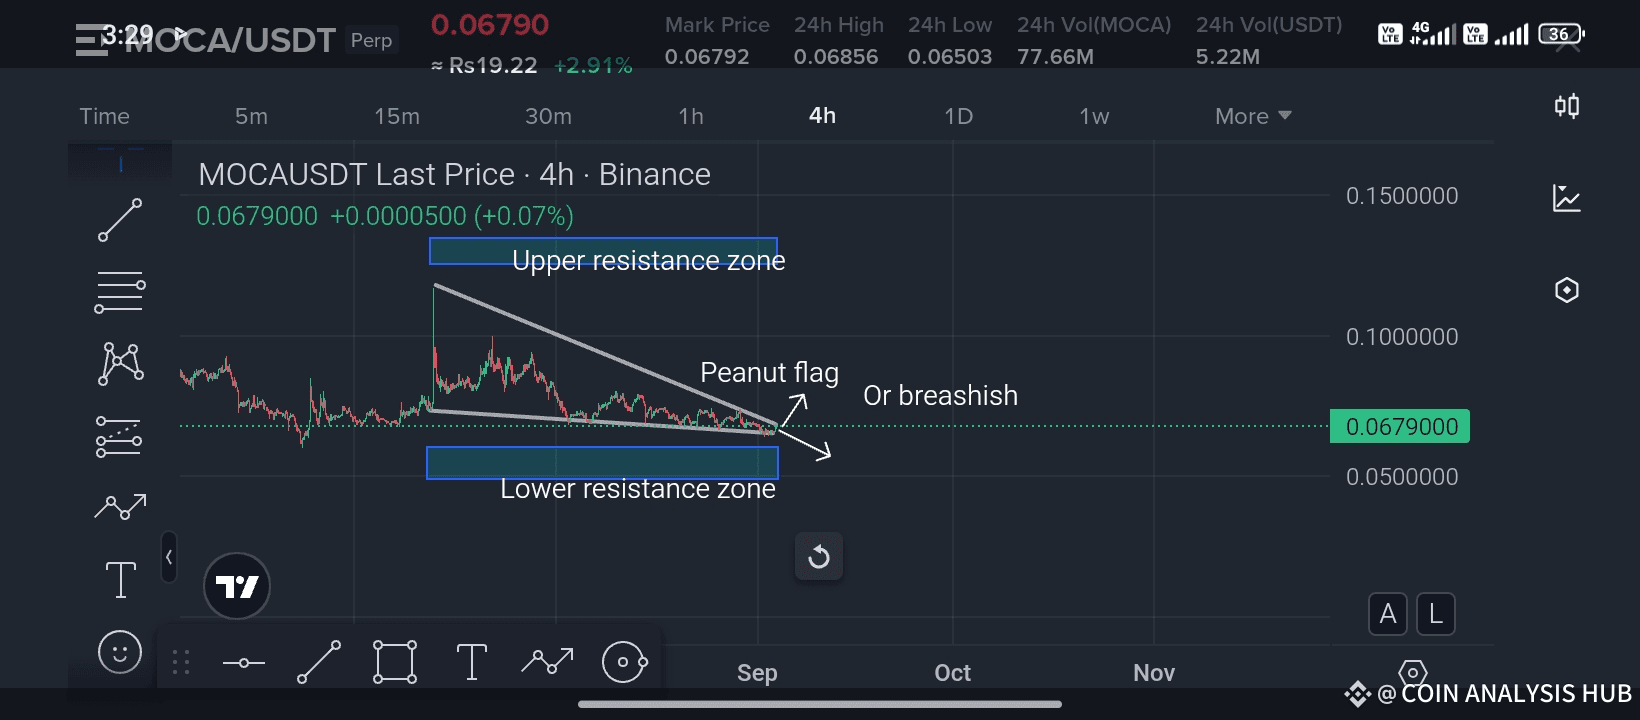
Currently, MOCA/USDT is trading around 0.0679 USDT, and price action has formed what looks like a “Peanut Flag” structure (a type of consolidation pattern). This zone is very crucial because the market is tightening and preparing for a potential strong breakout or breakdown.
🔹 Key Observations (4H timeframe):
Upper Resistance Zone: Around 0.10 – 0.15 USDT, this is where sellers have historically stepped in with heavy supply.
Lower Support Zone: Around 0.05 – 0.06 USDT, a strong demand area where buyers previously defended the price.
Current Setup: The price is compressing between the two zones, moving inside a descending wedge/flag pattern. This indicates indecision, but soon a decisive move is likely.
📊 Possible Scenarios:
1️⃣ Bullish Case: If price breaks above the flag and holds above 0.072 – 0.075, it can test the upper resistance zone again. A successful breakout could open the road towards 0.10 USDT and beyond.
2️⃣ Bearish Case: If price fails to hold the support and breaks below 0.065, then we may see another retest of the lower support zone (0.05 – 0.06).
⚡ Trader’s Eye Tip:
Always wait for confirmation candles before entering trades in such squeeze patterns. False breakouts are common in this kind of setup.
Risk management is key — set tight stop-loss levels to protect capital.
📌 Final Thought:
The market is coiling, and big volatility is coming soon. Keep MOCA/USDT on your watchlist — whichever side breaks, momentum will follow.
–––––––––––
👉 If you found this analysis helpful, LIKE, COMMENT, and SHARE this post so more traders can benefit.
👉 Don’t forget to FOLLOW for daily technical analysis updates and trader’s insights.
#Crypto #MOCA #USDT #TechnicalAnalysis #TradingTips
###ListedCompaniesAltcoinTreasury
#TrumpFamilyCrypto best of luck 🤞 🍀 🤞