---
🚀 ETH/USDT Technical Outlook (4H Chart) 🚀
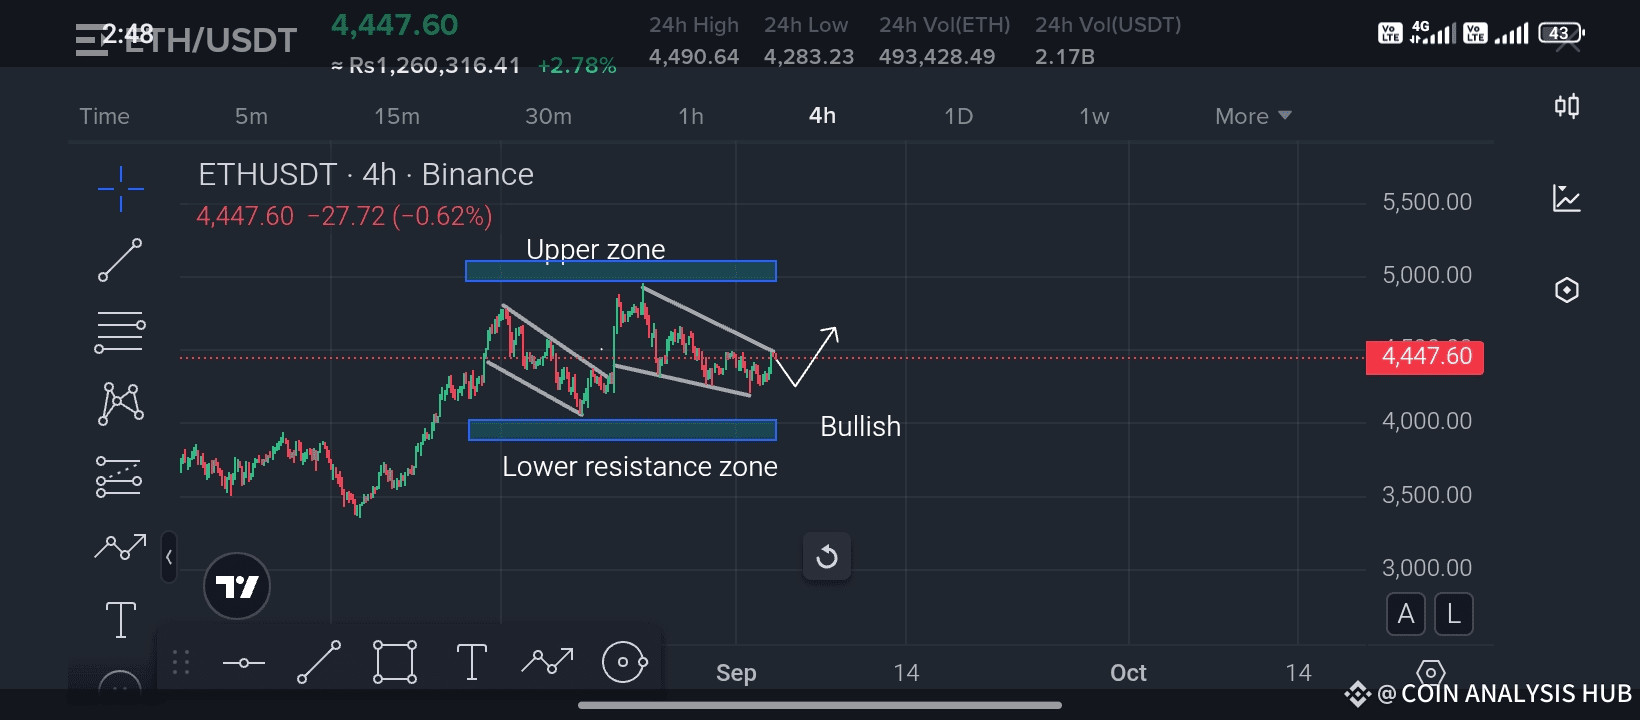
Ethereum is currently trading around $4,447, showing signs of strength even after a slight retracement of -0.62%. Let’s break down the current market structure from a trader’s perspective:
🔹 Price Action Update
ETH has been moving inside a descending channel, with repeated tests of both the upper and lower boundaries. This type of price structure often signals accumulation before a breakout.
🔹 Key Zones to Watch
Upper Zone (~$4,900 – $5,000): Strong resistance. A clean breakout above this level could open the doors for ETH to retest $5,200+.
Lower Support Zone (~$4,100 – $4,200): Solid demand area where buyers have previously stepped in aggressively.
🔹 Bullish Bias
Currently, ETH is showing signs of a potential bullish breakout from the descending channel. If price sustains above the mid-range, we may see an impulsive push upward. A healthy retest followed by strong volume confirmation would make the breakout more reliable.
📊 Trader’s Tip:
Patience is key. Wait for confirmation before entering. Chasing early often leads to stop hunts. A safer entry could be after a confirmed breakout and retest.
---
🔥 Engage With the Community!
If you find this analysis useful, don’t forget to:
✅ Like ❤️
✅ Share 🔄
✅ Comment your views 💬
✅ Follow for daily technical updates 📈
Your support motivates me to keep sharing free, high-quality trading insights. 💵💪
---#ListedCompaniesAltcoinTreasury
Best of luck 🤞 🍀 🤞
