🚨 Trader’s Eye Technical Analysis – NEWT/USDT (15M Chart) 🚨
Currently, NEWT/USDT is trading around 0.2812, and we are witnessing a very interesting consolidation phase after the recent move. Let’s break it down step by step:
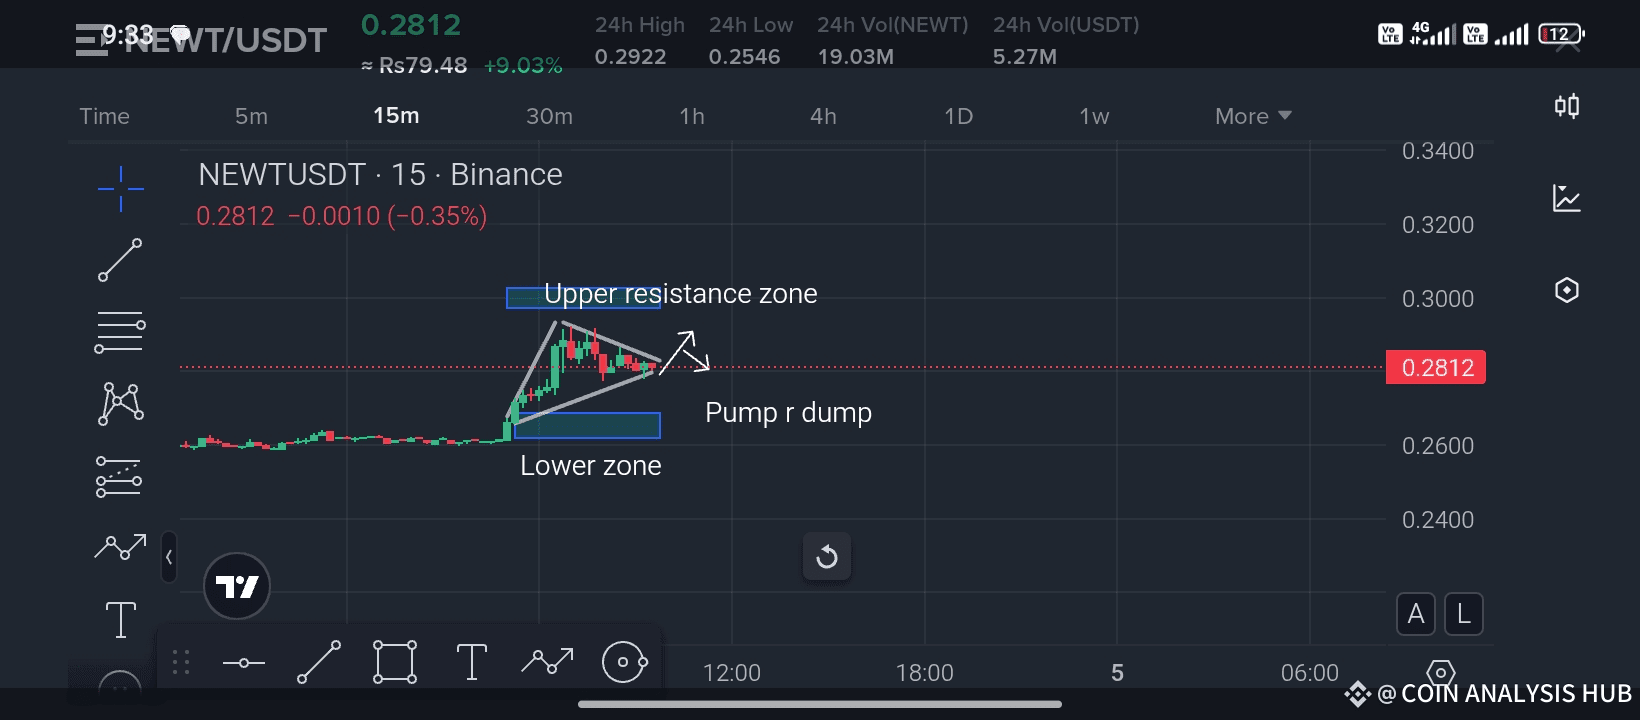
📊 Chart Overview:
Price has entered a triangle pattern formation, which usually signals that a strong move is coming next.
On the upside, we have the Upper Resistance Zone near 0.2920 – 0.3000. A breakout above this level could trigger fresh buying momentum, leading to another bullish leg (Pump).
On the downside, the Lower Zone around 0.2600 – 0.2650 is acting as crucial support. If price loses this zone, we could see a dump toward lower levels quickly.
This tight squeeze in price action indicates that volatility is loading up – be ready for a sharp move in either direction.
⚡ Key Levels to Watch:
Resistance: 0.2920 / 0.3000
Support: 0.2650 / 0.2540
📌 Trader’s Insight:
If the breakout is on the upside → Look for entry above resistance with targets towards 0.3200+.
If the breakdown happens → Be cautious as sellers may drag it back to 0.2500 or lower.
Always wait for confirmation, don’t jump in early during this kind of pattern.
💡 Pro Tip: Triangle patterns are known as “decision zones.” Smart traders don’t guess, they prepare for both scenarios and act only when confirmation comes.
👉 If you found this analysis helpful, LIKE, SHARE & FOLLOW my channel for more real-time technical updates. The more you support, the more motivation I get to bring you daily eye-catching insights straight from a trader’s perspective! 📈🔥
##ListedCompaniesAltcoinTreasury
Best of luck 🤞 🍀 🤞
