Current overview price of Bitcoin market:
Bitcoin is currently reported at around 113,460, having previously fallen below 113,000 to 112,223, but quickly rebounded.
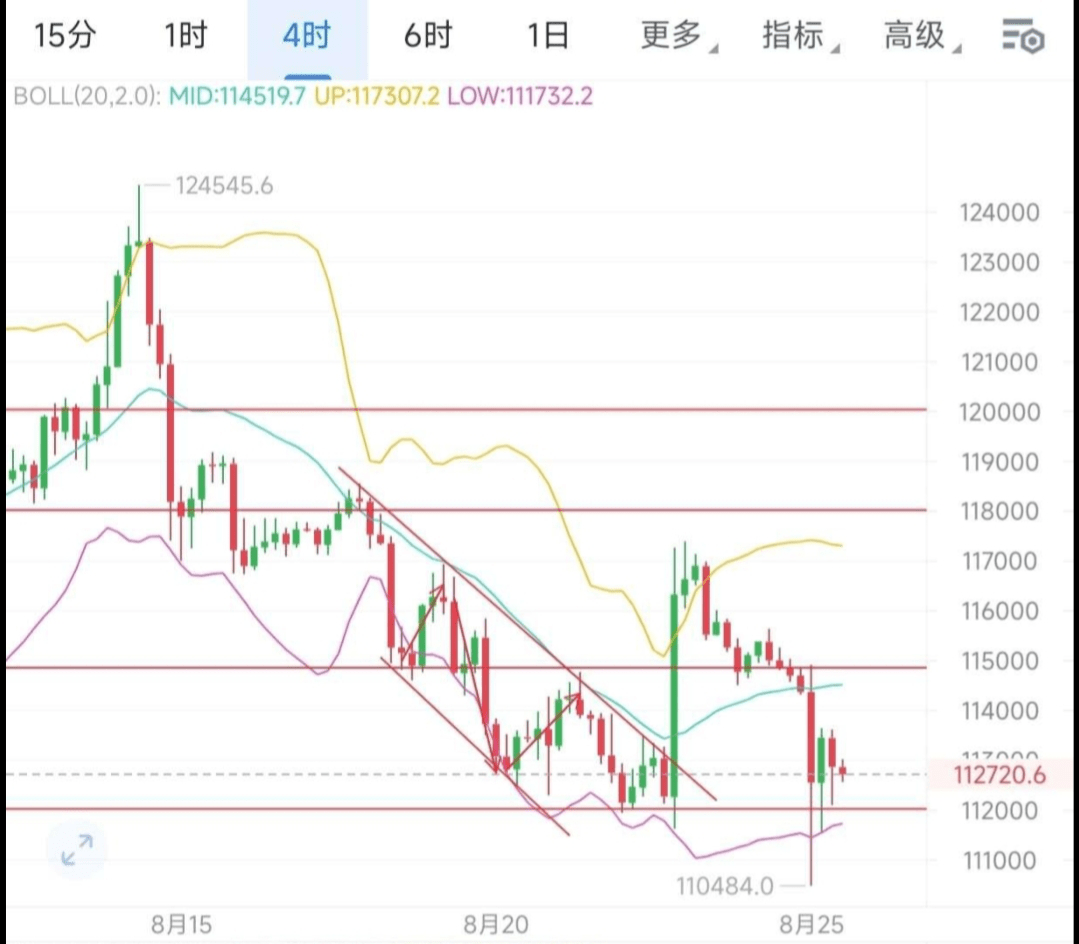
Key support level: The 112,000 - 113,000 area is currently an important support, along with the SuperTrend indicator position
Basically consistent. If the daily closing effectively falls below this area, it may further test the support at 108,000 or even 100,000-104,000.
Key resistance level: 124,000 is the recent strong resistance.
Technical indicator signals:
The 4-hour MACD bears continue to expand, but the 1-hour level bears have decreased, indicating that there may be a possibility of reversal or slight technical rebound in the short term, but overall downward momentum has not been completely relieved.
The daily MACD is in a death cross state, with an RSI value of 42.99, indicating a weak short-term trend.
Market sentiment: The long-short trend index shows 42/100, with market sentiment leaning towards the bearish side.
Main bearish factors in the market: This wave of decline and market fluctuations are mainly influenced by the following aspects:
Macroeconomic policy and economic data: The market is closely watching Federal Reserve Chairman Powell's speech at the Jackson Hole Economic Policy Symposium, as well as subsequent interest rate decisions. The U.S. July CPI year-on-year increase is 2.7%, still above the Federal Reserve's 2% target. A high interest rate environment is generally unfavorable for risk assets like Bitcoin.
Technical profit-taking and liquidation: After Bitcoin set a historical high at the beginning of August, there is a technical correction pressure. Data shows that there have been single-day long positions exceeding 250 million recently liquidated, exacerbating short-term selling pressure.
"Whale" behavior and market manipulation concerns: Some analysts have pointed out that there are a large number of abnormal buy orders at low levels in the exchange order book, which may indicate price manipulation to guide prices downward.
Changes in market liquidity structure: Although the proportion of institutional trading has increased, retail liquidity has decreased, making the market more sensitive to large transactions, and price fluctuations are more easily amplified.
Operational recommendations reference
You mentioned the idea of going long near 112500/112000, which is close to the current key support area.
Long position strategy:
Entry area: The range of 112,000 - 113,000 can consider a phased light position long. This position is an important support convergence area.
Stop-loss setting: If it effectively falls below 111,200 or 111,000, it is necessary to consider a stop-loss to guard against deeper correction risks.
Target looking towards: The initial target can be set at 114,500, and if it can break through, it can further look towards 116,000 - 118,000.
Short position strategy:
If the price rebounds to around 116,000 - 116,500 and momentum weakens, it may be a short-term shorting opportunity.
If the price unfortunately falls below the 112,000 support and confirms, caution is needed for chasing shorts; strong support below is at 108,000 and 100,000 - 104,000.