

There are two key support zones below Shiba Inu that can provide buying opportunities for traders.
Key Points
The Shiba Inu lacks a clear price trend, which is a tricky issue for traders. However, its range-bound price movements mean swing traders will find buying and selling opportunities at key support and resistance levels.
Shiba Inu [SHIB] has been range-bound for the past six months. In recent weeks, the stock has lacked a strong upward trend in higher time frames.
On lower time frames, as of the time of writing, the price tends to be bearish and may drop further, although there is some buying pressure.
According to CoinMarketCap, the memecoin market capitalization has dropped by 18.8% in the past month.
Industry leader Dogecoin [DOGE] has also been trading within a range since March. In mid-July, it attempted to break through a bullish trend but failed.
The Shiba Inu's level is below average—what's next?
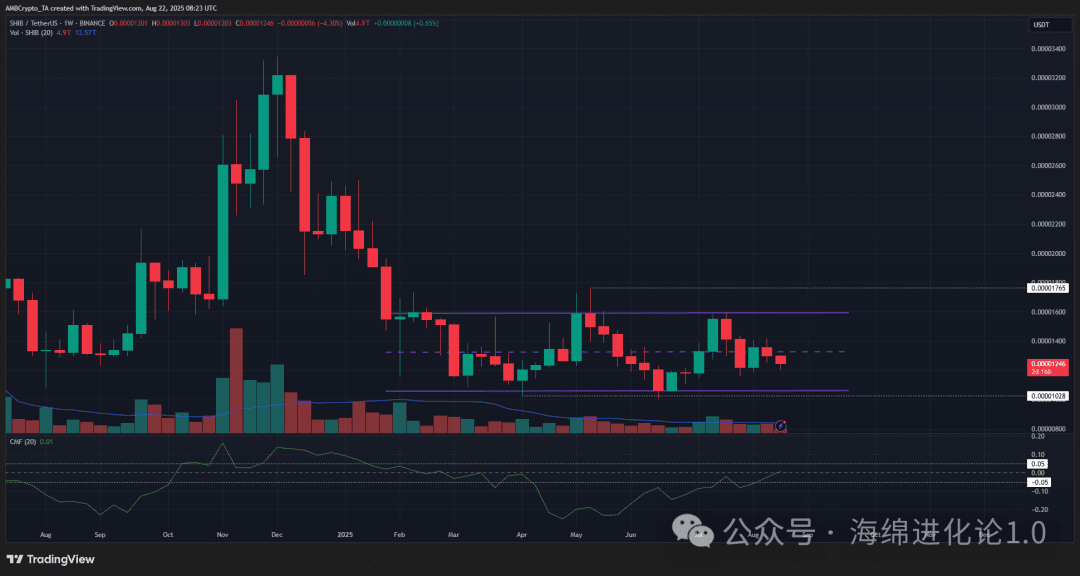
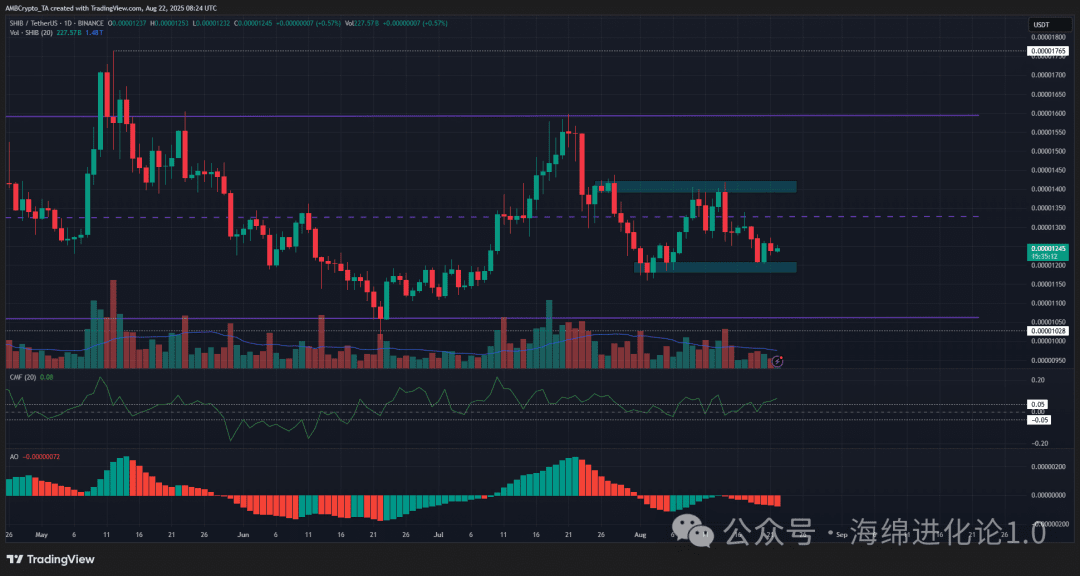
The volatility points on the 1-day chart are at $0.00001765 and $0.00001028.
The CMF shows a winding upward trend but remains below +0.05. Therefore, there is buying pressure during this time period, but it has not yet peaked.
Additionally, the median price of $0.00001328 has been tested again as a resistance level in the past 24 hours. This indicates that the price is likely to drop further towards the range low.
The 4-hour chart shows some optimism. The momentum oscillators are below the zero line, reflecting bearish momentum, but the CMF indicator is above +0.05. Additionally, short-term support/resistance levels are at $0.00001184 and $0.00001415, respectively.
Traders can expect that previous levels will become support after a retest and seek to buy. A drop below $0.0000116 will signal insufficient bullish strength, in which case traders may close their positions.
Similarly, retesting the $0.0000105 range low will also provide a buying opportunity.

