Today, we will focus on SOL's one-hour candlestick chart, deeply analyzing its future trend from the perspectives of news, technical analysis, and personal strategy. If you are holding SOL or paying attention to its movements, this article will provide you with key judgment basis!
Technical analysis: Golden cross formed, Bollinger Bands narrowing signal big market movement.
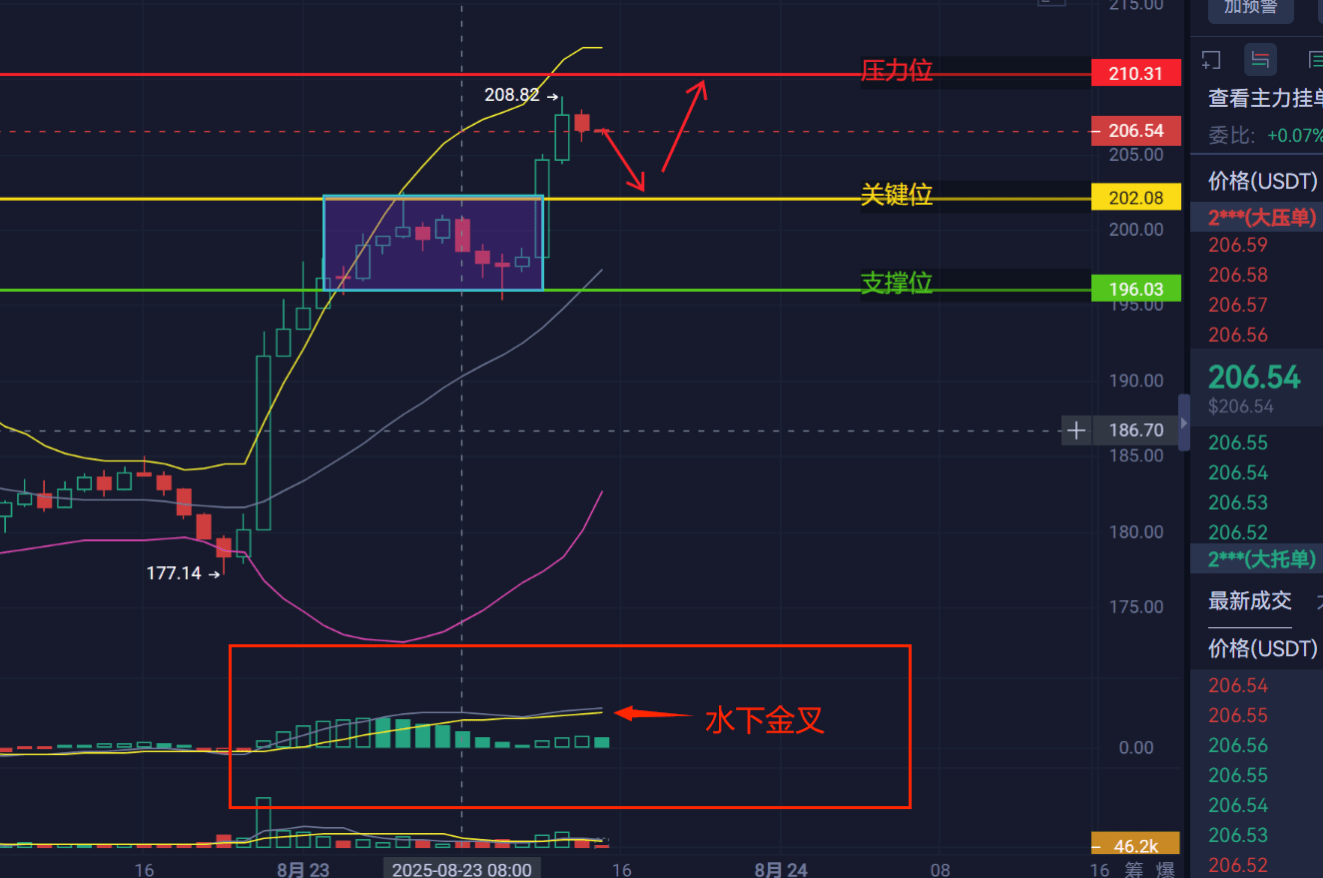
Currently, SOL is below the upper Bollinger Band and above the middle band, showing a clear golden cross trend, which indicates that short-term bullish momentum is accumulating. The key resistance level is at 210 USDT, while solid support lies around 196. It is worth noting that 202 is an important psychological and technical resonance level: if this position can be effectively stabilized, it will greatly likely stimulate buying follow-up, pushing the price to test the 210 resistance level upwards.
From the perspective of trading volume, although volatility has recently narrowed, large sell orders have densely appeared in the 206.60–206.62 range (as shown in the attached chart with 'large sell orders'), indicating that both bulls and bears are engaged in fierce combat around this area. Once a breakthrough occurs, short sellers' stop-loss orders will help push the price up rapidly.
News support: Active ecosystem + institutional layout, SOL's fundamentals are strong.
Solana's ecosystem has been developing rapidly recently, with frequent activities in NFT, DeFi, and Memecoins, and on-chain trading activity consistently ranking among the top three public chains. Meanwhile, multiple institutions are continuing to increase their holdings of SOL, especially against the backdrop of ETF expectations still not materializing. As a technically advanced high-performance public chain, the medium to long-term value of SOL continues to be widely optimistic.
Additionally, with Bitcoin not stabilizing at high levels recently but market sentiment warming up, altcoins are迎来 rotation opportunities. As one of the leaders, SOL has strong potential to lead the gains.

Personal views and strategies on convergence:
I believe that as long as SOL stabilizes above 202 and breaks through the 206.62 sell order area with volume, it is highly likely to quickly attack 210 in the future market, potentially opening up even higher space. In terms of operation, it is recommended to gradually build long positions in the 202–203 range, with stop-loss set below 198, targeting first at 210, and if broken, holding until 215–218.
But be aware — if it fails to stabilize above 202, it may fall back to 196 support to recharge. Therefore, the 202 position will be the dividing line between bulls and bears in the future market.
Do you want to know the key target level after SOL breaks 210? Or how to respond if it falls below 196? Which time window is most likely to change the trend next? Feel free to follow convergence, as I will provide more precise point judgments and practical strategies in future analyses!
SOL is currently at the end of a triangular convergence, with technical and news aspects resonating with each other. For short-term operations, it is recommended to closely monitor the stability at 202, while the medium-term outlook still favors trend continuation. Remember: in a bull market, don’t guess the top, but follow the rhythm.
I am a convergence analyst, focusing on market logic dissection and point strategy. If you want to avoid being shaken out and capture the main uptrend, follow the convergence master, with a concise introduction is your best choice.

