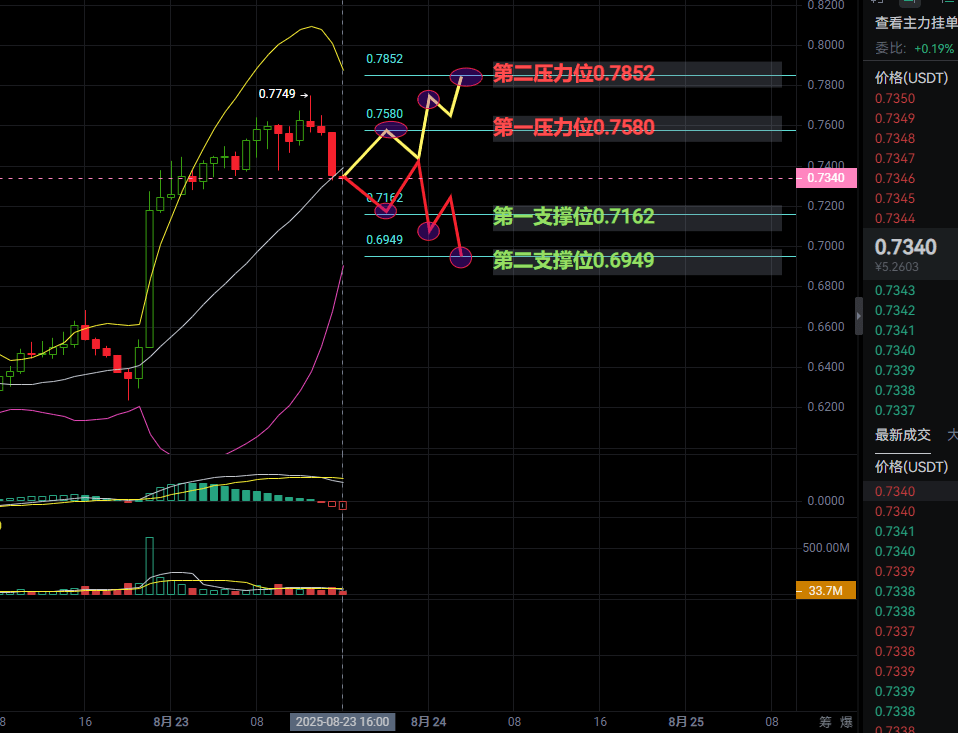
Critical Technical Position Game Analysis:
Bollinger Midline Battle: The current price of 0.740 is testing the 1H Bollinger midline dynamic support (EMA20). If the closing price effectively falls below this position, it will confirm a short-term trend reversal to bearish. Notably, the Bollinger band width has shrunk to its lowest since July, indicating an imminent volatility explosion.
Death Cross Resonance Pressure: The MACD fast and slow lines form a death cross above the zero axis and continue to diverge, the RSI (14) shows a bearish 'descending wedge' structure, and the OBV energy wave indicator is also weakening, indicating accelerated capital outflow.
Bull-Bear Watershed Positioning: The upper pressure point at 0.758 (previous high resonance area) and the lower support at 0.716 (Fibonacci 23.6% + on-chain large order congestion zone) form an intraday pivot range, with the breakout direction determining the short-term trend.

Macroeconomic Driver Interpretation:
After Powell released a clear signal for a September interest rate cut at the Jackson Hole meeting, ENA completed a 15% price increase at the 1H level. However, historical patterns must be heeded: Cryptocurrency typically experiences 'expected realization pullbacks' within 72 hours before an interest rate decision. CME Federal Funds futures currently price in a 78% probability of a September rate cut; if actual data falls short of expectations, it may trigger collective profit-taking sell pressure.

Exclusive Convergence Simulation Model:
Pessimistic Scenario (Probability 45%): A drop below the 0.716 support will trigger a strong liquidation of long positions in perpetual contracts worth $38 million, cascading down to 0.695 (38.2% Fibonacci), with extreme conditions seeing 0.650 (on-chain Gamma gap).
Optimistic Scenario (Probability 55%): If the 0.716 support holds and is accompanied by a surge in trading volume (needs >33.7M baseline volume 50%), a 'false breakout followed by a real rally' structure will form, targeting 0.785 (previous high) + 0.800 (psychological level).
Options Market Signals: Deribit data shows that the put/call ratio for the 0.700-0.750 strike price has surged to 1.8, reflecting a spike in institutional hedging demand, but large bullish options trading remains focused on the 0.800 position.
Practical Trading Strategy:
Breakout Trade: After the price recovers 0.758 with increased volume, chase long positions with a target of 0.785/0.800 and a stop loss at 0.748.
Reversal Game: The first signal of stability upon touching 0.716 (long lower shadow + OBV divergence) suggests going long, targeting 0.740 with a stop loss at 0.712.
Hedging Strategy: Buy a put option with a strike price of 0.700 expiring in one week while holding a spot position.
Convergence Indicator:
At 20:30 Beijing time on August 28, the number of people filing for unemployment benefits will be released. If the data exceeds expectations, it may reverse interest rate cut expectations and trigger cross-asset sell-offs. Strictly set stop-loss positions to avoid naked long exposure.
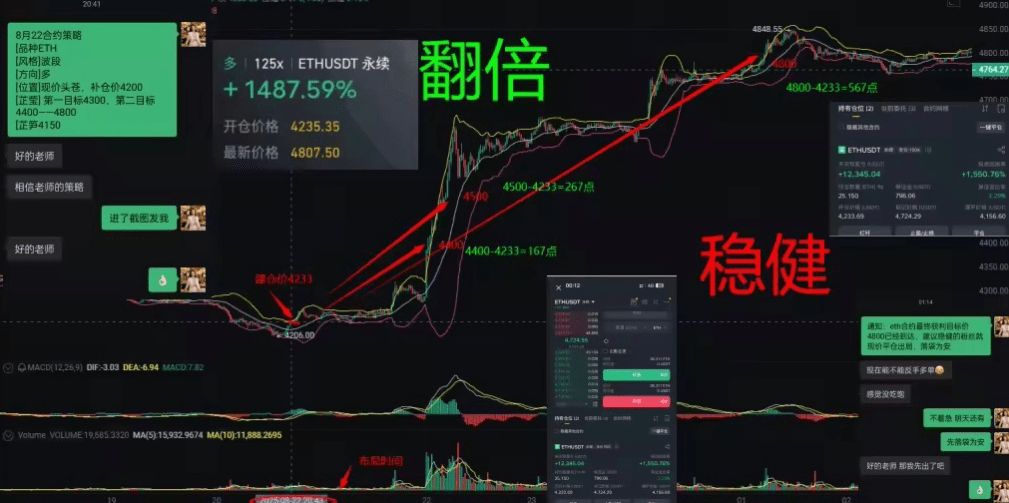
#亚洲家族办公室加密资产配置
Still going solo? OUT! Click on the avatar to follow the Convergence Team and let them take you higher, serving only those ambitious enough to dream big!
$ENA
