The market is at a level where a rapid pullback could turn into a long-term recovery.

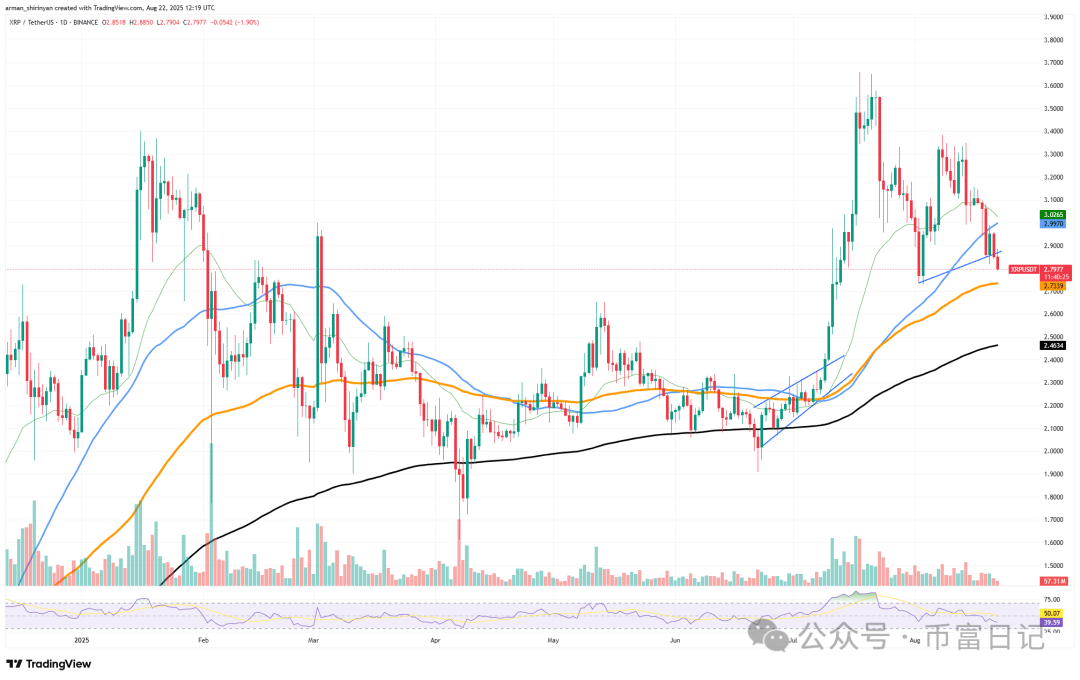
XRP has fallen below the rising trend line, indicating a weakening short-term momentum and is currently at a critical point. XRP is currently trading at about $2.86, having breached the key support trend line that led its rise.
Despite indicators showing that buyers may be declining, a rebound is still possible if momentum picks up. The Relative Strength Index (RSI) is currently slightly below 40, which is one of the best indicators. Generally, this level suggests that the asset is approaching an oversold area, and selling pressure may begin to weaken. In past XRP cycles, similar RSI readings often precede significant rebounds.
Given that the market is at a technical crossroads, the RSI indicates that a rebound may occur in the coming trading days. The continued decline in volume further complicates this situation. Due to declining confidence in the market regarding sell-offs, relatively small buying pressure could reverse market momentum and drive it back upward, as indicated by the declining participation.
To regain an upward structure and further rebound, XRP may need to reclaim the area between $2.95 and $3.00. However, risks still exist. The 50-day moving average is currently below the current price, making it a key battleground. Falling below this level could accelerate XRP's decline towards the 100-day moving average (located at $2.74). This area may represent the last line of defense before a larger-scale correction for XRP.
Overall, the XRP chart shows weakness but has not given up. If the oversold RSI indicates that the downward momentum may soon stall, bulls might quickly have the chance to reclaim lost ground. If trading volume increases and remains above the moving average, XRP could still rebound.
Bitcoin's divergence
In addition to showing a clear bearish divergence in the RSI, the leading cryptocurrency recently fell below the 50-day moving average, a historically significant support level. This pattern indicates that although Bitcoin's price hit an all-time high earlier this month, its potential momentum is gradually weakening.
This is a risky situation that often occurs before a prolonged correction. Since this divergence reflects the market conditions of June 2022, when a similar situation preceded a deep and sustained sell-off, it is particularly concerning. Although the price action initially appears bullish, the RSI has been trending downward during both declines as the price rises, indicating waning buyer strength. The eventual crash led to a series of liquidations, and the current market conditions suggest that history may repeat itself.
The noticeable drop in trading volume reinforces the bearish view. Typically, a decline in volume during a correction indicates insufficient demand at the current price level. Given that Bitcoin's current trading price is slightly above the 100-day moving average of $110,600, the likelihood of further declines will increase in the absence of strong buying support. If the 200-day moving average falls below $103,500, it could become the next critical defense line.
The RSI is another warning signal, as it is currently approaching the neutral zone of 40. If the RSI drops below 40, bearish sentiment will strengthen, potentially accelerating the downward trend. Given this, the market is in a delicate balance, and further selling pressure may trigger additional declines.
Ethereum is not bearish
With Ethereum once again demonstrating resilience, there is speculation that it may break through $5,000 as early as September. After experiencing several weeks of explosive growth, ETH had to go through a necessary correction, falling from around $4,800. Crucially, this correction occurred within a manageable range, with ETH rebounding from the 26-day moving average and staying above $4,200, which traders currently view as a short-term support level. Corrections are often seen as a way to cool the market, and Ethereum seems to have successfully achieved this.
While the recent correction has cleared speculation and excessive leverage, the volume pattern indicates that sellers are diminishing as buyers gradually regain control. The RSI has normalized after previously entering the overbought area, creating technical space for further upside. Ethereum's self-driven correction mechanism makes it particularly noteworthy. The decline in Ethereum was not triggered by panic selling, but rather resembles a consolidation phase rather than a sudden market crash. This behavior is typically a bullish signal, indicating that the asset is stabilizing and then continuing its current trend.
If Ethereum maintains above $4,200 and buyers continue to step in, the likelihood of retesting $4,800 will increase. If it breaks through that resistance area, it could aim for the psychologically significant $5,000 level. With Bitcoin consolidating and altcoins gaining momentum, Ethereum is once again in the spotlight for investors.
Although there is no absolute certainty in the cryptocurrency space, the charts indicate that ETH has laid a stronger foundation for future growth. Ethereum may ultimately achieve the long-awaited target of over $5,000 in September.


